The money quote in the PAGES2K abstract was that there wasn’t any worldwide Little Ice Age of Medieval Warm Period and that AD1971-2000 temperatures were the highest in nearly 1400 years, long before the Medieval Period:
There were no globally synchronous multi-decadal warm or cold intervals that define a worldwide Medieval Warm Period or Little Ice Age … during the period ad 1971–2000, the area-weighted average reconstructed temperature was higher than any other time in nearly 1,400 years.
In today’s post, I’ll show that the knock-on impact of changes to the Arctic reconstruction on the area-weighted average also make the latter claim untrue. Incorporating the revised Arctic reconstruction, one can however say that, during the period AD1971–2000, the area-weighted average reconstructed temperature was higher than any other time since, uh, the Medieval Warm Period.
Area Weighted Average
In the figure below, I’ve compared area weighted averages (both in SD Units as in PAGES2K) from PAGES-2103 to the corresponding series, replacing Arctic2K-2013 with Arctic2K-2014. PAGES2K converted each of the regional averages to SD units and then averaged in SD units (basis AD1200-1965) – an odd procedure given that each regional series was already in “deg C”. Rather than argue over the procedure, I’ve implemented their method in as reasonable a way as I could. (They did not archive their regional average, so I crosschecked by overplotting on figure and got a close but not perfect match.)
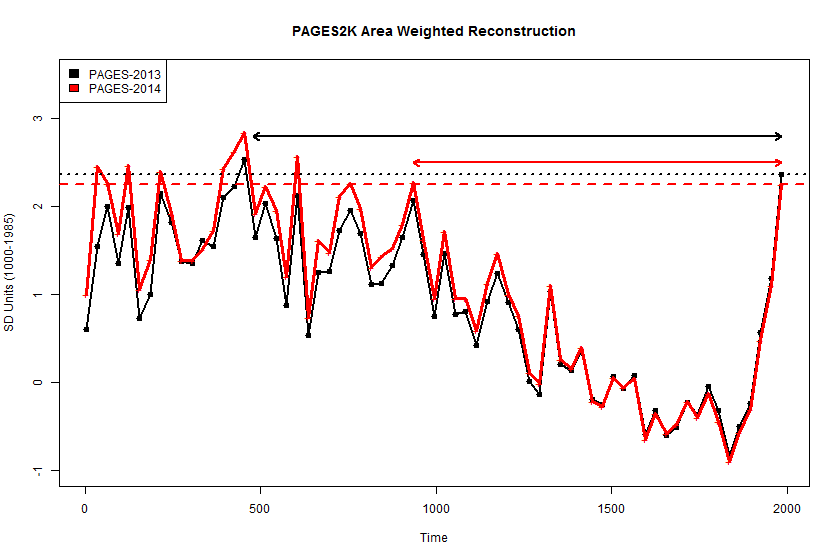
Figure 1. Area Weighted Averages. Black – PAGES-2013 version; red – replacing Arctic2K-2013 with Arctic2k_2014. Area weighted averages calculated using PAGES2K area weights. The two North American series were first converted to step functions and averaged; I don’t know exactly how PAGES handled this, but it’s not like there’s any “right” way and the way used here is reasonable.
One of the idiosyncrasies of multiproxy studies is that they agree on almost nothing except a very slight accounting advantage of the modern warm period over the medieval warm period. In this case, the narrowness of the accounting margin means that relative results for their “global” average are vulnerable to something as seemingly individual as their Hvitarvatn miscue (which is the main contributor to the Arctic2K changes).
In the present case, the Arctic2K changes result in a slight lowering (0.11 SD Units) of the AD1971-2000 area-weighted average and approximately 0.2 SD unit increase in the medieval period, including AD921-950, values of which now slightly exceed AD1971-2000. In the PAGES2-2013 version, the AD1971-2000 period was the warmest in “over 1400 years”. In the revised version, it is still the warmer than values in the Little Ice Age and indeed warmer than any period since, uh, the Medieval Warm Period.
By showing the above graphic, I do not imply any endorsement of other parts of PAGES2K. The most extreme closing value of the area-weighted reconstruction comes from the zombie Gergis reconstruction, rejected by the Journal of Climate, and occurring here as a rider to the omnibus reconstruction, an “earmark” for the paleoclimate community, so to speak.


52 Comments
I am curious what happens to the graphic if the zombie Gergis reconstruction is left out. Does the hockey stick blade largely disappear?
Steve: I’ve haven’t checked the effect, but there’s a very distinct blade in the amended Arctic reconstruction which I’ve presented, so why would you think that this would disappear without Gergis. Further, it is very evident that end 20th century temperatures are warmer than 19th century temperatures.
Why has the 20th Century shown such a surge in recorded temperatures after a steady decline? CO2 is discredited as a driver, was it UHI?
With the fall now of the PAGES2K hockey stick, as well as all the others you have refuted, I’m wondering if you are aware of any “valid” in your option “hockey stick” reconstructions remaining in the literature at this point which convincingly show recent temperatures are unprecedented.
Mann has repeatedly tweeted that skeptics won’t mention PAGES2K since they allegedly can’t refute it, and showed the PAGES2K reconstruction at his UCLA talk last week, claiming it was part of the “hockey league” of “every study shows that recent temperatures are unprecedented.”
With the fall of PAGES2K, do you think we may now say the Mannian “hockey league” is disbanded?
Steve: I haven’t been shy about mentioning PAGES2K. As I’ve said repeatedly, finding flaws in these studies doesn’t prove the opposite: doesn’t prove that the medieval period was warmer than the present. Only that the studies haven’t proved the opposite. It takes time to parse these studies, particularly when they combine new data with novel, poorly understood and relatively inaccessible methods.
Darn spell-checker changed “valid in your opinion” to “valid in your option” above
I repeatedly asked if anyone could provide
any raw data of proxies with annual resolution that would confirm the alleged evolution of temperatures in the twentieth century.
I never got anything.
I would add that there are many data with excellent high frequency correlation with instrumental data, but unfortunately, in these cases, never a clear positive trend for the entire twentieth century.
It may a lack link and a conlusion: is there a special time to observe the death of a ghost?
phi
You could try clicking on the link ‘Proxy Data’ helpfully provided on this site
AndyL,
Thank you for the suggestion but it does not help. There is simply no raw data of proxies good enough (good high frequency correlation with instrumental data) showing a significant warming trend for the entire twentieth century.
This can mean two different things:
a) For some reason, there is no temperature proxies suitable and therefore it can not be any valid reconstruction.
b) Instrumental data are faulty.
As proxies of quality tend to be concordant, option b) is more likely.
phi,
I don’t think anyone here works for you.
But, my good sir, here I speak to those who pay, not those who work.
“There is simply no raw data of proxies good enough (good high frequency correlation with instrumental data) showing a significant warming trend for the entire twentieth century.”
phi is stating here the proposition that one can in some cases obtain an excellent high frequency correlation between a proxy and temperature but yet have a low frequency correlation (trend) that does not fit well at all. I think the proxy here that phi references is shown by example for the MXD proxies with divergence.
It is subtle observations like this one that ought to be of great scientific interest to climate scientists for further and more detailed study. Instead it is ignored in favor of assuming the validation of temperature proxies has been made by some kind of consensus opinion/assumption.
This example also shows a dilemma of ex post fact selection of proxies (which is a basic error from the start) in that getting around the problem of a obtaining spurious low frequency correlations from proxies with longer term memories (autocorrelation and long term persistence) requires, some like the authors of the Gergis reconstruction thought, to detrend or use first differences to find good higher frequency correlations. But as already noted a good high frequency correlation does not mean the the lower frequency correlations (trends) will follow the instrumental temperature record.
.
“I repeatedly asked if anyone could provide
any raw data of proxies with annual resolution that would confirm the alleged evolution of temperatures in the twentieth century.
I never got anything.”
1. you are asking people to do your homework!
2. This has been shown in various ways
A) http://www.ncdc.noaa.gov/news/independent-evidence-confirms-global-warming-instrument-record
B) using records of pressure only Here is the poster. go find the paper.
note pressure can be thought of as a proxy for temperature.
Click to access Sardeshmukh_EarthTemp_2012_Edinburgh_Poster.pdf
Steve: instrumental pressure, regardless of its merits, is not a “proxyy” for temperature that is relevant to paleoclimate.
snip
Steve: this discussion of instrumental pressure is not relevant to proxy reconstructions. As to your underlying question about proxies, I’ve hardly been a defender of tree rings and other proxies: perhaps you meant to ask your question at some other blog.
Steve,
I am very surprised by your moderation policy.
That said, I brought more a fact than a question.
Steve: sometimes I am more involved in dealing with OT topics than other times.
Of course it’s relevant. If instrumental temperature records can be used as proxies, then sure other instrumentals are valid.
The next part is off topic, but I think the use of reconstructions as proxies should be looked at more closely.
Some papers are more egregious than others. Some don’t have ‘hockey stick’ shapes, and instead appear to be a quest for the claim,’Warmest in x years’ with x>1000. Seems like the ones that have the fewest criticisms are the ones that get attacked by Mann and co, at least in private. Loehle, Moberg, Esper, etc.
With the fall now of the PAGES2K hockey stick
But there is so much still to look at. For one, I would like to see some treatment of the European tree series without the interference of the “documentary” (ahem) Eur_11 “proxy.”
Yes, there will be an uptick in the 20th century but the rather sharp rise in the 20th century and the lack of a MWP suggest there is an outlier proxy series driving the results.
Steve: unless you’ve done research on this data that I haven’t done, there’s not much point speculating.
The money quote was also reflected in Mann’s latest brief (p. 7):
Jean S:
An even more recent study by one person, sponsored by no one, showed that conclusion to be untrue.
Reminds one of Dr. Johnson, who, when asked how he could complete his dictionary in 3 years when it took the 40 members of the French Academy 40 years to complete their dictionary, replied: “Sir, as 1600 is to 3, so is the proportion of an Englishman to a Frenchman.”
I thought Pages 2K exonerated Mann without investigating him?
That which is attempted in vain by the many, is done well by the few. Occam’s razor strikes again.
I realise that commas and decimal points get exchanged depending in local convention, however “… than any other time in nearly 1.400 years.” could be true in one sense and not the other, if you see what I mean.
Sorry, couldn’t resist! 😉
SM
By showing the above graphic, I do not imply any endorsement of other parts of PAGES2K.
————
So if you believe that reconstructions are invalid isn’t it a bit wrong wiring a headline like:
“Warmest since, uh, the Medieval Warm Period”
and The “Third Warmest Arctic Century” and your comments may not add up to anything since YOU do not know what the temp of the arctic was
wiring = writing
I find it amazing so much is made of errors in these proxies but people then point to the graphic used in the FAR and say that it proves that there was a med. warm period – fact!. (despite there being no vertical scale of temperature.
I find it even more amazing that having accepted the FAR plot and not accepted any IPCC modelling they will then point to a plot going back millions of years and make the statement that CO2 was at 7000ppm and temps were cold so CO2 is proven to have no effect. (the plot is of course a CO2 MODEL (geocarb3) overlaying a hot, very hot, cold, very cold, plot from Mr. Scotese who did not intended it to show °C differences!)
Steve: I’ve never argued that errors in IPCC multiproxy studies prove that the medieval period was warmer than the modern warm period nor precluded the possiblity that valid proxies and methods could demonstrate what previous studies didn’t. However, these studies are presented as having been thoroughly reviewed and reflecting the best knowledge of specialists, so it is disquieting to find that they make elementary errors and that they do not establish their point. It’s worse when errors are not conceded and thus repeated, as, for example, Mann’s use of contaminated sediments.
Not that difficult, sergei…the headline refers to the findings in the paper with the revisions, not some reconstruction done by Steve M.
Since the result is so close, I would imagine that Kaufman et al will be able to make choices in their analysis that leave the modern period slightly warmer than MWP. One wonders if including a few more of the corrections you suggested would make that impossible.
Steve: given that it is so close, isn’t it amazing that the Team always makes choices so that the modern warm period comes out slightly warmer than the MWP. It’s curious that their accounting choices always show a “profit”. If Kaufman had been aware of the Hvitarvatn issue, would they have figured out a “good” reason for excluding it form their network or tweaked other series so that the modern warm period was slightly warmer than the MWP? You tell me. If the “other” studies all used independent data, then this sort of thing wouldn’t matter, but the “other” studies use the same data over and over. The vulnerablity to data snooping is clearer when there;s a gross error, but it still exists in the other studies.
Thankyou for your analyses.
I’m reminded of a master’s thesis that tested habituation of Great Blue Herons to human activity.
It was a very good effort.
But often misquoted by environmental alarmists, who can find in it words to support their desire to restrict human use of parks. Besides poor writing (failure to parse, too much repetition), it seemed as though it had politically correct statements added to appease those the author needed to get approval from to get his degree.
(Usually referred to as “Vennesland 2000”, in the unlikely event you are interested. Author Ross Vennesland.)
Small typo in first sentence, word “of” should be “or”.
You may delete this post.
> and occurring here as a rider to the omnibus reconstruction, an “earmark” for the paleoclimate community, so to speak.
Have you become familiar with US Government, or does Canada do the same thing?
Steve: U.S. lingo; no comparable system in Canada.
At what point in these matters does the term willful negligence apply?
These plots always look so contrived…almost amateurish.
Change of pace but there was the invention of this plow, forgot the name,which allowed the turning of the heavy European soils and a significant increase in grain production. There was the warming. There was the resurgence of the Celtic or “Gaulic” metallurgical tradition and the development of heavy armored cavalry (commonly thought of as Knights)which first allowed Charlemagne to repel the Moors in Spain and eventually led to the crusades.
All of this would have been vastly more difficult or impossible in the “little ice age”.
snip – editorializing
Edit: “Little Ice Age of Medieval Warm Period” — … Age or Medieval …
I think that this 2012 review article in Quaternary Science Reviews by Tingly and several other authors contains discussion relevant to some comments in this thread:
Click to access Tingley2012_piecingQSR_165104.pdf
Chapter 6.2 discusses issues important for screening by comparison with instrumental data. One sentence refers to the approach of Mann et al (2008):
As examples, the supplement to Mann et al. (2008) describes how only those candidate proxy time series that exhibit a significant correlation (p < .10) with one of the two closest instrumental time series were used in the ensuing reconstruction, ..
A little later in the same paragraph a major problem of screening is brought up:
On the other hand, such procedures can result in reconstructions with artificially high levels of skill over the interval used for screening, and no skill whatsoever elsewhere. This is even more likely in the context of autocorrelated time series, where it is well known that the empirical correlation between two independent, autocorrelated time series is highly variable and can possibly appear large (Yule, 1926; McShane and Wyner, 2011).
The whole paragraph is quite readable.
My own impression is again that most (or all) of the major issues have been recognized and fairly well understood by (at least many) paleoclimatologists, but the limitations of the data remain so severe, that compromises are made in the actual analysis, and that some of those compromises raise essential questions.
Steve:
IMO your paragraph is wildly over-optimistic about the state of affairs in paleoclimate. FYI issues arising from ex post screening were raised at blogs long ago (and in more detail than the Tignley paragraph) with the effect being denied or obfuscated by nearly all paleoclimatologists. Though not cited by Tingley, Ross and I mentioned it in our 250 word comment on Mann et al 2008, citing David Stockwell in AIG News 2006, though the effect had been discussed at CA, Lucia’s, Jeff Id’s, Lubos Motl and denied by the Team. Mann’s response reflects the nearly universal view of academics in this field:
The discussion in Tingley et al is merely passim and does not constitute a thorough analysis of the phenomenon. the comments in Tingley et al are passim and there is no thorough discussion of the phenomenon in academic paleoclimate literature that is remotely as thorough as the blog articles.
Further, the phenomenon of high correlations in the calibration period and negligible verification r2 in the verification period is characteristic of many reconstructions – a point that I discussed in many pre-Climategate posts. And while Tingley et al set out some nostrums, these nostrums are ignored in practice.
The reaction to Gergis et al was typical. It did ex post screening. They ran into trouble because they said that they had done detrended screening, but hadn’t. The reaction of Mann, Schmidt and others was that there was nothing wrong with ex post screening and that the journal should allow them to change the description of their method, rather than require them to show that their results lived up to their method. It still remains in a non-retraction retraction. Ironically, PAGES2K used Gergis et al (only microscopically varied) complete with ex post screening.
At the end of the day in London there’s nothing like a summary of the field from Dr McIntyre. Sorry for the honorary title but I feel that soon:
will be read as quaintly anachronistic. Merit will decide.
“nothing wrong with ex post screening”
####
Probably nothing else better demonstrates the faultiness of the methods used by paleoclimatologists.
Taking the rejected data , one plots a curve that refutes the study.
Pekka,
“As examples, the supplement to Mann et al. (2008) describes how only those candidate proxy time series that exhibit a significant correlation (p < .10) with one of the two closest instrumental time series were used in the ensuing reconstruction, .."
p .10?
Science; keep the data that somewhat agrees with the hypotheses, and throw away the data that has bad correlation to the hypothesis.
“p < .10" is significant correlation? It is not just some amount of presumption?
(second line above)
jim z,
That’s exactly the point of my second excerpt from the paper. The issue has been recognized, but there are certainly indications that it has not been given as much weight as it reserves in the practical work.
I’m not expert enough to confirm, whether the situation is as bad as Steve states inside my above comment or a little better, but it seems clear to me as well that there is a real problem. Digging even a little in the methods reveals questions that should have been addressed explicitly in publications before results are presented as even remotely reliable, but have evidently not been addressed that well.
In the case of the PaiCo reconstruction I can list at least three issues specific to it. Two first have been discussed several times here, the third not as far as have seen.
1) The weighting of the proxies in the composite seems to be rather arbitrary and far from the optimal. (It may be optimal in a very restricted sense related to apparent statistical power.)
2) The nonlinearity in the relationship between the original proxy values and the contribution each proxy makes in the final results is controlled by factors that have probably nothing to do with the real relationship between temperatures and the proxy values.
3) Several proxy series exhibit a significantly different relationship between the proxy values and the interpretation in the first half of the period than in the second half. (A sudden change occurred around AD 850 in one proxy, I haven’t checked the actual date of change in others.)
I was somewhat uncertain on the third point thinking that it might come from my own processing, but the high level of agreement (almost, but not totally perfect for the 30y averages) seems to confirm that the issue is real in the method.
It’s really unsatisfactory that the PAGES2K scientists are resorting to a new so badly understood method as much as they do.
This is a tradition in the field starting with Mann et al 1998, of which the linear algebra remains undiscussed in academic literature. You can only find such discussion in some CA posts. The RegEM method of Mann et al 2008 ( in either TTLS or ridge variations) is poorly understood as well. Again its linear algebra is undiscussed in academic literature. Its interpretation is further marred by Mann’s splicing of instrumental and proxy data in the reconstructions.
In addition to paico, PAGES2K presented two other recent and poorly understood methods supposedly yielding similar results.
Any introduced method should show the weights resulting from the method, but this is never done.
But something that I try to say over and over: if there is a common “signal” in the data with low and even medium=order red noise, you can recover the signal using almost any method, taking care only to ensure that your method doesn’t flip series over ( a problem that increases with more principal components. factors).
The problems arise with inconsistency in the data, as then different weightings yield different results.
– one that diverts attention from simpler
Citing only Yule and McShane and Wyner seems odd. There is a truly enormous literature on this in econometrics, including the famous Granger and Newbold and Phillips papers which Steve has often cited.
mikep,
The issue is common to really many fields of statistical analysis, and is surely emphasized in every good textbook of statistical analysis (if not, then the book is not good 😉 ).
Pekka P, thanks for the link to the Tingley paper. On my first quick read I came away with somewhat the same view as SteveM. I would like to see more details on using a Bayesian approach in analyzing these proxy data used for temperature reconstructions.
I have wondered as a raw beginner in using Bayesian analysis whether hierarchical modeling would be a valuable tool in modeling proxy and instrumental temperature data. I am familiar with the limitations that are presented by the classical frequentist approach in selecting proxies using ex post fact methods – as opposed to using an a prior criteria based on some reasonable physical understanding of the proxy response to temperature and other climate variables – but am not at all sure about how Bayesian analysis could better handle this problem. The frequentist approach to this problem of selecting valid temperature proxies that is used, directly or indirectly, by most to all those publishing temperature reconstructions is fraught with basic errors in assuming that a temperature signal can be found in these proxies and all that is needed is some (blackbox) method along with some rather subjective selection of proxies to reveal it. The authors of this paper speak to some of the limitations of the current approaches to making temperature reconstructions, but I did not see on my first scanning of the paper any direct language that would confirm the basic errors I see.
I would suppose that the Bayesians would say that assumptions are made in any modeling and that their approach admits to it by using a prior. The authors in this paper offer an interesting discussion of choosing priors for the Bayesian analysis. I do not know whether the statement below that was excerpted from that paper offers hope for insights into these matters, but an actual analysis would be most interesting to see.
“In situations where scientific expertise may be equivocal, the Bayesian approach allows for multiple analyses based on different priors; the agreement or differences in results based on these different priors may be of scientific interest in their own right. In many cases, however, the parameters may be hard to interpret or there may be a paucity of reasonable scientific knowledge that can inform prior selection for them.”
Kenneth, I strongly disagree with the following distinction.
You say:
There’s nothing “classical frequentist” about ex post screening. Such methodology can be equally criticized by frequentists and Bayesians.
Nor is Bayesianism any sort of magic fix for data analysis. Tingley and Huybers, for example, included upside-down and contaminated Tiljander sediments in their Bayesian analysis.
Again, at the end of the day, all that is happening in these reconstructions is little more than the selection of a vector of weights. More complicated methods will huff and puff longer, but they still only result in a vector of weights.
And the more time is spent on complicated and poorly understood methods, the less attention is placed on the data itself.
My point here is that those authors with whom I am most familiar and make these basic errors in temperature reconstructions were not using a Bayesian approach.
I was not acquainted with the Tingley and Huybers Bayesian based reconstruction/analysis. I am sure that a Bayesian approach could be as readily flawed as a frequentist one. I am interested in learning whether some of the Bayesian tools could uniquely offer some insights into the analysis of the proxy data. A sensitivity test using various priors might be enlightening.
again, at the end of the day, all one is doing is assigning weights to the various proxies. The problem arises from inconsistent data, not from methods that are insufficiently complicated.
Another way in which the real debate is understandable – or should be – to the man on the Clapham Omnibus. So much faux-statistical window dressing but the host here never lets us lose that basic grounding in reality.
SteveM, I was hoping to get some replies on whether or not a proper Bayesian analysis of proxy models for reconstructions could add something to these discussions of the validity of proxies as thermometers. I was hoping that perhaps another approach could be more convincing to those who continue to insist that ex post fact selection of proxies without independent physical evidence that a temperature signal can consistently and over time be extracted from these proxies is a valid approach. It bothered me that I did not see the Tingley authors make a direct statement about, or even allude to, this basic problem.
I think the authors Tingley and Huybers might have some insights on the use of a Bayesian analysis in these matters even when they do appear naive and wrongheaded in the selection of proxies. I found the linked thread below at CA where it appears that these authors did not compensate varve thicknesses for compaction. Like others doing these reconstructions one has to wonder what motivates them to jump unto a proxy or proxy version that gives the sought after answer without doing a thorough investigation.
Reblogged this on I Didn't Ask To Be a Blog.
The 5th Anniversary of the first Climategate release of emails is fast approaching.
This would be the optimal time for any post(s) reviewing the content and significance of the Climategate files, 5 years on….
Yes, we’ve had a bit of a heated anticipation of the anniversary starting with Steve quoting from one of Kaufman’s CG emails on the first of the month.
4 Trackbacks
[…] https://climateaudit.org/2014/10/28/warmest-since-uh-the-medieval-warm-period/#more-20182 […]
[…] For those interested in the history of this particular set of discussion I direct you now to: Revisions to Pages2K Arctic / Okshola: which way is up? / PAGES2K: More Upside Down? and PAGES2K vs the Hanhijarvi Reconstruction and which a the time of completing this article spans now to Warmest, uh, Since the Medieval Warm Period. […]
[…] to the PAGES2K graph from the Climate Audit post […]
[…] « Warmest since, uh, the Medieval Warm Period […]