Only two Gergis proxies (both tree ring) go back to the medieval period: Oroko Swamp, New Zealand and Mt Read, Tasmania, both from Ed Cook. Although claims of novelty have been made for the Gergis reconstruction, neither of these proxies is “new”, with both illustrated in AR4 and Mt Read being used as early as Mann et al 1998 and Jones et al 1998.
In today’s post, I’ll look in more detail at the Oroko tree ring chronology, which was used in three technical articles by Ed Cook (Cook et al 2002 Glob Plan Chg; Cook et al 2002 GRL; Cook et al 2006) to produce temperature reconstructions. In Cook’s earliest article (2002 Glob Plan Chg), Cook showed a tree ring chronology which declined quite dramatically after 1957. Cook reported that there was a very high correlation to instrumental summer temperature (Hokitika, South Island NZ) between 1860 and 1957, followed by a “collapse” in correlation after 1957 – a decline attributed by Cook to logging at the site. For his reconstruction of summer temperature, Cook “accordingly” replaced the proxy estimate with instrumental temperature after 1957, an artifice clearly marked in Cook’s original articles, but not necessarily in downstream multiproxy uses.
Gergis et al 2012 (which corresponds to PAGES2K up to a puzzling one year offset) said that they used “disturbance-corrected” data for Oroko:
“for consistency with published results, we use the final temperature reconstructions provided by the original authors that includes disturbance-corrected data for the 213 Silver Pine record…( E. Cook, personal communication)
By “disturbance correction” , do they mean the replacement of proxy data after 1957 by instrumental data? Or have they employed some other method of “disturbance correction”?
Assessment of this question is unduly complicated because Cook never archived Oroko measurement data or, for that matter, any of the chronology versions or reconstructions appearing in the technical articles. Grey versions of the temperature reconstruction (but not chronology) have circulated in connection with multiproxy literature (including Mann and Jones 2003, Mann et al 2008, Gergis et al 2012 and PAGES2K 2013). In addition, two different grey versions occur digitally in Climategate letters from 2000 and 2005, with the later version clearly labeled as containing a splice of proxy and instrumental data. The Gergis version is clearly related to the earlier grey versions, but, at present, I am unable to determine whether the “disturbance correction” included an instrumental splice or not.
There’s another curiosity. As noted above, Cook originally claimed a high correlation to instrumental temperature up to at least 1957, and, based, on their figures, the correlation to 1999 would still have been positive, even if attenuated, but Mann and Jones 2003 reported a negative correlation (-0.25) to instrumental temperature. However, Gergis et al 2012 obtained opposite results, once again asserting a statistically significant positive correlation to temperature. To the extent that there had been splicing of instrumental data into the Gergis version, one feels that claims of statistical significance ought to be qualified. Nonetheless, the negative correlation claimed in Mann and Jones 2003 is puzzling: how did they obtain an opposite sign to Cook’s original study?
As to the Oroko proxy itself, it does not have anything like a HS-shape. It has considerable centennial variability. Its late 20th century values are somewhat elevated (smoothed 1 sigma basis 1200-1965), but nothing like the Gergis 4-sigma anomaly. It has no marked LIA or MWP. It has elevated values in the 13th century, but it has low values in the 11th century, the main rival to the late 20th century, and these low 11th century values attenuate reconstructions where 11th and 20th century values are close. The HS-ness of the Gergis2K reconstruction does not derive from this series.
The Oroko Swamp site is on the west (windward) coast of South Island, New Zealand at 43S at low altitude (110 m). In December 2012, during family travel to New Zealand South Island, we visited a (scenic) fjord on the west coast near Manapouri (about 45S). These are areas of constant wind and very high precipitation. They are definitely nowhere near altitude or latitude treelines. Cook himself expressed surprise that a low-altitude chronology would be correlated to temperature, but was convinced by the relationship (see below).
In today’s post, I’ll parse the various versions far more closely than will interest most (any reasonable) readers. I got caught up trying to figure out the data and want to document the versions while it’s still fresh in my mind.
The Gergis2K Reconstruction and Oroko
First, for orientation, in Figure 1 below, I’ve compared the PAGES2K Australasian (“Gergis2K”) reconstruction with the PAGES2K Oroko chronology (expressed as a temperature reconstruction as in the PAGES2K archive). CA readers will recall that, for the calculation of the regional average, the Gergis2K reconstruction is converted to smoothed SD units, and, in those units, its blade closes at a monster 4-sigma. In contrast, the Oroko reconstruction has considerably more centennial variability and does not close at monster values.
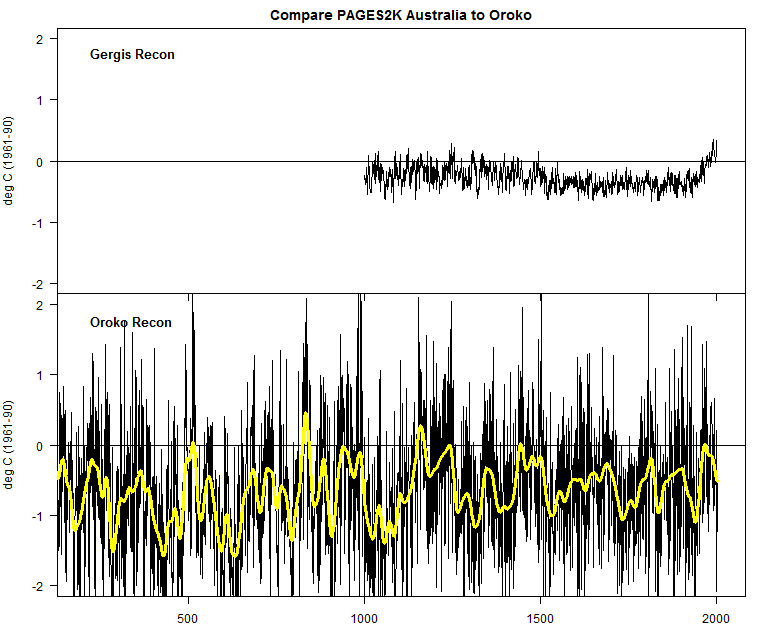
Figure 1. Top panel – PAGES2K Australia reconstruction (in deg C.) Bottom panel – PAGES2K Oroko temperature reconstruction (converted to deg C basis 1961-1990) supplemented by Neukom et al 2014 data. The Neukom data was used to extend the PAGES2K version at both ends.
Cook et al 2002 Glob Plan Chg
This is the earlier in genesis of the two 2002 articles. In Cook’s Oroko articles, he typically shows the chronology in one figure and the temperature reconstruction in another figure. In the Glob Plan Chg article, Cook showed an STD chronology (trees individually standardized) based on a smaller network, while the 2002 GRL article reported a RCS chronology (one standardization curve) on an expanded network. (STD chronologies have less centennial variability than RCS chronologies – which can have other defects – as interannual variance is incorporated into inter-tree variance.)
The chronology illustrated in their Figure 3 (excerpted below in my Figure 2) shows a noticeable decline in the late 20th century – shown more clearly in the zoom in the right panel. Cook surmised that there had been logging at the site around 1957 (the 1957 breakpoint is marked in red) and attributed the subsequent decline to the effects of this logging. Much of the article is devoted to discussion of circumstantial evidence of the logging. Although Cook said that there was “no evidence of cut stumps along the transect line”, they reported that there were “remains of a small-gauge tramline in part of the swamp that was used to log selected L. colensoi during the 20th Century”, deducing the disturbance primarily by analyzing year of death of many trees.

Figure 2. From Cook et al 2003 (Glob Plan Chg) Figure 3, showing Oroko chronology in chronology units.
For the period 1894-1957, Cook reported high correlations of the chronology to summer temperature, selecting (from several alternatives) a correlation of 0.61 with Jan-March temperature as a basis for reconstruction of JFM temperature.
In the resulting temperature reconstruction (shown in their Figure 6 – see below), Cook replaced proxy data after 1957 with temperature data. This was clearly stated in the caption and additionally illustrated in a separate panel B (not shown here) limited to the instrumental period.

Figure 3. Temperature reconstruction of Cook et al 2002 (Glob Plan Chg) as shown in their Fig. 6. Original caption: Reconstruction of January–March temperatures from Oroko Swamp L. colensoi tree rings (A). The calibration is based on joint 1866–1957 tree-ring and temperature data only (B) because of the post-1957 disturbance in the tree rings. The actual temperatures, scaled to the same amplitude as the tree-ring estimates, have been appended to the tree-ring estimates to allow for an evaluation of temperatures up to 1999.
Cook et al 2002 (GRL)
The nearly contemporary Cook et al 2002 (GRL) showed an RCS chronology on an expanded dataset (increased from 145 to 260 ringwidth series) in its Figure 1 (excerpted below). It was mentioned in a 2000 Climategate email (CG2-3759) from Cook to Briffa, which included a digital version that is closely related to (but not identical) to the illustration. (It is overplotted on the right panel shown below.)
As in the earlier article, the chronology shows a post-1957 decline, though the decline in this version is attenuated from the STD chronology published earlier in the year: the difference appears larger than I would expect merely from the difference in methods. This version shows elevated values in the late 12th and early 13th centuries, but has very low values in the early 11th century, which is a very warm period in most NH reconstructions.

Figure 4. From Cook et al 2002 (GRL) Figure 1. Original caption: The Oroko Swamp Austral summer temperature reconstruction, with overlaid 40-year smoothing (thick red line). Annual error estimates in blue (±1 standard error of the estimate from regression) are also included (yellow). After 1957, the actual Hokitika data have been appended to the reconstruction (dark blue line) to allow the full 20th century to be compared to the previous 1,000 years. The thin black horizontal line is the 20th century mean of Hokitika instrumental temperatures. The three vertical arrows mark the years of Alpine fault earthquakes (1460, 1630, and 1717). Yellow in right panel – overprint of digital information in Climategate CG2-3759.
Cook observed high correlations between this chronology and Jan-March temperature at Hokitika (which is also one of seven stations in the NIWA seven-station composite recently in blog news). The correlation was 0.62 in 1894-1957. Cook observed that the reconstruction verified (according to usual dendro methods) according to high verification r (and r2), RE and CE values in a 1866-1893 verification period, but that there was a “collapse” in the fidelity of the response in the 1958-1999 period, which he attributed to growth being “severely disturbed by known selective logging of the site”.
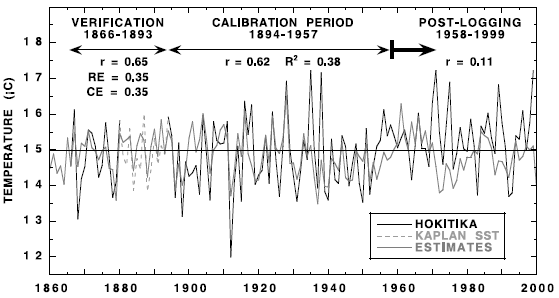
Figure 2. Cook et al 2002 (GRL) figure 2. Original caption: Calibration and verification results. The Oroko Swamp chronology has been calibrated against January- March mean temperatures from Hokitika, yielding a regression R2 of 0.38. The correlation between actual and estimated temperatures in the 1866-1893 verification period indicates that the tree-ring estimates are valid. Tree growth after 1957 was severely disturbed by known selective logging of the site, which resulted in a collapse in the fidelity of the tree-ring response to climate.
For the GRL temperature reconstruction, Cook once again replaced proxy data after 1957 by instrumental data after 1957, though but the smoothed version only went to 1957. Overplotted onto this figure is data from a 2005 Climategate email, sent by Cook to AR4 editors and shown in a figure in AR4 (also later used in Mann et al 2008). Cook explained in the covering email:
JANUARY-MARCH TEMPERATURES RECONSTRUCTED FROM OROKO SWAMP, NEW ZEALAND SILVER PINE TREE RINGS BE ADVISED THAT THE DATA AFTER 1958 ARE INSTRUMENTAL TEMPERATURES
The values appear to closely match Cook et al 2002 GRL values up to 1957, but, curiously, the amplitude in Figure 3 after 1957 (from experiment) is approximately 1.5 times the amplitude in the underlying data.

Figure 4. Cook et al 2002 (GRL) Figure 3 showing temperature reconstruction with splice of instrumental temperature after 1975. Original caption: The Oroko Swamp Austral summer temperature reconstruction, with overlaid 40-year smoothing (thick red line). Annual error estimates in blue (±1 standard error of the estimate from regression) are also included (yellow). After 1957, the actual Hokitika data have been appended to the reconstruction (dark blue line) to allow the full 20th century to be compared to the previous 1,000 years. The thin black horizontal line is the 20th century mean of Hokitika instrumental temperatures. The three vertical arrows mark the years of Alpine fault earthquakes (1460, 1630, and 1717). Yellow/gold – overplotted is the version contained in the 2005 Briffa email (also Mann et al 2008). After 1957, the values shown in the figure have a 50% greater amplitude than figures in the digital file.
Mann and Jones 2003
Mann and Jones 2003 was the first multiproxy series to consider use of the Oroko series, which was listed as one of 5 candidate long reconstructions: Fewer long series are available for the Southern Hemisphere (SH), where we make use of temperature reconstructions from 5 distinct regions….
(3) ‘RCS’-based tree-ring temperature reconstruction [warm-season; Cook et al., 2002] for southern New Zealand back to AD 900.
However, the Oroko series was eliminated from their network because Mann and Jones calculated a negative 0,25 correlation between the Oroko reconstruction and local temperature (see value in the Mann and Jones 2003 location map excerpted below). This was opposite to the value obtained by Cook and subsequently by Gergis. Mann and Jones described their procedure as follows:
Local (decadal) correlations were calculated between each proxy record and the instrumental grid-box surface temperature records for the regions they represent over the period 1901-1980 (see Figure 1). Proxy records exhibiting negative or approximately zero local correlations (SH record #2 and #3) were eliminated from further consideration in the study.
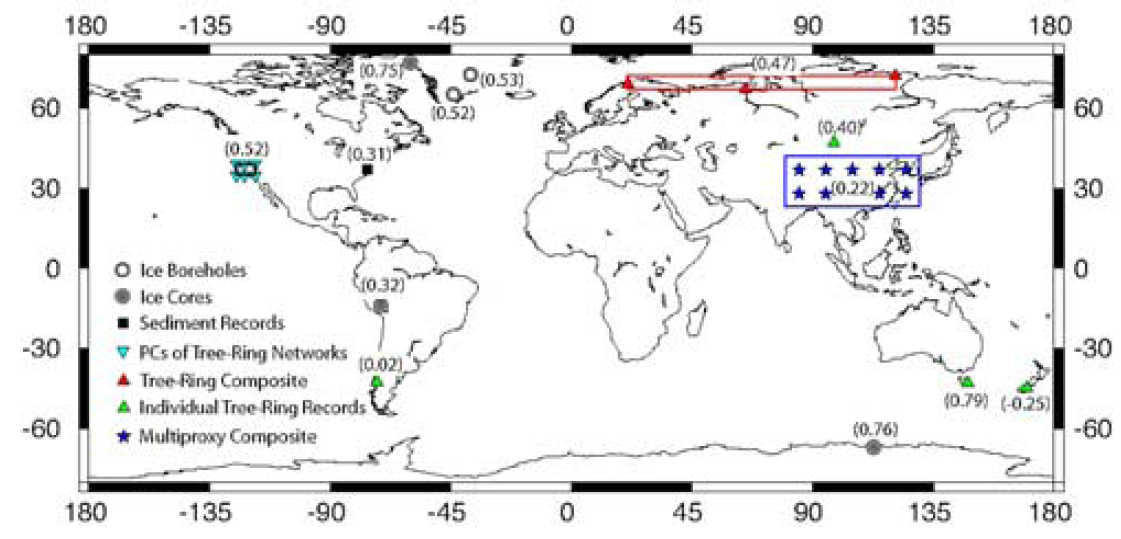
Figure 5. Location map of Mann and Jones 2003. Correlations to instrumental temperature shown in parentheses, with negative correlation -0.25 shown for Oroko, New Zealand. In their text, they stated: “Local (decadal) correlations were calculated between each proxy record and the instrumental grid-box surface temperature records for the regions they represent over the period 1901–1980 (see Figure 1). Proxy records exhibiting negative or approximately zero local correlations (SH record #2 and #3) were eliminated from further consideration in the study.”
Cook et al 2006
Cook et al 2006 (J Quat Sci) also showed an Oroko chronology compared against a ring width chronology from Ahaura, about 100 km away, arguing in favor of a common pattern. Once again, the post-1957 chronology shows a decline. The 2000 RCS chronology version is overplotted (yellow) on right panel, showing that the revised chronology remains close to the 2000 versions.

Figure 6. Excerpt from Cook et al 2006 Figure 7, top panel, showing Oroko chronology, inclusive of post-1957 decline.
As in the earlier articles, the temperature reconstruction of Cook et al 2006 includes spliced instrumental data, shown after 1957 in the diagram below. In this case, values from the 2005 Climategate email (equivalent to Mann et al 2008) are shown in gold prior to 1957; after 1957, the amplitudes are amplified by 1.5 for reasons that are not evident. The values go up, rather than down (as in the chronology shown above.)
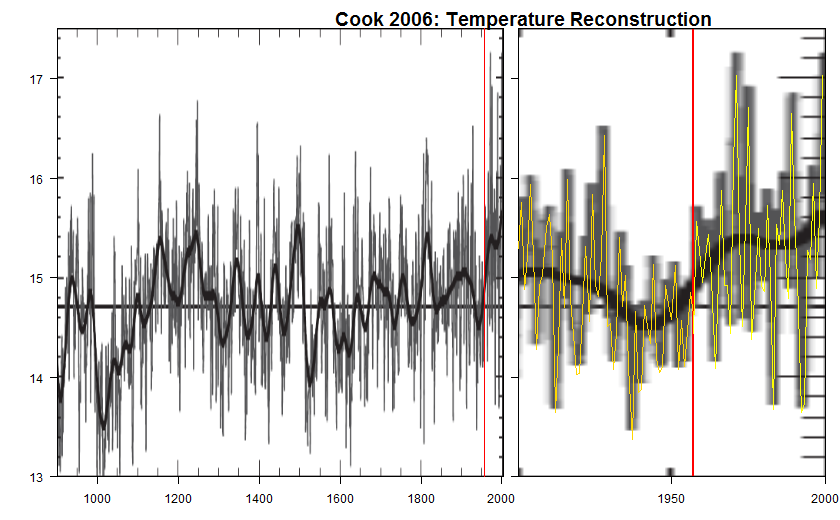 Figure 7. Excerpt from Cook et al 2006 Figure 6, showing Oroko temperature reconstruction of Jan-Mar temperatures. After 1957, instrumental values are splice, additionally being shown in the diagram with increased amplitude.
IPCC AR4
The Oroko version sent to IPCC authors by Cook was subsequently shown in IPCC AR4 Figure 6.12, truncated in 1957 as shown below, with the commentary shown below:
Another tree ring reconstruction, of austral summer temperatures based on data from South Island, New Zealand, spans the past 1.1 kyr and is the longest yet produced for the region (Cook et al., 2002a). Disturbance at the site from which the trees were sampled restricts the calibration of this record to the 70 years up until 1950, but both tree rings and instrumental data indicate that the 20th century was not anomalously warm when compared to several warm periods reconstructed in the last 1 kyr (around the mid-12th and early 13th centuries and around 1500).

Figure 6. Excerpt from IPCC AR4 Figure 6.12 showing two Southern Hemisphere proxies, including Oroko (New Zealand.)
Mann et al 2008
Mann et al 2008 used exactly the same data as Cook had sent to the IPCC authors, including the instrumental data spliced together with proxy data: the data is plotted below. Unlike the original chronologies, the series closes on an uptick.
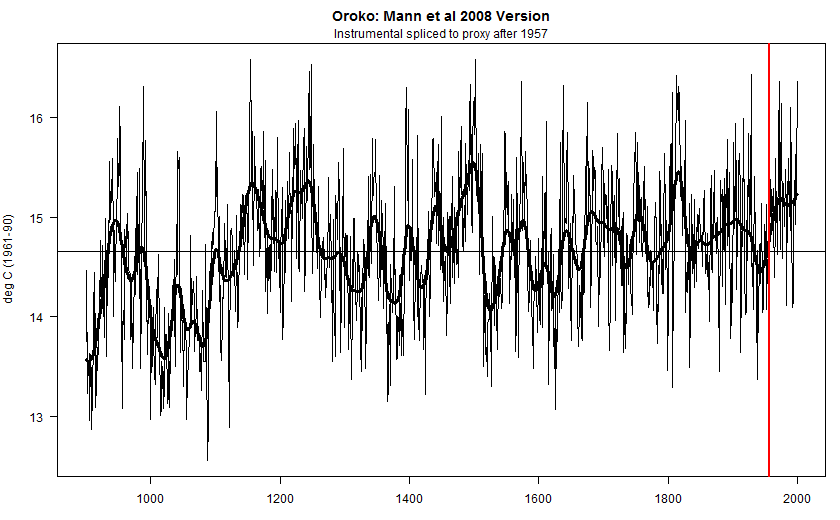
Figure 7. Oroko temperature reconstruction from Mann et al 2008 data: instrumental data is spliced after 1957 to proxy data before 1957.
Neukom and Gergis 2012
Neukom and Gergis 2012 is cited on several occasions in PAGES2K, but no data was archived in connection with this article. Worse, Neukom refused to provide data even on request. Neukom saved a short (1900-2000) portion of the Oroko series (attributed to Cook, pers comm), which matches the Climategate 2005/Mann et al 2008 version up to 1957, but its post-1957 portion doesn’t appear to match either the earlier or later versions.

PAGES2K and Gergis et al 2012
The PAGES2K version of Oroko is a temperature reconstruction, that is highly related to the earlier version, but which has been recalculated somewhere along the way: its subset up to 1957 has a correlation of 0.80 with the earlier version. Both versions have centennial variation and “cold” 11th centuries. Unlike the earlier temperature reconstructions (in which temperature data was spliced) it shows a decline, opening the possibility that it uses “actual” data after 1957, rather than spliced instrumental data: its appearance looks related to the chronology in Cook et al 2006 (as opposed to the spliced instrumental data), seemingly with an upward bodge reminiscent of the “Briffa bodge” of Cook’s friend. Perhaps”disturbance correction” mentioned in Gergis et al 2012.
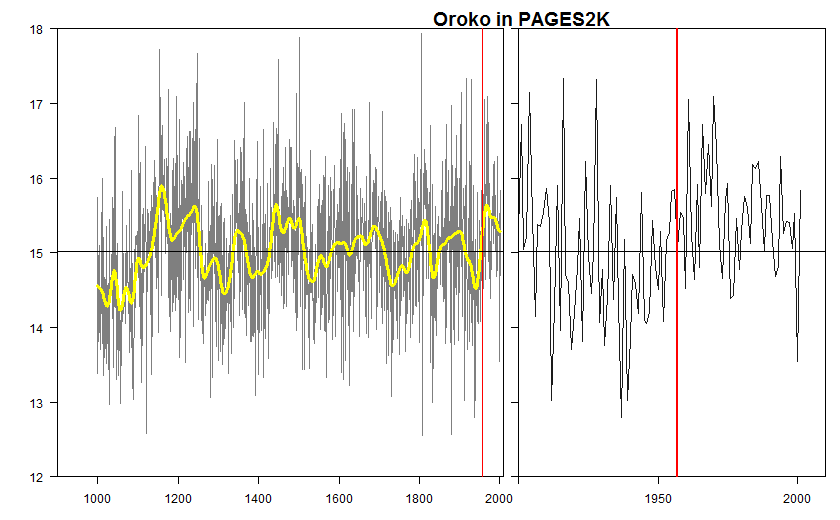
Figure 8 Oroko temperature reconstruction from PAGES2K. Its post-1957 is reminiscent of the chronology in Cook et al 2006, rather than the spliced instrumental data.
Both Gergis et al 2012 and Gergis2K purported to reconstruct summer SONDJF temperature, but there is 0 correlation between the two versions as extracted from the respective archives.
<code>cor(ts.union(gerg,pages),use=use0)[1,2]# 0.000339041</code>
However, if the Gergis 2012 version (normalized) is dated one year earlier, it has an exact correlation to the PAGES2K version (deg C).
<code>cor(ts.union(lag(gerg,lag=1),pages),use=use0)[1,2]# 1 </code>
In other words, the Oroko ring width (reconstructing SONDJF) is assigned to the following NH calendar year in Gergis et al 2012 and to the previous NH calendar year in PAGES2K. The same pattern holds with the AUS regional reconstruction: if the Gergis et al 2012 version is dated one year earlier, it matches the PAGES2K.
To further confuse matters (and I’ve triplechecked this), it appears to me that the Neukom et al 2014 Oroko version (and SH reconstruction) is in effect assigned to the calendar year one year before that i.e. it implies that summer temperatures of the preceding year force ring widths, not temperatures of the current summer.
<code>cor(ts.union(lag(lag(gerg )),neuko),use=use0)[1,2] #1 </code>
The Neukom et al 2014 version also contains a substantial extension of the reconstruction into the first millennium, an extension that is thus far unreported elsewhere, and a couple of additional recent values that continue the decline: the series closes slightly below its long-term average.
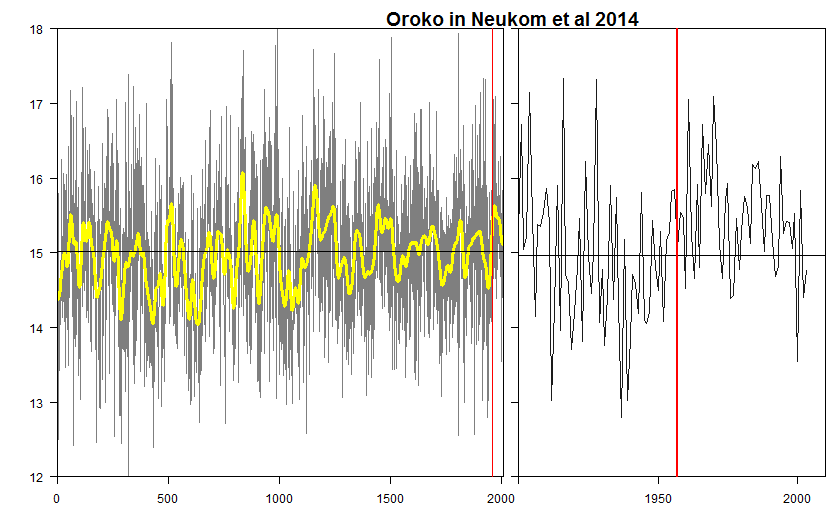
Figure 9. Oroko temperature reconstruction extracted from Neukom et al 2014. The normalized values of N14 are converted to temperature reconstruction by the exact linear relationship between the versions.
Revisiting Temperature Correlations
It’s not entirely certain that the PAGES2K version is an unspliced chronology. In the figure below, I’ve done a comparison of reconstruction to Hokitika summer temperature in the style of the original Cook article, but using the more recent PAGES version and updated Hokitika temperature (using a slightly dated CRU version.) In the updated calculation, I obtained slightly higher 1894-1957 correlation than reported by Cook ( 0.72 versus 0.62) as well as in the 1866-1893 period (0.67 versus 0.65 – though, for this step, I didn’t bother interpolating to missing data.)
In the post-1957, I got a much higher correlation (0.39 versus the previous 0.11). The import of this calculation depends on precisely how the “disturbance correction” was implemented.
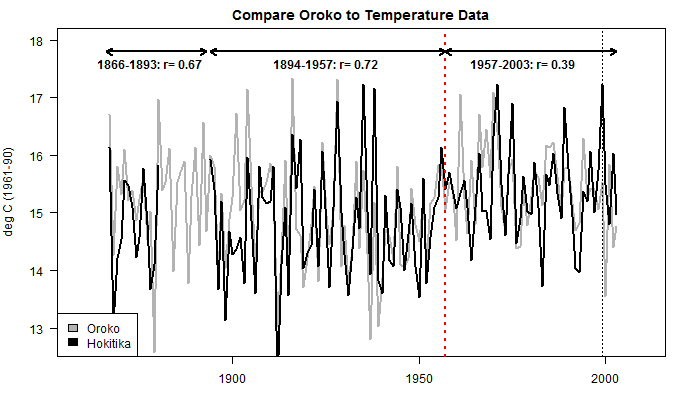
Figure 10. Comparison of reconstruction to Hokitika summer temperature in style of Cook et al 2002 Figure 2, using updated data.
Discussion
What, if anything, does this mean?
First, the continuing failure of IPCC authors to archive measurement data and chronologies as used makes the interpretation of these results far more onerous and uncertain than ought to be acceptable for results later cited in policy documents. PAGES2K used yet another grey version of the Oroko chronology. Because the properties of “disturbance correction” are unknown, it is impossible to assess whether the “statistically significant” relationship to temperature claimed by Gergis et al is impacted by a temperature splice or not.
Second, while Cook clearly marked his own replacement of proxy data with temperature data, it really is an unacceptable practice. The poor practice is exacerbated when spliced data is used downstream without the downstream authors attaching red flags. This happened with the Briffa bodge of the Tornetrask data and happened again with Mann et al 2008’s use of the spliced series.
Third, the negative correlation asserted by Mann and Jones 2003 seems unlikely: one wonders where it came from.
On a previous occasion (here), I noted that Gergis2K only had two proxies that reached back to the medieval period. While late 20th century values are elevated, they are not exceptional and do not explain the 4-sigma blade of the Gergis2K reconstruction. In a subsequent post, I’ll discuss the construction of the Gergis2K blade, which I have not yet parsed. Readers will recall that undetrended screening applied to the Gergis et al 2012 network resulted in only a few passing proxies. Gergis2K claim to have used undetrended screening, but permitted relationships with any gridcell within 500 km and/or with lag/lead of a year. I will try to determine whether their definition of statistical “significance” was amended to reflect this expansion of targets (I doubt it.) As previously noted, the Gergis2K network changed from the Gergis et al 2012 only on the edges: 20 of 27 proxies carried over; a few shuffled out and a few shuffled in.
But while screening undoubtedly plays a role, I think that the main methodological issue will be one that it has been underdiscussed: how to combine short proxies with long proxies. The vast majority of Gergis2K proxies are short corals with strong trends. Stapling such data onto long tree ring data with centennial variability, but negligible trend, will create a HS. This sort of stapling has occurred in previous reconstructions – Jones et al 1998 is an example, but has received less attention than more exotic techniques. At some point, I’ll try to figure out Gergis’ methodology and see the effect of their (presumptive) stapling.


36 Comments
The proxy stapling-on seems reminiscent of Marcott-Shakun proxy-dropout in reverse.
Sooner or later someone will insert a comment about the Hokitika temperature record, so let it start with me, as I live about 25 minutes drive away from that airport.
The station has had several site moves in and around the town of Hokitika (population something like 5000). It is now at the local airport but this has not always been the case. There will also have been changes to the screen and thermometers. About 5 or 6 years ago there was a major clearance of encroaching vegetation that was starting to surround the meteorological enclosure.
There are several versions of the mean temperature record, which is one of the longest in NZ. The temperature trend you get depends on how one splices the sections: with corrections or without corrections.
The R2 you get with a tree ring correlation will depend somewhat on which spliced temperature record you use as the target.
There is so much detail to chase. Thank you, Steve.
You started with Mt Read and Huon Pine tree rings by Ed Cook.
His early papers include
Click to access 1996-Cook-Huon_pine.pdf
This uses instrumental temperatures from different climate zones in Tasmania, since there are no long records close to site. He calibrated on Launceston and Low Head that are some 130 km to the NE and Hobart, even more distant and not on mountain wetlands, but on dry/wet seasonal lowlands probably with rather different rainfalls.
The paper gives a graph showing a temperature increase from 1950 to 2000 of 14.4 to 15.6 deg C, a warming of 1.2 deg. on his smoothed curve. There are reconstructions for all of Tasmania such as by Ken Stewart that show warming closer to 0.6 deg C. from CRUTEM4.
(As an aside, the official record has at least 7 stations for Launceston that need to be cobbled together to duplicate the time span. In such homogenising, there is ample room for trends to increase, plausibly wrongly, as by the Acorn-Sat method used by BOM).
Cook ends up with a hockey stick shape in his figure 1 for Mt Read back to year -2750.
The hockey stick results in part from his choice of recent warming being 2X reasonable. If the temperature for calibration is unreasonable, of course it affects the whole response and renders is most questionable.
Cook went on to publish more papers, but if you are chasing hockey sticks, this paper has a nice one.
There is so much that is questionable with Pages 2K that I am embarrassed by Australian climate ‘science’.
Correction to my post of 4.58 am. Please replace the chosen temperature range ‘1950 to 2000’ with ‘1950 to 1989’ or ‘1950 to 1990’. The end date is not clear.
Three Rings for the Elven-kings under the sky, Seven for the Dwarf-lords in their halls of stone, Nine for Mortal Men doomed to die, One for the Dark Lord on his dark throne In the Land of Mordor where the Shadows lie.
One Ring(or Staple) to rule them all
Delete I won’t care
“Third, the negative correlation asserted by Mann and Jones 2003 seems unlikely: one wonders where it came from.”
The correlation being calculated on decadal values, a negative value does not seem impossible at first sight. Such a selection on the basis of low frequencies is problematic because low frequency of instrumental data are much less reliable than high frequencies.
snip
too much complaining
Ok, so maybe I complained a bit. But you don’t think Ed’s own words are relevant here?
Pages2k proxies Aus 4, 5 and 9 could each be a HS. Ascertained by my corporeal visually scaling-eyeballing sensor. (Not double-checked)
I think if I was a tree that witnessed the 1957 Oroko Swamp chainsaw massacre, I’d be disturbed too.
So now we have disturbance and divergence as excuses for the decline.
The odd thing is that normally you would expect the remaining trees to grow faster (=”warmer”) after logging. That is certainly what happens to northern-hemisphere conifers. In Swedish forestry young forests are routinely thinned (“gallrade”) to increase productivity. The young trees cut down are used for pulp or firewood while the remaining are left to grow until large enough to cut down for lumber.
And indeed it seems to me that this is what you can actually se in the tree-ring record. The “decline” only sets in from c. 1975 and is quite possibly not related to the logging at all.
Very iffy using data from trees in an area that has been logged. To his credit, Cook
in the 2002 paper talks about this in his disturbance report, indicating that logging
likely opened up the forest to possibel wind blow-down, and possibly the change in
drainage from the installation of roads and a tram-line in the area. This was my
thoughts before reading the article, having grown-up in a logging town in N. Calif.
I just think you say adios to any tree ring data from Oroko Swamp from mid
1950s onwards.
“To his credit, Cook in the 2002 paper talks about this in his disturbance report, indicating that logging
likely opened up the forest to possibel wind blow-down, and possibly the change in
drainage from the installation of roads and a tram-line in the area.”
EdeF, I have a problem with Cook making this judgment after the fact of “looking” at the data and then attempting to explain away the divergence. In the bigger picture divergence is not a site specific problem nor strictly related to logging. Anybody like Cook who then decides truncate and to tack on the instrumental record is surely more motivated by advocacy than science.
Perhaps the changes to the tree site from logging – if indeed that activity can be shown in detail to have effects beyond mere hand waving about it – would be an opportunity for learning more about the sensitivity of tree ring response to climate variables other than temperature. That would be a real science adventure.
Steve: from a data analysis perspective, I can see how Cook would be interested in explaining the divergence ex post. I have no more difficulty with that than someone explaining the Igaliku or Korttajarvi sediments as due to agricultural activity. There does seem to be an element of arm waving of Cook;s attribution of the decline to loggiing without clearly showing a connection. The larger frustration is surely due to the acuteness of COok and others to noticing divergence problems when they go down, but their blindness to upward divergence problems e.g.Gaspe, bristlecones, Igaliku, Korttajarvi. And whether one can draw any conclusions from such troubled data remains very much in question for me (as with you,)
Steve, if one goes the route of there being a temperature signal buried somewhere in the proxy response data – and without independent evidence – then it would behoove one to include all the data whether it ends in a upward , downward or no trend. A very noisy signal would exhibit such trends and by excluding the ones that do not fit the current warming trend is going bias the end result. Of course, one can exclude outliers if there is good independent evidence for doing so.
The varve and sediment proxies I have plotted whether they go up or down at the end do not pass the smell test in my judgment. The rather non descript and unvarying series leading up to a sudden 4 to 6 sigma trend (upward or downward depending on inclination) would eliminate its use before anyone had to decide (or use a method to decide) how it should be orientated.
Cook’s actual evidence of anthropogenic disturbances accounting for the divergence is not particularly compelling. He notes (Cook, 2002, at p. 212):
“The cluster [of tree mortality] occurs in the 20th Century and has a median mortality date of 1956. We interpret this clustering to be related to the logging activity known to have occurred around that time. Although there was no evidence of cut stumps along the transect line, the cutting nearby would have opened up the forest and perhaps made it more susceptible to wind-throw. L. colensoi is also known to form root grafts between individuals, producing an interlinked network (Moar, 1955). Alternatively, the hydrology of the swamp may have been altered when drains associated with road construction and light rail access for milling were put into the area.”
So, he throws out 2 possibilities: logging and changes in hydrology. On the former, there is no evidence of direct logging in the area that experienced the mortality event. He speculates that “cutting nearby” increased wind throw (which one would assume would be detectable) or that there is a shared rooting system that was somehow affected (again, no investigation). He also suggests that maybe hydrology changes had an impact.
Two things jump out:
1. There’s no hard evidence to support his claims that the mortality cluster results from anthropogenic disturbance. Cook acknowledges that he is being speculative (“the exact mechanism that led to widespread mortality is presently unknown” (Ibid.));
2. There is no explanation of how the mortality event actually led to a loss of correlation with temperature.
On p. 215 he states:
“This catastrophic loss of climate correlation in the surviving trees confirms that a stand-level disturbance occurred. It is likely that the cause is the known logging activity described earlier. However, the exact effects of this disturbance on the surviving trees are unknown.”
As with so many dendro reconstructions, it leaves one wondering whether the correlation that has been “discovered” for a certain calibration period is just accidental. Absent a clear identification of the cause of the 1950s mortality event and a connection between that cause and the subsequent “catastrophic loss of climate correlation”, it makes it challenging to accept the argument that the “treemometers” involved correlated well with temperatures over the last thousand years. Indeed, it appears there also was something of widespread mortality in the mid-19th C. as well (if I’m reading figure 2 correctly). So he also needs to explain why one mortality event has an impact (1950s or thereabouts – though the cut-off date is a median of 20th tree mortality: why is the impact only felt after 1956?) while the other does not.
More significantly, perhaps, the fact that Cook was merely speculating that logging was the cause of the divergence is lost in subsequent treatments: it becomes “fact” without further investigation. So, in his follow-on 2002 paper, “Evidence for a ‘Medieval Warm Period’ in a 1,100 year tree-ring reconstruction of past austral summer temperatures in New Zealand” published in GRL Volume 29, Issue 14, pages 121-24, July 2002, Cook now authoritatively states:
“As before [Cook et al., 2002], the post-1957 tree-ring data were severely affected by known logging of the stand and, therefore, not used for either calibration or verification. […]
Tree growth after 1957 was severely disturbed by known selective logging of the site, which resulted in a collapse in the fidelity of the tree-ring response to climate.”
So, the speculation from the earlier paper now becomes entrenched as “fact”. Needless to say, although Cook’s original assessment was heavily qualified, and contained no confirmed explanation for either the mortality event or how that event linked to loss of “fidelity” to climate, it now becomes part of the rote for subsequent researchers, who use this speculation uncritically. Gergis 2012 picks it up in her failed paper:
“The only exceptions to this signal-free tree ring detrending method was the New Zealand Silver Pine tree ring composite (Oroko Swamp and Ahaura), which contains logging disturbance after 1957” [at p. 8/53 of the pre-publication release]
Cook speculates in his seminal Oroko Swamp paper regarding the cause of 20th C. tree mortality in the Oroko Swamp, and as to the link between that mortality and the post-1956 lack of temperature fidelity (although half the trees involved in the “event” had already died by that point). This speculation becomes “fact” in his subsequent paper looking at a possible MWP in New Zealand, and is accepted uncritically by Gergis in her (failed) 2012 paper.
“This speculation becomes “fact” in his subsequent paper looking at a possible MWP in New Zealand, and is accepted uncritically by Gergis in her (failed) 2012 paper.”
This process is not uncommon in the climate science literature with which I am familiar. I would like to call it hand waving with references. I think it might have something to do with the fact that for whatever reasons there is a dearth of skeptical papers coming out of this community and that clears the unimpeded path for one authors conjecture to become another’s factual.
I recall Mann, in a paper about North Atlantic hurricane and tropical storm frequency, stubbornly maintaining that these weather events occurring at sea going back in history were not missed because ships at sea had no radar or other modern detection methods to avoid these events and thus the ships would unknowingly sail into or near the paths of these events and (providing they survived I guess) would report the event. Some of us on reading this conjecture thought it is was more or less a joke and dubbed it the dumb ships conjecture. Lo and behold not months after Mann’s work was published did I see another paper referencing this conjecture from Mann’s paper as if it were considered a reasonable theory. I should have added above that part of the cause of these conjectures to fact without any additional evidence provided is the advocacy issue in climate science.
“So, the speculation from the earlier paper now becomes entrenched as “fact”.”
This is disturbingly common even outside of climate science and is one of my pet peeves as a reviewer. It makes it much easier to write papers if you don’t have to include all the nagging details from the original citation.
Am I correct in reading that Mann (in Mann and Jones 2003) first rejected Oroko (with the “disturbance”) from his recon, but later used it in the 2008 recon (with “disturbance” replaced by instrumental record)?
That reminds me of my field, where a lab will publish a remarkable finding, but all subsequent papers from the same lab will ignore it without comment and often publish a subsequent opposite conclusion.
Steve: it sa rejected in 2003, but I don’t know whether they had a version with the “distrubance”. The grey version in the archive ends in 1957. And yes, they did use the rejected data with temperature splice in 2008.
And for me, which is why I posted the quote from his CRU email. I don’t understand why you don’t feel it’s relevant. I know I’m not even a bit player in this, I’m just some guy. But it seems REALLY important when, as you’ve pointed out about Mann, Jones, Briffa, etc, how their “private” conclusions don’t match their scientific ones.
Steve; then lay off the superfluous editorializing.
Understood
Proxy data has a reason for being. At least there is an argument that trees on the tree line at high altitude might be temperature sensitive but where is the justification for trees in a swamp? “They seem to correlate” really doesn’t cut it.
Just another look at the last 1,000 years using NOAA data to reconstruct the PDO.
http://en.wikipedia.org/wiki/Pacific_decadal_oscillation#mediaviewer/File:PDO1000yr.svg
Another new study has ound that the MedWP had more La ninas and the LIA had more el ninos, backing up this finding.
If this is correct the USA west coast must have had severe droughts for hundreds of years from 1000 AD and then a much wetter period during part of the LIA. Australia east coast would have had a super wet Med WP and much middle LIA.
Actually if ”disturbance” nullifies the reliability of treerings as a temperature proxies, I don’t see how they can be used at all anywhere at any time. No forest is ever “undisturbed” for very long, even if no humans are around.
There are storms that fell trees, fires, unseasonal frosts, insect infestations, fungal diseases or even a beaver family that builds a dam half a mile away and waterlogs the whole area, or there might be more deer grazing (which prevents young saplings from surviving) or more boars “cultivating” the forest floor (which has the opposite effect).
The “hook” on Cook GRL 2002 was that it showed a MWP in the SH. The peaks shown in Fig. 7 above at around 1150 and 1250 were interpreted as evidence of the MWP, although as Steve points out it was quite cold at the beginning of the NH MWP. The Climategate e-mails describe Cook’s frustration with Mann’s attempts to “get rid of the MWP” by claiming that it was NH and not global, and I think the GRL 2002 paper is some pushback. I guess that was a battle for the last decade, now the Pages2K version shows the temperatures around 1150 as higher than any other period. Either the Hockey Team is asleep at the switch, or the consensus has finally conceded a global MWP.
Steve: while COok was frustrated with Mann, I am unaware of any criticism from Cook of Mann’s efforts to “get rid of the MWP”. Nor do I regard Cooks 2002 paper as a “pushback” against Mann. The idea is ludicrous. It’s nothing of the sort. Cook was writing about a site where he had done a considerable amount of field work.
Steve wrote:
“I am unaware of any criticism from Cook of Mann’s efforts to “get rid of the MWP”
Perhaps since you are unaware, you should refrain from insults. The actual “get rid…” quote came in another context from Bradley I think, but it is a perfectly accurate description of what Mann was doing at the time. In May 2001, Cook and Mann were deep in a dispute about the Esper reconstruction, which poked at MBH a bit. The main topic of dispute was that the Esper reconstruction had a “canonical” MWP, while MBH was flat. Seven months later in December 2001, Cook submitted what was to become his 2002 GRL paper emphasizing the MWP in the SH. Meanwhile, the conflict with Mann over the MWP raged on. In April 2002, Cook responded to Mann’s published criticism of Esper et al, stating:
“I must admit to being really irritated over the criticism of the ECS [Esper et al.] tree-ring data standardized using the RCS method. First of all, ECS acknowledged up front the declining available data prior to 1200 and its possible effect on interpreting an MWP in the mean record.
In any case, the replication in the MWP of the ECS chronology is at least as good as in other published tree-ring estimates of large-scale temperatures (e.g., NH extra-tropical) covering the past 1000+ years. It also includes more long tree-ring records from the NH temperate latitudes than ever before. So to state that “this is a perilous basis for an estimate of temperature on such a large geographic scale” is disingenuous, especially when it is unclear how many millennia-long series are contributing the majority of the temperature information in the Mann/Bradley/Hughes (MBH) reconstruction prior to AD 1400.”
So while my comment about pushback was speculative, it was far from ludicrous.
Matt, in many cases, you are presuming that Cook’s interpretations accord with your own and, in my opinion, that is manifestly not the case.
YOu wrote:
When I say that I am unaware of such criticisms, it is a statement based on familiarity with the underlying documents that, I venture to say, is at least as thorough as your own and perhaps more thorough. Your misattribution of the “get rid of” quote is an example. This does not come from Bradley, but from David Deming’s recollection of an email to him from someone the identity of whom is not known. I don’t disagree that this “accurately” describes for you or me what Mann was doing, but I do not agree that this is how Cook or someone like him would characterize the incidents.
Nor was Cook the strong proponent of the MWP as you claim. In one of the letters that you quote, Cook says:
Cook was at odds with Mann on a variety of points, but not because Cook himself was strongly committed to a Lambian MWP – you are projecting your own views onto him.
I blew the Deming quote but it was not the topic.
“When I say that I am unaware of such criticisms, it is a statement based on familiarity with the underlying documents…”
In a letter to Tom Crowley on 2 May 2001, but intended for “[Tom], Mike, and others,” discussing Mann’s earlier assessments of the evidence for the MWP, Ed Cook wrote:
“I do find the dismissal of the Medieval Warm Period as a meaningful global event to be grossly premature and probably wrong.”
If you won’t admit that that is “criticism from Cook of Mann’s effort to “get rid of the MWP” then you are just racehorsing me.
“…not because Cook himself was strongly committed to a Lambian MWP – you are projecting your own views onto him.”
That is just nonsense and needlessly inflammatory. In the same mail as quoted above, Cook wrote:
“So, at this stage I would argue that the Medieval Warm Period was probably a global extra-tropical event, at the very least, with warmth that was persistent and probably comparable to much of what we have experienced in the 20th century.”
How does that differ from a “Lambian MWP?”
Steve: Fair enough. I may have been too quick. I will re-read the letters in question.
Steve,
The MWP is pretty much the only topic I researched through the CG letters, so I do acknowledge (FWIW) your far more detailed understanding of the underlying issues.
In the same letter as quoted above, 0988831541 in the grepper, Cook wrote “[The MWP] is even showing up strongly now in long SH tree-ring series.” With Cook 2002 GRL seven months from submittal when the mail was written, he must have been working on a draft at the time, so the reference to “long SH tree-ring series” most likely refers to his Oroko Swamp data. As you attested in the post, the MWP in the Oroko Swamp data is anything but canonical with its cold 11th century, so it struck me as odd that the GRL paper highlighted the MWP. My speculation in my first comment just came down to wondering whether Cook chose the title “Evidence for a ‘Medieval Warm Period’ in a 1,100 year tree-ring reconstruction of past austral summer temperatures in New Zealand” after – and in response to – his May mail exchange with Crowley and Mann.
I feel that Dr. Gergis’s definition of ‘research’ (try to find data I considered inconvenient and did not publish, but I won’t help you) left a deep impression.
It should be possible to determine conclusively when logging was carried out in the vicinity of Oroko Swamp.
The old NZ Forest Service records are probably now held at the Department of Conservation office in Hokitika.
From these records it should be possible to determine the general logging methods and it should be possible to determine which of the local timber mills were allocated the logging rights. Note that the land is owned by the Crown (NZ Government) and logging was illegal without the appropriate permits. If logging was undertaken here (Oroko swamp) it is likely that the timber was milled at the town of Whataroa.
There could even be a historical compilation of logging history already prepared and held at the Department of Conservation (in Hokitika) detailing logging activities in the general area. This is doubly likely given the number of Ecological Reserves and National Parks in the area.
So true! As an aside..What machinery were they using back then for logging? I’m thinking about oil changes,hydrolic fluids,transmission fluids,brake fluids in relation to root systems and depths..Yeah I’ll google it..Thanks Steve..
Yup,hydraulic..
Steve: Fair enough. I may have been too quick. I will re-read the letters in question.
Can you imagine Gavin S or Michael Mann saying this?
I can’t!
Not in a million years..
They didn’t really put instrumental data in an alleged reconstruction, did they?
Steve: it looks like it, but I can’t tell for sure. However, others have put instrumental data into reconstructions: Mann et al 1998-99; Mann et al 2008; among others.
If, subsequent to doing that, they weighted each input based on its alleged correlation with instrumental data, not to mention using the instrumental period for calibration, wouldn’t that generate spurious results?
Steve,
“To further confuse matters (and I’ve triplechecked this), it appears to me that the Neukom et al 2014 Oroko version (and SH reconstruction) is in effect assigned to the calendar year one year before that i.e. it implies that summer temperatures of the preceding year force ring widths, not temperatures of the current summer.”
the “current(austral)summer” reaches from one calendar year into the next (September – February here). It’s largely arbitrary to which calendar year you attribute the season, but it should of course be clear and stated somewhere. Apparently something went wrong in this case, no convention in force or not observed. The safest way would be to label the axes of your graphs or the columns of your tables with season “y-1/y”, rather than “y-1” or “y”.
Maybe Mann stumbled into this trap, this way producing aberrant results ?