The most recent large-scale compilation of proxy records over the past two millennia is PAGES (2017). They made a concerted effort to archive data (to the credit of Julien Emile-Geay), archiving 692 series, but they perpetuated most other sins within the field. Rather than abjuring ex post screening, it carried ex post screening to extremes never previously contemplated: tree ring chronologies with negative correlations to temperature are now banished from view altogether. However, its self-professed quality control did not exclude stripbark bristlecone chronologies, which continue to populate the network.
In keeping with my preference to look at regions and proxy types before worrying too much about aggregates, I looked at their South American network, which is an update of the South American network of PAGES2K (2013), which I discussed a few days after publication here. There were major changes between 2013 and 2017 networks, which were not elucidated in the later study, but which will be discussed in today’s article. The changes illustrate the profound problems with the tree ring chronologies and lake sediment series which make up the vast majority of data in PAGES 2017 and similar studies.
The PAGES2K (2013) South American Network
The PAGES2K (2013) South American network consisted of 23 proxies:
- two ice core proxies from a single site (Quelccaya, Peru);
- one lake sediment proxy (a reflectance indicator from Aculeo, Chile);
- one ocean sediment proxy (Mg/Ca from the Cariaco Basin, offshore Venezuela);
- four instrumental series as supposed proxies for instrumental temperature
- 15 tree ring series. These 15 series were screened from the larger tree ring network of Neukom and Gergis (2012), which had 63 series, which, in turn, had been selected from a larger roster of unknown size using unknown procedures.
I discussed this network a few days after publication, pointing out some serious problems which had been overlooked in the hasty review of PAGES2K (2013) by Nature after it had been rejected by Science. The hasty review was required because IPCC AR6 had cited PAGES2K then in review, not anticipating that it would be rejected. Ironically, Michael Mann was one of the reviewers who recommended rejection.
- I observed that the PAGES2K use of the very standard Quelccaya d18O series (used in most multiproxy series since Jones et al 1998) was upside-down to its use by all other authors – an error that ought to have been picked up and corrected before publication;
- I criticized the use of the four instrumental records as supposed proxies for temperature observing that this “seems to be peeking at the answer if the “skill” of the early portion of the reconstruction is in any way assessed on the ability of the network (including instrumental) to estimate instrumental temperature”. This seems so obvious that it is hard to imagine any serious climate scientist using instrumental temperature data in a proxy network, except that the practice has been encountered much too often, including Mann et al 1998.
- I observed that “one-third of the tree ring series are inverted” and asked whether this was “an ex ante relationship or mere ex post correlation?”. Perhaps the longest standing dispute between Climate Audit and authors relied upon by IPCC is over ex post screening or ex post orientation – both practices being condemned at Climate Audit since its earliest days.
I’ve also long spoken against the use of singleton proxies in multiproxy studies intended for policy reliance on the grounds that replicability across multiple sites ought to be insisted on, before inclusion in a multiproxy study. The Laguna Aculeo indicator – relative absorption band depth (RABD) centred in 660-670 nm said to measure “total sedimentary chlorin” – was then relatively unique; a rare example in a marine sediment here.) Values of the index were not even reported in its data archive – only the temperature reconstruction.
The PAGES 2017 Network
Eighteen of the 23 series in the 2013 network were rejected in 2017; only five were retained. Of these five, one series (Quelccaya d18O) was used in the opposite orientation to the 2013 network. Needless to say, the PAGES2K 2017 authors did not disclose that they reversed the orientation of the series from the earlier study. This was the second PAGES2K 2013 series where the authors recognized that their original use was upside down: I had also criticized their upside-down use of the Hvitarvatn, Iceland series, which they grudgingly corrected in a later publication and even more grudgingly (after some sneering on my part) and much later issued a corrigendum.
The disposition of the 2013 network is shown in the table below.
- the second Quelccaya series (accumulation) – which had also been used in Mann et al 1998 – was rejected as being a “hydroclimate proxy”. They did not explain how it had passed the supposedly rigorous protocols of PAGES 2013.
- the Cariaco ocean sediment series was exported to their Ocean proxy network. (Fair enough).
- the four instrumental series were rejected as proxies with the laconic explanation that they were “instrumental data” (thus, complying with one of my 2013 criticisms)
- they rejected the five tree ring series which had been assigned (ex post) negative orientations. From a statistical perspective, ex post screening of series (which met ex ante criteria) on grounds of negative correlation is just as pernicious as ex post orientation. This is no real improvement
- they rejected one tree ring series due its failure to meet an internal consistency statistic (EPS). It is unclear why this wasn’t picked up in 2013
- they rejected six tree ring series as being too short (less than 300 years). I agree with this policy: if one’s objective is to compare modern temperatures to (say) medieval temperatures, introduction of such short proxies results in inhomogeneity which ought to be avoided. (This sensible 300-year policy was unfortunately ignored in PAGES2017 Ocean network.)
The disposition of the 2013 network is shown below.

New Proxies
There were three “new” proxies: one tree ring series and two lake sediment series. In addition, two tree ring series were updated.
New Tree Ring Proxies
The”new” tree ring series (CAN Composite 15) had, like the other series, been in the Neukom and Gergis 2012 network. For some reason, it had been screened out of the PAGES 2013 network, but now determined to meet the PAGES2K criteria after all. Of the original 63(!) tree ring chronologies in the Neukom and Gergis 2012, only four(!) made their way into the PAGES2017 network. I do not believe for a minute that these four tree ring chronologies are unique thermometers. A more likely interpretation is that their satisfaction of proxy criteria was fortuitous and that they are no more trustworthy as thermometers than the excluded chronologies. Nor did any of these four chronologies reach back to the medieval period: their start dates ranged from 1435 to 1636, start dates, long after the medieval period.
Interestingly, the fresh data in the two updated tree ring series further illustrates the ineffectiveness of these South American tree ring chronologies as temperature proxies, as shown in the plots of Central Andes 6 (CAN 6) and Central Andes 9 (CAN 9) below.
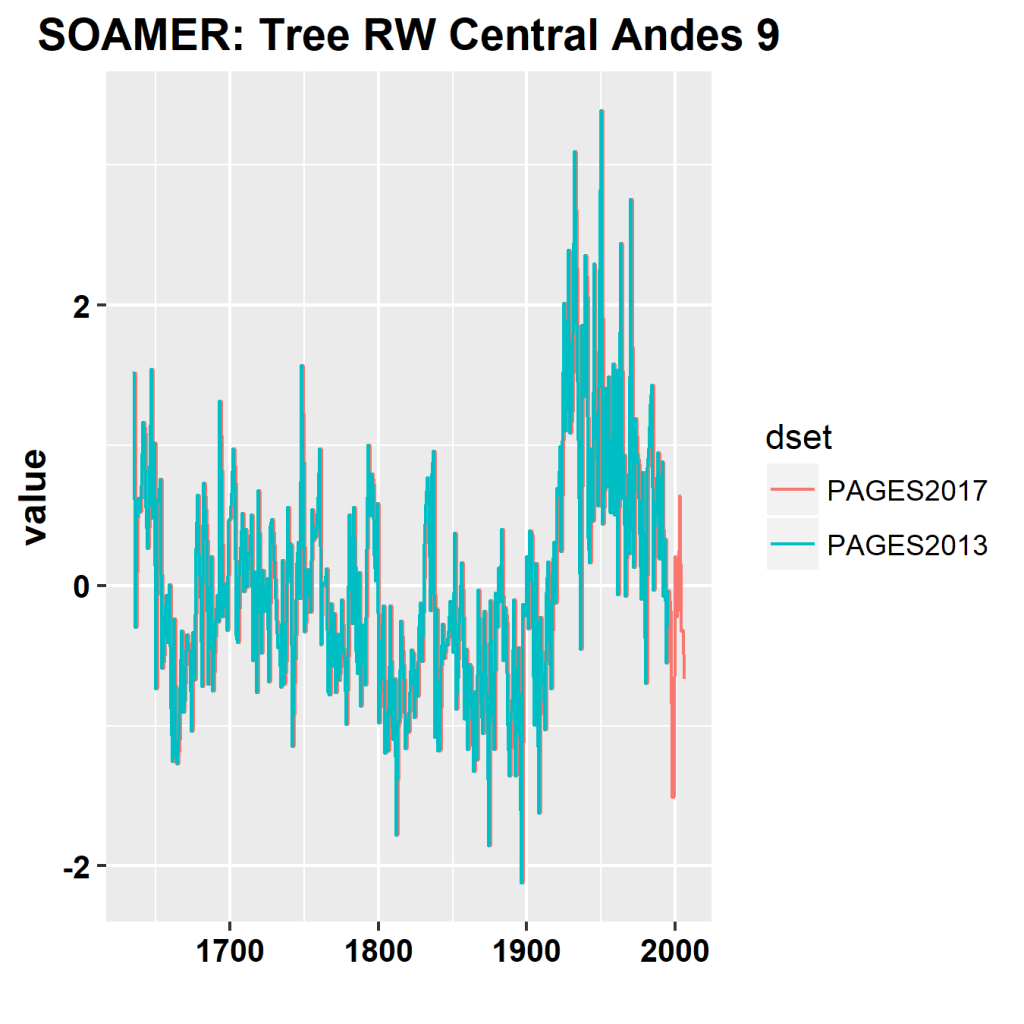
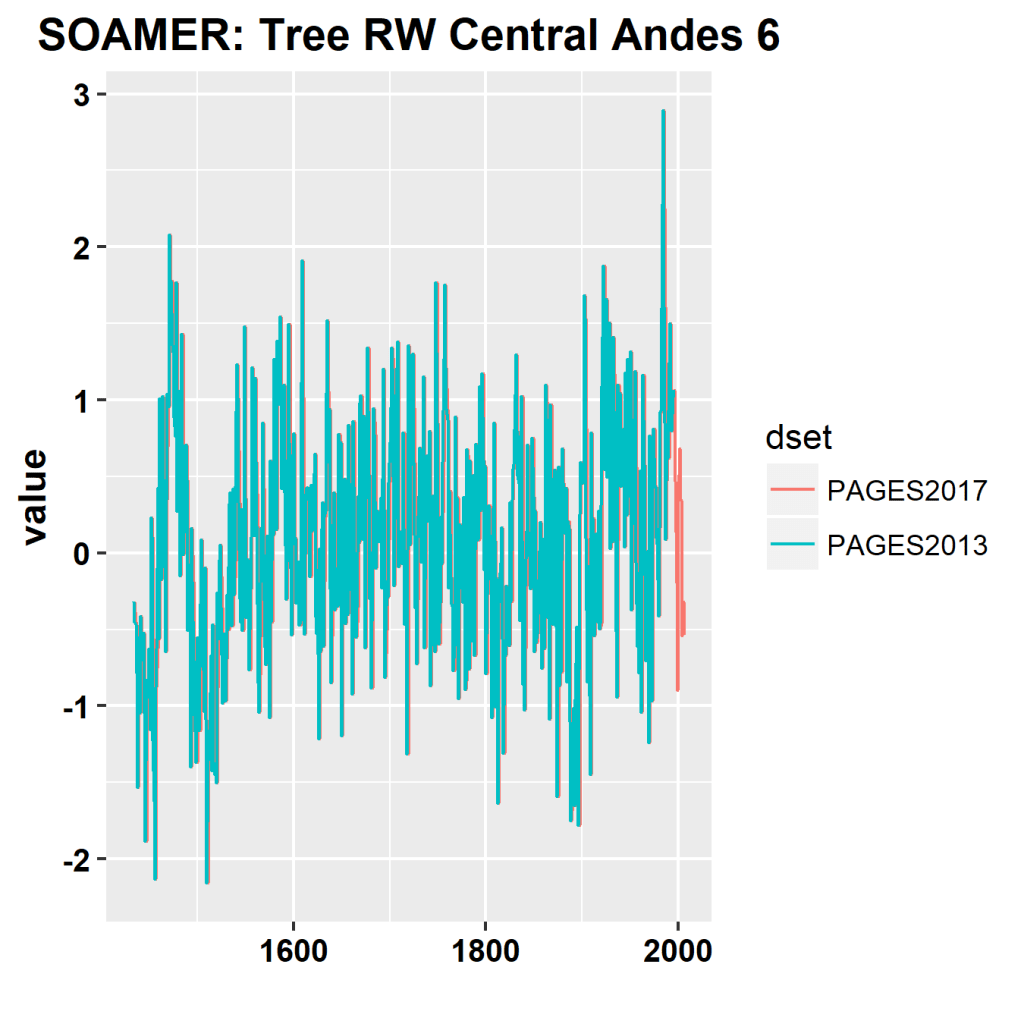
CAN9, which is barely over 300 years long, has high values in mid-20th century, but declines in the last half of the 20th century despite temperatures increase. Its late 20th century decline continues into the 21st century, where values have reverted to the long-term mean. Similarly CAN6 has had little longterm change, but had a late 20th century spike, but has regressed to low values subsequently.
A more plausible interpretation of the data is that these four series were selected ex post because their 20th century values were somewhat higher than values in earlier centuries, but are not magic thermometers.
Laguna Chepical
Only one of the two new lake sediment series purports to show elevated and increasing 20th century levels: the Laguna Chepical (de Jong et al 2013) series. But closer examination of the data shows that the modern portion of this lake sediment series, like the notoriously contaminated Korttajarvi series of Mann et al 2008 and the equally contaminated (but less notorious) Igaliku series of PAGES2K (2013), is also compromised by man-made construction. The original authors (de Jong et al) argued that man-made construction did not compromise lake sediment reflectance as a climate proxy, but, when held up to sunshine, their argument is flimsy.
Laguna Chepical is located in central Chile (32S) at high altitude (3055 m), approximately 130 km north of Santiago. The authors measured reflectance at relatively high resolution, from which they selected the ratio of reflectance at 570 nm to reflectance at 630 nm (R570/R630), interpreted as indicative of the clay mineral content in the lake sediments. They observed a strong decrease in this ratio during the 20th century (for which instrumental temperature data was available). Summer temperatures increased during this period. A simple correlation calculation was said to show that R570/R630 was “strongly and significantly negatively correlated with summer temperatures.” The authors proposed the following explanation:
We reason that cool summers, associated with late lake ice break-up and hence relatively long periods of ice cover, favor the settling of very fine particles in the lake, which leads to increased clay contents in the sediments.
But there’s a catch: around 1885, just prior to the calibration period, there was a ten-fold (!) increase in sediment accumulation rate. This can be seen in a comparison of the two plots shown below: top – R570_R630 versus depth; bottom – “temperature”, a linear transformation of R570_R630, to year. The two red arrows show two pairs of matching points. The layer at ~20 cm of core (right arrow) is dated to ~1885 AD, while the layer at ~41 cm (left arrow) is dated to ~440 AD. In other words, the top ~20 cm of core was accumulated in ~115 years of time, but it had taken ~1445 years to accumulate the prior ~20 cm of core. The rate of modern accumulation is more than ten(!) times greater than the rate of accumulation in the previous 15 centuries.

It is more or less certain that an order-of-magnitude increase in sediment accumulation rate in modern period is due to some sort of man-made land disturbance, rather than climate. For example, modern period increases in sediment accumulation at Korttajarvi and Igaliku were due to local land disturbance (construction, agriculture), not climate. Failing to recognize this led to embarrassing mistakes in Mann et al 2008 and PAGES2K (2013) respectively.
When one re-examines the original publication (De Jong et al 2013 ), one finds that they reported a man-made intervention at the precise time when sedimentation rates increased so dramatically:
A small creek with episodic flow enters the lake in the northwestern side and has formed a small, shallow delta. Additional sediment inflow likely occurs during snow melting from the surrounding slopes to the N, E and W. … An outflow is located in the SW. Since ca. AD 1885, this outflow was dammed and regulated (A. Espinoza, personal communication, 2006). [my bold]
The order-of-magnitude increase in sediment accumulation in the core clearly results from the dam, rather than increase in temperature (the sediment accumulation increase is a local phenomenon). Within this enormous increase in sedimentation rate, there is a noticeable increase in clay mineral content (measured by the fall in R570_630 reflectance values from ~0.90 to ~0.82) to levels which were essentially unprecedented in the previous three millennia. It seems logical that the increase in clay mineral content is a by-product of this dramatic increase in sedimentation, as opposed to the speculative connection to cool summers and late ice break-up proposed to the authors.
The authors purported to dismiss any connection between the construction of the earth dam in 1885 and the subsequent increase in clay mineral content in lake sediments as follows:
An additional, potentially important environmental variable was the construction of the earth dam in AD 1885. However, as indicated by cluster analyses, the construction of a low (ca. 2 m) earth dam and the subsequent relatively small increase in maximum lake depth did not significantly affect most of the sediment properties measured with VIS-RS scanning and had no influence on the R570/R630 values. Therefore, the reconstruction of summer temperatures based on calibration-in-time, which was developed for the period after dam building, is also valid back in time. [my bold]
Unfortunately, the authors failed to provide any statistics or other supporting data for this assertion. I don’t know how “cluster analyses” could possibly show that the construction of the dam in 1885 had “no influence on the R570/R630 values”, which, after all, fell to unprecedented levels following dam construction and subsequent ten-fold increase in sediment accumulation rate. I don’t believe that it is possible to draw such a conclusion from “cluster analyses”. Also, speaking strongly against the assumption of non-impact of dam construction is the following statement in Meyer et al 2017:
The main prerequisite for its [VIS‐RS scanning] successful application is that temporal variation in lake hydrology over the period of interest has not appreciably affected sedimentation dynamics at the core site, since major changes in sediment texture and organic content are likely to create confounding effects in the VIS‐RS signature.
That condition was obviously not met at Laguna Chepical.
Laguna Escondida
The other new South American proxy in PAGES2017 is from Laguna Escondida in northern Patagonia (45S) from Elbert et al 2013. It is a temperature estimate from biogenic silica flux (mg/cm^2*yr). Biogenic silica % and/or flux is measured quite commonly in paleoclimate lake sediment studies, but is not commonly used as a temperature proxy. It measures productivity of diatoms. BSi was used used in one other PAGES2017 proxy, Hallett Lake, Alaska (as percentage, rather than flux). The Hallett Lake series had been previously discussed at Climate Audit, where I noted that its very elevated early values had been chopped off for no apparent reason other than that they were elevated. Another location with BSi measurements is Hvitarvatn , Iceland, a site discussed on several occasions at Climate Audit; its varve thickness measurements were used in PAGES2K. This series had high medieval values, with a decreasing trend to the modern period. It lacks the strong HS-blade of Laguna Chepical discussed above.

Summary
The eight PAGES2017 series are summarized in a consistent panel plot below for the period 1000 on.

The tree ring component of this network is, more or less, a reductio ad absurdum of tree ring chronologies as useful temperature proxues: only four of 63 original tree chronologies have sufficient Hockey Stick-ness to be retained in the network, with even these poor remnants reverting to the mean in the 21st century updates. There is negligible similarity between the three lake sediment series, each of which uses a different indicator, though similar measurements appear to have been taken for all three sites. The only series with a meaningful HS (Chepical) appears to result from construction of a dam in 1885AD, rather than from increased temperature. This leaves the Quelccaya ice core series – which was a staple of temperature reconstructions as early as 1998 and, which, ironically, was used upside down in PAGES2K (2013), corrected in PAGES 2017 without disclosure/admission of the earlier error.
All in all, a rather pathetic show by PAGES2K.
Update (Sep 3, 2021): PAGES2K (2019) further winnowed this network down to only four retained proxies: Quelccaya, Aculeo, CentralAndes11 and CentralAndes15. The two tree ring chronologies identified above as going further down when extended (CAN9, CAN6) were removed from network, no doubt for “good” reasons. So, of the original 63 tree ring chronologies in the Neukom and Gergis (2012) network, only two were retained into PAGES 2019.


38 Comments
Steve, it is good to have you back auditing. How did you find out mann rejected Pages2k (2013)?
Can’t say. But I know for sure.
“Can’t say. But I know for sure.”
Oooh! Another International Mann Of Mystery! 🙂
Is my recollection correct that mann publicly promoted that paper?
Mann’s primary criticism of PAGES2K was the sensible observation that it included multiple regional studies, each of which ought to be properly reviewed prior to reliance, and that it was impossible to properly review so many regional studies as part of an aggregate. It was rejected by Science after it had been used in the Second Order Draft (where it had been relied upon for a key graphic.)
The authors (and presumably IPCC) then pressured Nature to get it accepted in time. Ultimately, Keith Briffa concocted the idea of accepting it as an opinion piece which did not require the same level of peer review as a Letter, secure in the knowledge that IPCC wouldn’t care about the standard as long as it was accepted somewhere. On this basis, Nature accepted it at 5 minutes to midnight on the last day of eligibility for IPCC (the identical timing to Wahl and Ammann acceptance in the previous IPCC report.)
Like Vince, I’m glad to see your awesome talents turned once again to the astounding chicanery of the climate alarmists.
I particularly liked them using the lake with the dam in their proxies. The unmitigated gall is astounding.
However, I’d say your conclusion, that this is “a rather pathetic show by PAGES2K”, is a bit too Canadian. As Thoreau noted, “Some circumstantial evidence is very strong, as when you find a trout in the milk.”
In this case, you’ve found and carefully documented a whole school of trout in the milk, and that indicates deliberate malfeasance rather than a “pathetic show”.
My best to you and yours,
w.
Ditto everything Willis said.
ditto ditto.
There is a sudden surge of climate-related documentation appearing on the horizon – John McLean’s HadCRUT4 audit and the latest IPCC report are examples.
We have sorely missed heavyweight technical analysis recently…..
A more plausible interpretation of the data is that these four series were selected ex post because their 20th century values were somewhat higher than values in earlier centuries, but are not magic thermometers.
One could add the Pages2K maestros later discovered that the modern Andes data was useful for hockey sticks even if the latest decades of CAN9 and CAN6 were not cropped off.
Calling the new stretch of data “updated” is very diplomatic. They cropped data sets. I recall pointing this same Pages2K behavior here re: cropping NAmer tree data sets, maybe for Andes too.
But the new inclusion of the latest data invites–at close inspection–the eyeballing observation that the data sets are not conforming tree-mometers. That’s putting aside the matter that CAN9 and CAN6 do not even conform or correlate with each other!
Steve, October 2018 marks the 20+ anniversary of MBH98, which started it all.
I’m wondering whether you’ve considered a retrospective summary of all the proxy weirdness and practitioner side-steps you’ve encountered since engaging the field.
Such like would make a tremendous contribution to a review journal.
Seconded, the perps have had a free ride for a while (as Steve has gotten on with life) as most of the sane world is ignoring their hysterical temper tantrums
New IPCC sr15 headline statements:
A1. Human activities are estimated to have caused approximately 1.0°C of global warming above pre-industrial levels, with a likely range of 0.8°C to 1.2°C. Global warming is likely to reach 1.5°C between 2030 and 2052 if it continues to increase at the current rate(high confidence).
A.2. Warming from anthropogenic emissions from the pre-industrial period to the present will persist for centuries to millennia and will continue to cause further long-term changes in the climate system, such as sea level rise, with associated impacts (high
confidence), but these emissions alone are unlikely to cause global warming of 1.5°C (medium confidence)
Click to access sr15_headline_statements.pdf
“Warming from anthropogenic emissions from the pre-industrial period to the present will persist for centuries to millennia”
Odd. Do they mean CO2 emitted since the Industrial Revolution will stay in the atmosphere that long? Or that we will continue to emit CO2 for centuries or millennia? If the former, what’s the scientific basis for an extremely long CO2 atmospheric lifespan?
It was the Bern Model of carbon dioxide sequestration, which is what you are looking for Jeff, that pushed me over to scepticism on climate alarmism. They do indeed assert that carbon dioxide we emit today will linger for millennia (not technically each molecule, but in equilibrium).
That goes against all my understanding of equilibria (my degree is Chemistry, with some Physics). It simply rings untrue.
Carbon dioxide is a trace gas because plants (and others) absorb it almost as soon as it is emitted. While we emit it at a greater rate it stands to reason that the proportion in the air will increase. But to claim that it will remain high if we move to emitting at a lower rate requires quite some fixing — but a necessary fix, since alarmism depends on it. And so the Bern Model was born.
bit O/T Steve – have seen the “Reconstructing 800 years of summer temperatures in Scotland from tree rings” https://link.springer.com/article/10.1007/s00382-016-3478-8
Thanks, dfhunter for this link. At first sight (at least to a layperson like me) the cautious approach used by Rydval et al. (2017) seems more likely to produce meaningful results than the scattergun technique adopted by the PAGES2K team. Rydval and co-workers (who include Rob Wilson) restricted their sampling to a single species from 4 sites within a limited geographical area (less than 20km extent) and a limited altitude range (200 to 420 metres above sea level). They assume that tree ring width will reflect high summer (July and August being the warmest months in Scotland) rather than annual conditions. This method, rather than the indiscriminate multiproxy approach pioneered by Mann and co, seems to have the potential to actually tell us something about the variation of climate in the recent past.
@Coldish1 – as a layperson myself I thought the following statement “In fact, the extreme cold (and warm) years observed in NCAIRN appear more related to internal forcing of the summer North Atlantic Oscillation” interesting, seems to imply the ocean temp is the driving factor (or am I reading it wrong?)
Thanks for the new post. I have enjoyed even the non climate ones but I have to admit that your experience with this topic makes for the most magical ones.
The story that Mann wanted to see firmer foundations of regional analysis before use for global gives one me some suspicion that he really had other desires.
Speaking of establishing solid foundations, is anyone aware of any progress on the “divergence problem.”
Steve points out:
“Its [CAN9] late 20th century decline continues into the 21st century, where values have reverted to the long-term mean.”
If proxies prove themselves unreliable in matching the instrumental period how can one rely on their faithfulness hundreds of years prior? Even assuming accuracy within a certain temperature range boundary, one is left not knowing how much of the proxy record got muted when temperature exceeded their effective boundary. Does any paleoclimatologist face this issue head on? If there are we can also ask these people what they think of the setting up of strict protocols prior to analysis and of the use of independent review boards (IRB) to do the post study statistical analysis, applied to the preset protocols.
“If proxies prove themselves unreliable in matching the instrumental period how can one rely on their faithfulness hundreds of years prior?”
That has always been the crux of the matter, the driving force behind “hide the decline”, IMHO.
Steve, in reading your 2013 post I see you had unanswered questions. The first one is answered; Quelccaya was indeed wrongly inverted in 2013. Also you showed then several correlating Quelccaya study plots that diverged from each other from the 1980s onward. Were all three of those plots inverted? Which of the three plots does the 2017 most resemble? How can it be justified to eliminate one Quelccaya proxy (accumulation), because it shows evidence of marine influence, and not eliminate the d18O oxygen isotope proxy from the same location? Do the two correlate to each other?
Excellent analysis, Steve. It is amazing and appalling to see how substantial parts of the paleoclimate science community continue to produce such unscientific work, despite your having previously drawn attention to their errors and unsound practices.
Great to see your expertise and vast experience in this field applied to issues with Pages2k.
All the best,
Nic
Nick writes ” It is amazing and appalling to see how substantial parts of the paleoclimate science community continue to produce such unscientific work, despite your having previously drawn attention to their errors and unsound practices.”
I suspect these “scientists” spend a lot of time in the shower.
We have seen this many times before with tree proxies. The scientists are supposed to determine that a tree species is in fact a temperature proxy before hand. Then, they are supposed to define conditions that would cause the proxy to be invalid, such as extensive logging operations in the 18th century, etc. if the proxy passes those screenings beforehand then the proxy can be included in the subsequent tests. It is invalid to “see if the proxy matches the 20th century temperature spike” and then toss the ones that don’t. No peeking, please.
They don’t toss the ones that don’t follow the moderen meadurements, they throw out those that DO.
They check ex-post for whether it supports their ideas of low temperatures in the past, and include those, unfortunately they too often thereby include tree ring sequences that DON’T follow modern temperatures, but in fact run in the opposite direction.
For some examples, see above.
Even the old 98 study had that, so they chopped of the post 1900 part or post 1950 part and replaced those with instrument measurements to ‘correct’ the record. Pure fraud IMHO.
Ah spelling errors galore 😉
The result of posting from my phone… sorry.
EdeF: There are perfectly sensible reasons why TRW’s from a particular species of tree might respond mostly to temperature in some locations and not in other locations. If precipitation is growth-limiting in some locations, but not others, some TRW may not be larger in warmer years. I think the best way to determine if a tree is behaving like a thermometer is to see how reliably it responds to annual changes in local temperature for the growing season. In a 51-year period, one has 50 year-to-year changes in temperature that one can use for validation. I don’t know if anyone does this. De-trending before looking for a correlation is a poor alternative for identifying temperature-sensitive trees. One might find TRW’s that are clearly sensitive to annual changes in temperature, but in both early periods and recent periods where there is a “divergence problem”, a phenomena that would prove that those temperature sensitive trees aren’t suitable for long temperature reconstructions.
There are two other serious problems with post-hoc selection. One problem is that selection criteria can created signals in pseudo-proxies comprised entirely from noise by selecting for noise in one direction and discarding noise in another direction. Even worse, with a nearly infinite combination of proxies, selection criteria, and analysis methods, one can probably find some combination that will support any hypothesis. With even 100 possible datasets and analysis protocols, even a 95% confidence interval is meaningless. The simplest thing to do is follow Steve’s advice and don’t use post-hoc selection, but that usually produces statistically insignificant changes.
A quick search for “statistics with post-hoc selection”, but paleoclimatologists don’t seem to be interested in applying methods that have been validated by statisticians.
Click to access YekutieliSlides.pdf
https://www.statisticshowto.datasciencecentral.com/post-hoc/
I think the problem is that biology is messy and the changes being examined are really very small. I wouldn’t be at all surprised if your suggestions have already been tried and failed. The methods they use have evolved the way they have, and remain resistant to change, because they are the only ones which provide “results”.
I echo the welcome to your return. I have a question that is only tangential to this theme.
“New IPCC sr15 headline statements:
A1. Human activities are estimated to have caused approximately 1.0°C of global warming above pre-industrial levels, with a likely range of 0.8°C to 1.2°C.”
John McLean’s audit of HADcrut found that
“Data sparsity is a real problem. The dataset starts in 1850 but for just over two years at the start of the record the only land-based data for the entire Southern Hemisphere came from a single observation station in Indonesia. At the end of five years just three stations reported data in that hemisphere. Global averages are calculated from the averages for each of the two hemispheres, so these few stations have a large influence on what’s supposedly “global”.
Related to the amount of data is the percentage of the world (or hemisphere) that the data covers. According to the method of calculating coverage for the dataset, 50% global coverage wasn’t reached until 1906 and 50% of the Southern Hemisphere wasn’t reached until about 1950.
In May 1861 global coverage was a mere 12% – that’s less than one-eighth. In much of the 1860s and 1870s most of the supposedly global coverage was from Europe and its trade sea routes and ports, covering only about 13% of the Earth’s surface. To calculate averages from this data and refer to them as “global averages” is stretching credulity.”
Nick Stokes commenting on WUWT stated that “CRUTEM4 (and HADCRUT) are shown with uncertainties. By the time you get back to 1950, they are large (about 0.5°C). SH uncertainty is over 1°C. I personally don’t use HADCRUT back to 1850, and I’m sure many don’t. But that is no reason to suppress the information.”
My question is what were “pre-industrial levels”? And if anyone wishes to answer that could they please quote an error range.
Well, here’s a new study on tornadoes, worthy of a good statistical stiff wire brushing. Tornado counts are down, therefore create some new statistic that shows increases due to — wait for it — global warming!
https://www.nature.com/articles/s41612-018-0048-2
I am so glad to see you back auditing these absurd collections of arbitrarily chosen (or more likely cherry-picked) data sets. Your deconstruction of the sedimentation rates was something even my non-statistical brain could comprehend. Thank you for continuing your debunking of these profiteering alarmists.
Wow. Good to see you back.
I can never get over the “upside down” business. The issues seem to go well beyond a simple “oops”.
Naively, I would assume that if you are calling something a “proxy”, then you are saying basically that if F is some monotonically increasing function,
P(roxy) = c(oefficent) * F(T(emperature)) + noise
And actually sometimes it seems like we are assuming F is linear.. but nm that for now.
If when you feed all that into your statistical magic, c is just as likely to come out with -c, then doesn’t that pretty much mean that somewhere on the range of valid values for c is the value 0? That’s definitely between c and -c. I.e., P = 0*F(T) + noise, or more simply P = noise?
in my opinion, most “proxies” in use by Mannians (tree rings) are noise.
I mean, how can anyone pretend otherwise if they can be used both “right-side up” and “up-side down”?
Stumbled on a Greg Laden post with some comments where the Pages2k project was discussed. Since I am statistically illiterate, it is not something I can intelligently add much to the discussion. Wondering how the past comments hold up now, considering the passage of time. http://gregladen.com/blog/2014/09/22/steve-mcintyre-misrepresents-climate-research-history/#comments
JD
JD, unfortunately, climate change has a unique property of being anything one needs it to be while still being able to argue a claim with an effective veneer of truth. “Mike’s Nature trick” is still officially “a slang for a clever (and legitimate) technique,” nothing to do with deception.
I suspect the real trick with proxies is that they are unlimited in their selection. Unlike with weather station data, where it’s hard (but not impossible) to data mine, tree rings and lake sediments are everywhere to harvest or discard. There is no policing against tree-ring dumping. Add to this the freedom to use them upside down if one prefers and science easily slips into numerology or astrology. The examples Steve cites of chronologies that are discarded for one reconstruction that work fine for another is a clear red flag if one can be combining signals of virtual noise in order to develop a picture.
The travesty is that climate is a serious issue regardless of the issue of CO2. So much harm was done by zealots that somehow took charge of positions of authority. And whether one believes that or not, all should agree that trust was abused, scientific as well as politically. Institutions need to be protected from human nature perhaps even more than the planet.
jd, It took me about 5 minutes to determine that Ledan is not a scientists and his comments are just simplistic pap. There is no statistical sophistication at all and no detailed analysis of anything. It’s just freshman college science vague statements with no quantification of any kind.
I think the rebuttal comments by realist commenters were very good. That is what I was referring to.
JD
BTW, The comments section is worse if that’s possible than the post itself. Just non scientists throwing around vague verbal formulations that are a waste of time. Divergent is a real scientific problem that to my knowledge has never been addressed adequately.
9 Trackbacks
[…] Read the full analysis here at Climate Audit […]
[…] Read the full analysis here at Climate Audit […]
[…] Learn the entire evaluation right here at Local weather Audit […]
[…] https://climateaudit.org/2018/10/07/pages2k-2017-south-america-revisited/#more-23943 […]
[…] https://climateaudit.org/2018/10/07/pages2k-2017-south-america-revisited/#more-23943 […]
[…] disqualify them for use in setting public policy goals. See his posts on the latest reconstruction here and […]
[…] disqualify them for use in setting public policy goals. See his posts on the latest reconstruction here and […]
[…] disqualify them for use in setting public policy goals. See his posts on the latest reconstruction here and […]
[…] to be used in setting public coverage objectives. See his posts on the most recent reconstruction right here and right […]