The PAGES (2017) North American network consists entirely of tree rings. Climate Audit readers will recall the unique role of North American stripbark bristlecone chronologies in Mann et al 1998 and Mann et al 2008 (and in the majority of IPCC multiproxy reconstructions). In today’s post, I’ll parse the PAGES2K North American tree ring networks in both PAGES (2013) and PAGES (2017) from two aspects:
- even though PAGES (2013) was held out as the product of superb quality control, more than 80% of the North American tree ring proxies of PAGES (2013) were rejected in 2017, replaced by an almost exactly equal number of tree ring series, the majority of which date back to the early 1990s and which would have been available not just to PAGES (2013), but Mann et al 2008 and even Mann et al 1998;
- the one constant in these large networks are the stripbark bristlecone/foxtail chronologies criticized at Climate Audit since its inception. All 20(!) stripbark chronologies isolated by Mann’s CENSORED directory re-appear not only in Mann et al (2008), but in PAGES (2013). In effect, the paleoclimate community, in apparent solidarity with Mann, ostentatiously flouted the 2006 NAS Panel recommendation to “avoid” stripbark chronologies in temperature reconstructions. In both PAGES (2013) and PAGES (2017), despite ferocious data mining, just as in Mann et al 1998, there is no Hockey Stick shape without the series in Mann’s CENSORED directory.
PAGES2K references: PAGES (2013) 2013 article and PAGES (2017) url; (Supplementary Information).
Background: Stripbark Bristlecones and Mann’s CENSORED Directory
In our 2005 articles, Ross and I pointed out that the Mann’s hockey stick is merely an alter ego for Graybill’s stripbark bristlecone chronologies and that the contribution from all other proxies was nothing more than whitish noise. We noted that Graybill himself had attributed the marked increase in late 19th and 20th century bristlecone growth to CO2 fertilization, not temperature – a theory which was arguably a harbinger of the massive and widespread world greening, especially in dry areas, over the 30 years since Graybill et al (1985).
In a CA blogpost here, I further illustrated the unique contribution of bristlecones by segregating the additive contribution to the MBH98 reconstruction of bristlecones (red) and other proxy classes (e.g. ice cores, non-bristlecone North American tree rings, South American proxies, etc. in blue, green, yellow ). This clearly showed that (1) the distinctive MBH98 Hockey Stick shape arose entirely from bristlecones and that (2) all other proxy classes contributed nothing more than whitish noise – with their combined contribution diminishing in accordance with the Central Limit Theorem of statistics.

Mann had, of course, done a principal components analysis of his North American tree ring network without stripbark bristlecones – an analysis not reported in his articles, but which could be established through reverse engineering of his now notorious CENSORED directory – see CA post here. ) These non-descript PCs further illustrate the non-HSness of the Mann et al 1998 North American tree ring network without strip bark bristlecones.

Figure 2. Plot of five principal components in MBH98 CENSORED directory i.e. without Graybill stripbark chronologies, mainly from bristlecones, but a couple of limber pines.
The 2006 NAS panel stated that stripbark chronologies (i.e. the Graybill bristlecone chronologies) should be “avoided” in temperature reconstructions. Although Mann et al 2008 stated that it was compliant with NAS recommendations, Mann flouted this most essential recommendation by including all 20 stripbark series isolated from the CENSORED analysis.
Because of persistent criticism over the impact of these flawed proxies, Mann et al (2008) made the grandiose assertion that he could get a hockey stick without tree rings (and thus, a fortiori, without stripbark bristlecones) – a claim credulously promoted by Gavin Schmidt at Real Climate. However, it was almost immediately pointed out at Climate Audit (here) that Mann’s non-bristlecone hockey stick critically depended on a Finnish lake sediment “proxy”, the modern portion of which (its blade) had been contaminated by modern agriculture and road construction and which had been used upside-down to its interpretation as a temperature proxy in pre-modern times. Mann was aware of the contamination of lake sediments, but argued that his use of contaminated (and upside down) data was legitimate because he could get a HS without them – in a calculation which used stripbark bristlecones. When challenged to show results without either stripbark bristlecones or upside-down mud, Mann (and Gavin Schmidt) stuck their fingers in their ears, with the larger climate community obtusely refusing to understand a criticism that was obvious to any analyst not subservient to the cause.
In the weeks prior to Climategate, I used increasingly harsher terms for the addiction of the paleoclimate community to the data-snooped stripbark chronologies, describing them as “heroin for paleoclimatologists”, with Briffa’s spurious Yamal chronology as “cocaine” (e.g. here here), occasioning much pearl-clutching within the hockey stick “community”.
PAGES 2013
To the accompaniment of claims of quality control, PAGES (2013) dramatically culled the population of the Mann et al 2008 North American tree ring network.
The predecessor network used 790 North American tree ring chronologies: 696 individually identified series plus 94 Schweingruber density (MXD) series that contributed to 37 gridded MXD series. (The fudging of these 37 gridded series is an interesting and under-appreciated chapter in hide the decline, in which Mann chopped off post-1960 declining values and replaced them with instrumental data – see here.)
The new PAGES (2013) network was reduced to 146 series, i.e. 81% (644 series) of the Mann et al (2008) was discarded as presumably not meeting PAGES (2013) quality control criteria. Approximately 45% (66) of these series were reported in PAGES (2013) as having a positive relationship to temperature according to their criterion, with 55% (80) having a negative relationship.
Despite the 81% cull, every (all 20) Graybill stripbark chronology of the MBH98 CENSORED directory (each of which had been subsequently used in Mann et al 2008) was used once again in the PAGES 2013 North American network. In this new network, just like Mann et al 1998, the non-stripbark series – even when opportunistically oriented after the fact according to PAGES (2013) procedure – do not have a Hockey Stick shape. The next diagram compares network averages of scaled chronologies (left- stripbark; right – all other chronologies after orientation), also showing network counts in lower panels. Scale in top panel is identical for both series, but there are far more series in right diagrams.
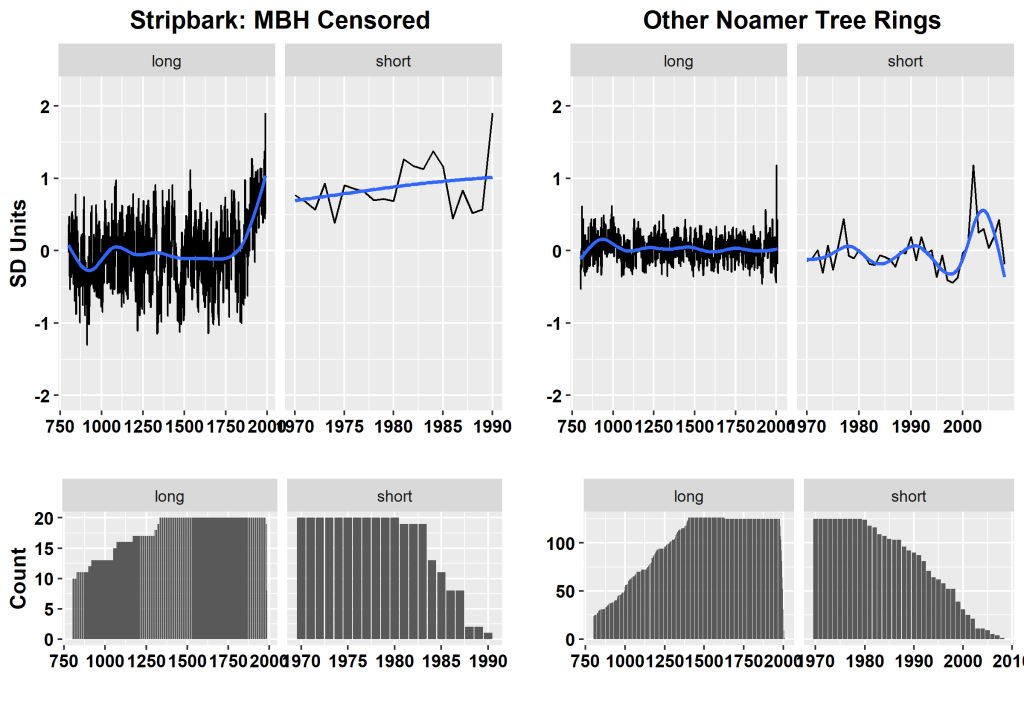
Figure 3. Top left: average of the 20 stripbark bristlecone chronologies common to Mann et al 1998 and PAGES (2013), standardized to standard deviation units; top right – same for the other 126 tree ring chronologies in the PAGES 2013 tree ring network. Bottom: left – count of number of sites included in the stripbark network (maximum of 20); right – same for other 126 chronologies. Note that scale in bottom panel differs between two sides. PAGES(2013) truncated series to 1200-1987 (with many further truncated to 1500-1980). For this diagram, original chronologies from NOAA archive were used.
The simple average of the PAGES 2013 stripbark chronologies has a shape very similar to the distinctive MBH98 Hockey Stick shape (the MBH98 shape is somewhat more pronounced due to extra weighting of more extreme blades in its PC calculation.) The combination is precisely identical to the pattern which I had observed in the MBH98 networks years ago: Graybill stripbark chronologies contribute the Hockey Stick; the vast majority are nothing more than whitish/reddish noise and have no overall climate signal whatever.
PAGES (2013) determined orientation of each series ex post through temperature correlation in the 20th century – a practice that I’ve criticized from my beginning in this field. My position has been that, if, for example, high-altitude or high-latitude black spruce are believed to be temperature proxies, then you have to use all sites in a consistent ex ante orientation, rather than opportunistically flipping series ex post simply because they go down. While the network is subject to this criticism, there is so much noise in the data in the network shown in the right panel that there is no HS even
Notice that the amplitude of fluctuations of the much larger network on the right (126 versus 20 series) is considerably less than the smaller network on left: this is a trivial result of the Central Limit Theorem of statistics: the standard deviation of an average of noise decreases as the dataset gets larger.
The apparent spike in 2002 non-stripbark ring widths (right) has a neat explanation. For some reason, ring widths in 2002 were exceptionally low. Examined in detail (and I looked at the underlying rwl measurement data), many trees at these sites (fewer in number in 2002 than a decade earlier) had negligible, even zero, growth in 2002. Because so many such series had been assigned negative orientation in PAGES 2013, these very low ring width values resulted in very “high” values in the composite.
There are other peculiarities in the PAGES 2013 network. Regardless of the length of the chronologies available to them, they were truncated into two separate subsets: a short subset truncated to 1500-1980 and a “long” subset truncated to 1200-1987. One dataset was archived as original chronology; the other standardized to SD units. Some series were included in both datasets; other series, which on their face qualified for both datasets, were not, for no obvious reason.
The only representation of the North American tree ring reconstruction in the PAGES (2013) article was the color bar (middle panel below) – a style, which either despite or because of its lower information content, has become popular among climate activists. It turns out to be a representation of a 30-year averaged series (bottom panel) which was archived in the Supplementary Information. The 30-year version appears to have been derived from the 10-year average version associated with it in the Supplementary Information. 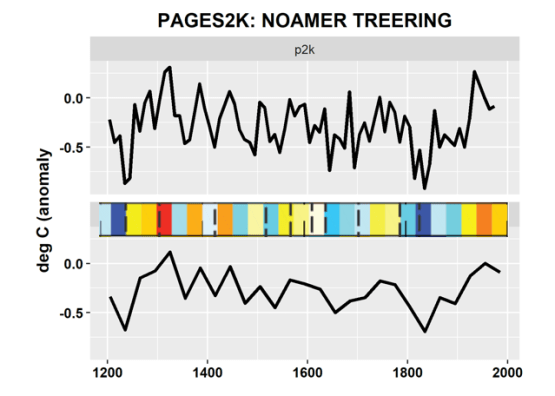
Figure 4. PAGES (2013) North American reconstruction from tree ring network: middle panel – excerpt from figure in original article; bottom panel – plot of data from SI showing 30-year version of PAGES2K North American tree ring network; top panel – plot of data from SI which, for other regions shows annual data, but for North American tree rings, shows 10-year data.
PAGES (2017)
In PAGES (2013), as noted above), the NOAMER tree ring network contained both positive- and negative-oriented chronologies, the sign being assigned ex post based on the correlation of the chronology with temperature. PAGES (2017), in the supposed cause of “more stringent criteria”, introduced the restriction that the tree ring proxies (in all networks) be restricted to proxies which had a significant positive correlation to temperature:
more stringent criteria resulted in the exclusion of some records. .. In most regions, some records were excluded because they did not meet the stricter standards for the minimum length or temporal resolution (criteria detailed above), or because of ambiguities related to the temperature sensitivity of the proxy, or because they have been superseded by higher-quality records from the same site… To be included in the current database, tree-ring data were required to correlate positively (P<0.05) with local or regional temperature (averaged over the entire year or over the growing season). Trees whose growth increases with temperature (e.g., direct effect of temperature on physiological processes and photosynthetic rates) are more likely to produce a reliable expression of past temperature variability compared to trees that respond inversely to temperature, for which the proximal control on growth is moisture stress (e.g., evapotranspiration demand)
They reported that the new positive orientation criterion resulted in the exclusion of 124 tree ring series from. the PAGES (2013) network:
Of the 641 records that together comprise the previously published PAGES2k datasets, 177 are now excluded, of which 124 are tree-ring-width series that are inversely related to temperature.
Relative to a supposed worldwide total of 124 series excluded through negative correlation, no fewer than 123(!) series can be identified in the North American tree ring network. Previously, I’d noticed 3 such exclusions in the South American network. In a quick check, there were zero in the Asia network. PAGES (2017) did not explain (or even observe) the unique impact of this criterion on the North American network, but it’s an interesting question. Only 23 North American tree ring series were carried forward from PAGES (2013) to PAGES (2017). The devastation of the PAGES 2013 network itemization can be seen in the excerpt of the Supplementary Information shown below:
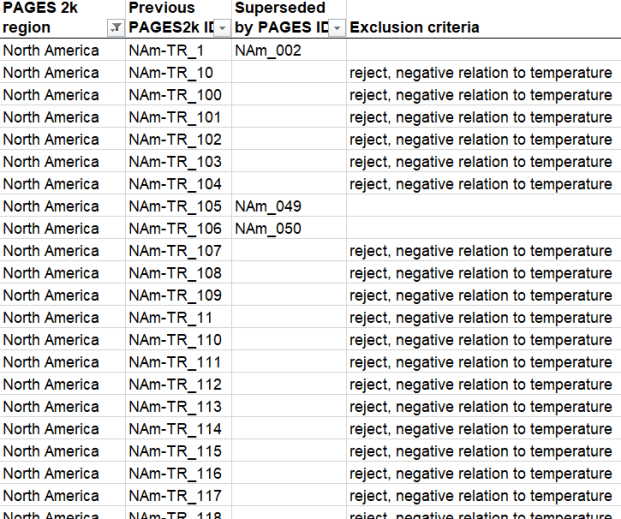
As usual, there is an additional irony and puzzle when the screening is examined in detail: of the 123 NOAMER tree ring series excluded due to their “negative” relation to temperature, 29(!) had been assigned a positive sign in PAGES (2013). This apparent inconsistency was not explained (or even reported) by the PAGES (2017) authors.
 There are 126 “new” tree ring series in the PAGES 2017 North American tree ring network, but the majority of these series date back to the mid-1990s and even the early 1980s, as shown in the chart at left. Many of the numerous series from the early 1980s and 1990s are from the Schweingruber collection from which the Briffa reconstruction (with its notorious decline) was calculated. These series had presumably been previously considered in Mann et al 1998, Mann et al 2008 and PAGES (2013), but, for some reason, qualified in PAGES 2017 for the first time.
PAGES (2017) retained (only) 23 series from PAGES (2013).  The number retained from Mann et al 2008 via PAGES2K was only 10, the majority of which were classic stripbark bristlecone chronologies, including Graybill chronologies from Timber Gap Upper, Flower Lake, Cirque Peak, Pearl Peak, Mount Washington, San Francisco Peaks,and, of course, Sheep Mountain. The PAGES (2017) network added two “classic” stripbark chronologies, which had not been used in PAGES (2013), but which had been a staple of many multiproxy studies: Graumlich’s Boreal Plateau and Upper Wright Lakes stripbark foxtail chronologies from the early 1990s, previously used in Esper et al 2002, Briffa and Osborn 2006, Hegerl et al 2007 and others. (Discussed on numerous occasions at CA, including here here).
It also added a composite (Salzer et al 2013) which updated three Graybill sites: Pearl Peak, Mount Washington, Sheep Mountain), each of which is thus included in both versions. The PAGES2017 version of the Salzer composite continues to 2009 – three years later than the series in the original publication or in archived ring width data. The provenance of this extra data was not reported. The extension is shown at right (green for 1980-1990; red for 1991-2009). The stripbark bristlecone data reached its peak in the late 1970s, exactly when Mann terminated his bristlecone-based reconstruction. Since then, bristlecone widths at these three sites have gone down despite increasing temperatures over the past 40 years, though they remain at historically elevated levels. In our 2005 criticism of Mann et al 1998, we had speculated that bristlecone ring widths would not continue to increase with higher temperatures and, indeed, they have not done so.
The stripbark chronologies, though reduced somewhat in number from the PAGES 2013 network, continue to play a unique role in the North American tree ring chronology. The diagram below compares the stripbark series in PAGES (2017) to non-stripbark chronologies in the same style as Figure 3 above. Despite industrial-scale ex post screening, in the non-bristlecone network (140 series – right panel), there is only a very slight increase at the start of the 20th century increase, no increase in the second half of the 20th century, with a possible reversion towards the mean in the sparser recent data. This pattern seems just as likely, or more likely, to be nothing more than what can be expected from ex post screening of reddish noise, and obviously does not capture the expected temperature “signal”. Nor do the bristlecones perform much better.
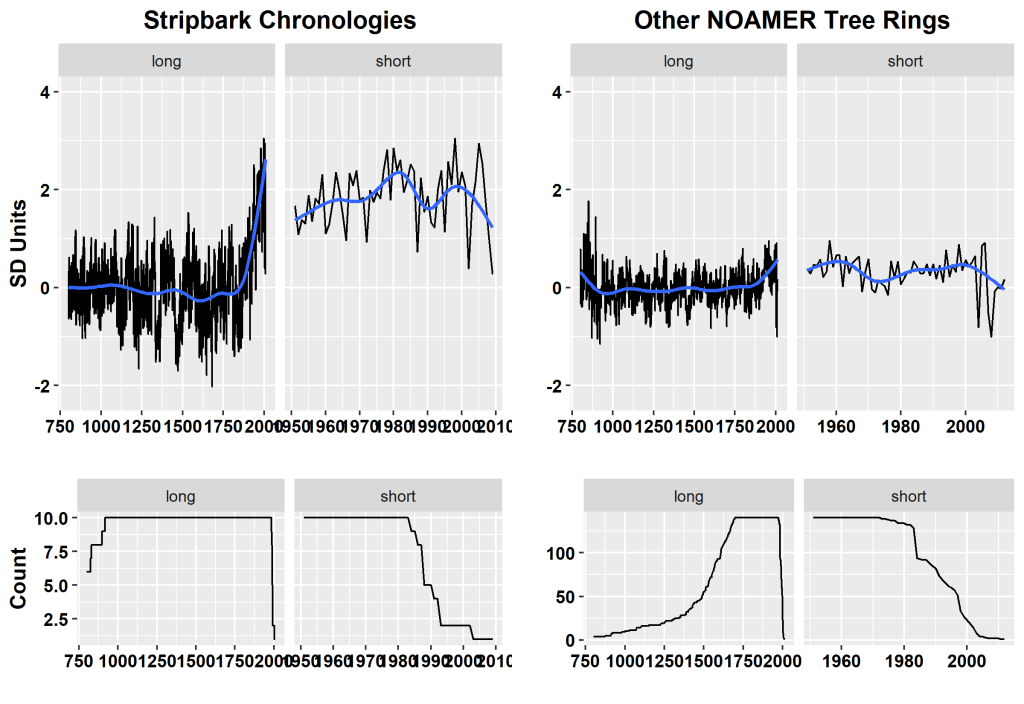
Figure 5. In same style as Figure 3, but for PAGES (2017). The stripbark network consists of the seven series from the CENSORED directory carried forward into PAGES 2017 plus two stripbark foxtail chronologies (Graumlich) re-introduced in PAGES (2013).
In passing, I noticed some frustrating technical misinformation that I might as well document. Although we’ve already seen that the PAGES 2017 technical spreadsheets explain exclusion of North American tree ring networks as due to “negative” correlation to temperature, elsewhere PAGES (2017) stated that many exclusions were due to other technical reasons: use of a reconstruction rather than a chronology (measurement data) in the earlier PAGES 2013 network, including reconstructions that made use of principal components – a topic not unfamiliar to readers of Climate Audit:
Unlike [3 – PAGES 2013], in the present version, tree-ring records include only ring-width or density measurements rather than the reconstructions derived from them. Therefore, many of the North American dendroclimatological records used in [3] are no longer employed. Also, in the North American component of [3], unlike the current version, tree-ring data were screened and incorporated into the North American temperature reconstructions as the leading principal components of the tree-ring chronologies utilized. The rationale, methodological detail, and associated reconstruction performance metrics for that usage are described in the supplemental information in [3] (cf. section 4a).
While this explanation seems superficially plausible, none(!) of the 146 records in the PAGES (2013) North American tree ring network were (temperature) reconstructions, let alone reconstructions calculated with the use of principal components. Every series in the PAGES (2013) North American network was either an ITRDB chronology truncated to 1500-1980 or an ITRDB chronology standardized to SD units (after truncation to 1200-1987).
North American Tree Ring Chronologies in PAGES Arctic Network
The PAGES2K (2013) Arctic network contained four North American tree ring series, while the PAGES (2017) Arctic tree ring network contained three North American tree ring series.
Three of the PAGES (2013) records were regional chronologies from D’Arrigo 2006: Central NWT, Seward and Yukon. The fourth was Wilson’s Gulf of Alaska/Coastal Alaska temperature reconstruction – the only temperature reconstruction in PAGES 2013 from North American tree rings, which, for good measure, was used in a duplicate copy the North American network.
As long-time Climate Audit readers are aware, Jacoby and D’Arrigo withheld supplementary information for almost 10 years. The eventual archive, published shortly before Jacoby’s death, remains incomplete and frustrating. In 2016, I wrote a very detailed examination (Cherry Picking By D’Arrigo) of the Central NWT regional chronology of D’Arrigo 2006 (and now PAGES 2013), as it represented many of the worst practices of the paleoclimate community. It annoys me to re-read the article. The Central NWT chronology built on the earlier Jacoby chronologies at Coppermine River and Hornby Cabin, which were used in Mann et al 1998.
The PAGES (2017) Arctic network contained three North American tree ring chronologies. It replaced Wilson’s Gulf of Alaska temperature reconstruction with a Gulf of Alaska temperature reconstruction (Wiles et al 2014) with more elevated closing values. I discussed these two datasets quite critically in a 2016 post entitled Picking Cherries in the Gulf of Alaska. These comments carry forward to the similar replacement in PAGES 2017. Ironically, although PAGES 2017 purported to replace reconstructions with original chronologies, in the only PAGES 2013 North American tree ring series which was a reconstruction (Wilson’s Gulf of Alaska), it replaced it with a series which was also a reconstruction.
As the present post is already long, I’ll visit this topic on another occasion.
Conclusions
- ex post screening based on recent proxy trends necessarily biases the resulting data towards a Hockey Stick shape – a criticism made over and over here and at other “ske;ptic” blogs, but not understood by Michael (“I am not a statistician”) Mann and the IPCC paleoclimate “community”;
- the PAGES 2017 North American tree ring network has been severely screened ex post from a much larger candidate population: over the years, approximately 983 different North American tree ring chronologies have been used in MBH98, Mann et al 2008, PAGES 2013 or PAGES 2017. I.e. only ~15% of the underlying population was selected ex post – a procedure which, even with random data, would impart Hockey Stick-ness to any resulting composite
- despite this severe ex post screening (in both PAGES 2013 and PAGES 2017), the composite of all data other than stripbark bristlecones had no noticeable Hockey Stick-ness and does not resemble a temperature proxy.
- PAGES 2013 and PAGES 2017 perpetuate the use of Graybill stripbark chronologies – despite the recommendation of the 2006 NAS Panel that these problematic series be “avoided” in future reconstructions. PAGES 2013 (like Mann et al 2008) used all 20(!) stripbark chronologies, the effect of which had been analysed in Mann’s CENSORED directory. PAGES 2017 continued the use of the most HS stripbark chronologies (Sheep Mt etc) both in the original Graybill version and in a more recent composite (Salzer et al 2014), while adding two stripbark chronologies used in Esper et al 2002 and other IPCC multiproxy studies.
In the past, I charged Mannian paleoclimatologists as being addicted to Graybill stripbark bristlecone chronologies – which I labeled as “heroin for paleoclimatologists” (also describing Briffa’s former Yamal chronology as “cocaine for paleoclimatologists”. Unfortunately, rather than confronting their addiction, Gavin Schmidt and others responded with haughty pearl-clutching indignation, while, behind the scenes, the PAGES consortium doubled down by perpetuating use of these problematic proxies into PAGES 2013 and PAGES 2017.
On this day in 2009, a few weeks before Climategate, I suggested appropriate theme music by Eric Clapton and Velvet Underground. Still apt nine years later.


87 Comments
Well, it seems to me that you could have saved yourself lots of work by just reposting your objections to the original Mann HS paper, which are the same objections to every succeeding Mann-alike since then … it’s deja vu all over again.
I gotta say, I am totally gobsmacked. Near as I can tell, they’ve got a perfect record—every error, every wrong process, every data-mining method, every after-the-fact proxy selection, every piece of bad data, every bogus stripbark pine record, they have have all simply been moved from one study, to the next, to the next, without the slightest sign that they have learned from, or even noticed, their egregious errors …
Can’t say enough for your patience in all of this, wading endlessly through the murky waters only to find the same bovine waste material as you found last time.
Gotta say, if I were doing it, I certainly wouldn’t have been as … well … Canadian … in my description of these double-dealing lying malfeasant pseudo-scientists.
Grrrr …
As always, the world owes you immense thanks for your tireless work in revealing this unending deception time after time.
Well done, that man!
w.
“their egregious errors”
I don’t think anyone can say that these were errors.
Jeff Albert: I’d say they were errors, made with great care.
“As always, the world owes you immense thanks for your tireless work in revealing this unending deception time after time.”
Well said, Willis; absolutely right.
Steve, you certainly have my thanks. It is appalling that such unworthy and completely unscientific behaviour is still continuing 20 years after Mann’s original hockey stick paper.
thanks for kind words from both of you, who deserve corresponding credit for your own labours in this peculiar enterprise.
Donald Trump is using Stalinist tactics to discredit climate science
A panel to promote an alternative explanation for climate change would be disastrous. Yet that’s what White House officials want.
Expert Micheal speaks about Stalinist techniques 😀
“Mann et al (2008) made the grandiose assertion that he could get a hockey stick without tree rings (and thus, a fortiori, without stripbark bristlecones) – a claim credulously promoted by Gavin Schmidt at Real Climate. However, it was almost immediately pointed out at Climate Audit (here) that Mann’s non-bristlecone hockey stick critically depended on a Finnish lake sediment “proxy”, the modern portion of which (its blade) had been contaminated by modern agriculture and road construction and which had been used upside-down to its interpretation as a temperature proxy in pre-modern times. Mann was aware of the contamination of lake sediments, but argued that his use of contaminated (and upside down) data was legitimate because he could get a HS without them – in a calculation which used stripbark bristlecones.”
Ouch!
Mann appears be oblivious to “circular reasoning”.
Steve,
I mentioned in a post a few years ago that there’s a fascinating library of
tree rings in cold storage at the University of Arizona…
combined with actual FIELD observations this got us:
https://www.nps.gov/seki/learn/nature/sequoia-fire-history.htm which is
Multi-Millennial Fire History of the Giant Forest, Sequoia National Park, California,
by Swetnam, et al.
You can get to the PDF of this report from the little “here” embedded in the
National Park Service precise of the main study.
A goodly number of Sequoia trees sampled by Swetnem were mighty near some of
the bristle cones used by Mann, et al.
I’m amazed no one seems to want to make use of this “library” the goes back
almost 3,000 years.
Thanks for the link – Several interesting details in the article especially regarding the frequency of fires in the sequia’s – approximately every 5-15 years during the MWP, which seems much more frequent than I would have expected.
FWIW, One of my concerns regarding reconstructing temps using tree ring proxies is the failure to reconcile the reconstructed temps with other known (but unofficial) proxies, such as changes in tree line elevations, tree stumps uncovered by retreating glaciers, etc. In this case, the more frequent fires would indicate dryer conditions and more likely warmer & dryer conditions. Yet not being reflected in the tree ring proxy and thus not reconciling the reasonableness of such temp reconstruction.
Joe,
To the best of my recollection, the temperature reconstruction Swetnam shows for both
the Medieval Warm Period and the Little Ice Age in Figure 8, graph C, has never
been refuted (or even acknowledged) in the regular dendrochronological literature.
The datum, of course, only applies to the Sequoia stands/areas in the study.
RSB,
Chances you could show a graph or two here to save quite a few of us some digging time? Thanks. Geoff
In the discussion part of the paper under “Fire and Climate” I found this comment.
“The lack of a significant correlation between
our giant sequoia fire time series and the
Great Basin upper treeline bristlecone pine records
is perhaps not too surprising.”
What are your thoughts?
Thanks for the very useful link to a valuable report and paper.
“The scientists found the years from 800 to 1300, known as the Medieval Warm Period, had the most frequent fires in the 3,000 years studied.”
“Reduction of 150 years of accumulated fuels (living and dead) as a consequence of fire suppression is a difficult task, fraught with risk to both ecosystems and people.”
Fire Ecology Vol. 5, No. 3, 2009
doi: 10.4996/fireecology.0503120
Swetnam et al.: Fire History of the Giant Forest
Page 145
In exemplum :
https://cdn.uanews.arizona.edu/s3fs-public/styles/gallery-large-800×600/public/story-images/AED_sequoia%20(1).JPG?itok=aTGBwywz&_ga=2.150610102.1683359010.1546782571-2062793656.1546782571
The University of Arizona tree library has slabs to study, not just
cores…
Reblogged this on Climate Collections.
RE: R.S. Brown
“I’m amazed no one seems to want to make use of this “library” the goes back
almost 3,000 years.”
I would be ‘amazed’ if hockey sticks were found among them and weren’t used . . . my guess is, if there aren’t any ‘hockey sticks’ – or worse – evidence of warmer & dryer conditions than now, they won’t/can’t be used. Didn’t happen. Thanks for the link.
The guys need to get back into rehab.
Stripbark bristlecones are the oldest = original tree inhabitants of North America: the First tree Nation of the continent. As they are marginal today (+ strip handicapped) they deserve all the positive discrimination they can get in government subsidized works. / sarc off
P.S.: to hell with the effects of precipitation on trees, temperature rules!
Steve, shouldn’t you write a paper about this? It would be easier to cite your findings to the “must be peer-reviewed in an appropriate journal” -crowd.
Another tip for you Steve, Simo Ruoho from finland has found biases in GHCN qc regarding the temps of Sodankylä. He claims that the qc algorithm removes cold days much more than warm days post -2000 compared to the Finnish Meteorological Institute data, creating an artificial warming trend.
His posts (in Finnish) can be found here:
https://www.facebook.com/groups/ilmastofoorumi/permalink/10155977628892725/
Perhaps you could take a look?
Who would be asked to peer review it?
I generally try to stay away from temperature data other than to compare data to models from time to time.
My rationale for avoiding temperature data is that it’s very time consuming and would use up all my time, when my energy is already flagging very rapidly.
Hi Steve
as a long time reader of your blog just want to say thanks for all the hard work/analysis/stimulating posts over the years.
sounds from your comment that age/some problem may be catching up with you.
look after yourself & the family.
I join Mr. Hunter in thanking our host for his effort. Very well spent in pursuit of the truth. Sorry to hear your energy lags. It takes energy to create apt heroin and cocaine analogies. And thanks for video, we don’t get too much Velvet Underground on the radio. “I guess that I just don’t know.” If only alarmists could bring themselves to sing along with Lou Reed.
With further thanks, Steve.
In a more rational future time, Climate Audit will be quoted as a top example of scientific error correction in the historical time when blogging grew in importance.
As you know, I have wasted too much time on correcting temperature time series errors. You were wiser than I, to avoid that minefield.
Keep well. Geoff
I tried to find a link… something that has been very helpful (I have three small children) was something I read, possibly on Wikipedia, about it being possible to bypass mental fatigue simply by reminding yourself that your mental ability to perform tasks is essentially limitless. The theory was humanity developed mental fatigue as an adaptation to minimize energy usage, not sure if that’s true but I have found the self-reminder surprisingly effective.
Sad to see the stripbark chronologies still in the mix. Is the NAS recommendation not to use them mentioned, with a reason given for disregarding it, or was it just ignored?
There seems to be a contradiction in your article. You wrote, “none(!) of the 146 records in the PAGES (2013) North American tree ring network were (temperature) reconstructions”. But a little later when discussing the Arctic network, you wrote “Wilson’s Gulf of Alaska/Coastal Alaska temperature reconstruction – the only temperature reconstruction in PAGES 2013 from North American tree rings, which, for good measure, was used in a duplicate copy the North American network.” The latter sentence seems to imply that Wilson’s reconstruction is also part of the PAGES2013 North American network, while the first sentence claims that there were no reconstructions in that network. Can you please clarify or correct?
I need to clarify and correct slightly. I hadn’t noticed duplicate use of Wilson when I was writing about NOAMER network. I noticed it when I wrote short section on Arctic networks at end. While the two series have same citation, they are slightly different.
The Arctic network version of Gulf of Alaska reconstruction matches D’Arrigo 2006 version.
Now that I realize that NOAMER and Arctic versions are different, I tried to find origin of North American version and it took me a while to figure out. It is the ak096.crn series archived https://www1.ncdc.noaa.gov/pub/data/paleo/treering/chronologies/northamerica/usa/ak096.crn corresponding to measurement data ak096.rwl.
It’s never easy sorting out anything that D’Arrigo et al have touched.
I’ll try to figure out what they did more exactly, as I’m curious.
I think that I’ve figured out the provenance of the various versions of the Gulf of Alaska series and it wasn’t easy, since it isn’t very logical.
The PAGES(2013) Arctic network version of Gulf of Alaska (Arc_7), cited to D’Arrigo et al 2006, is a related temperature reconstruction from Wilson et al 2007. Though Wilson et al 2007 was published after D’Arrigo et al 2006, it appears to be relied upon by D’Arrigo et al 2006 (which was probably rushed to meet IPCC deadlines). The W07 temperature reconstruction is a linear transformation of Wilson’s RCS chronology (ak096c.crn at NOAA). The D’Arrigo 2006 Gulf of Alaska RCS chronology (archived in 2012) is slightly truncated from W07 (start at 713 instead of 616), but otherwise digitally identical.
The PAGES (2013) North American network version of Gulf of Alaska (NAm-TR_3) is a different chronology derived from same measurement data (ak096.rwl at NOAA). Wilson et al 2007 also archived a STD chronology (ak096.crn at NOAA), which is not the same as the RCS chronology ak096c.crn. The PAGES2013 version is truncated to 1200-1987 and standardized to SD units.
My comment is mostly right: the NOAMER network consists entirely of chronologies. Wilson’s Gulf of Alaska temperature reconstruction is used in the PAGES 2013 Arctic network.
The Gulf of Alaska version in the Arctic network is calculated from exactly the same measurement data as the Gulf of Alaska version in the North America network, but use different calculations: one is derived from RCS tree ring standardization, while the other is derived from STD tree ring standardization.
Plain as upside-down mud.
Thanks for the detective work.
Is there any significant difference between a chronology and a reconstruction which is an affine transformation of that chronology (as you describe W07’s reconstruction)? It seems that one would obtain the same results by passing either series through the amalgamation process.
In most downstream processes, I can’t see that it matters a speck. If you wanted to average the series without further centering, then you’d need to undo the affine transformation, which is a problem if you don’t know the affine transformation. The only other case where I can picture a difference is when there’s a principal components operation on a network of chronologies.
Differences in tree ring standardization (i.e. allowance for juvenile growth in calculation of chronology) will typically make more far more difference than an affine transformation of the chronology. For scientific purposes, it’s ridiculous to proffer tree ring chronologies without the measurement data. Nonetheless, PAGES2K, to its shame, acquiesced in this pernicious practice, escpecially for European data.
Unfortunately this is quite common. The Germans have always refused to publish any measurement data for their important Oak chronologies, which makes it impossible to check their work. We just have to take their word for it. We can’t check whether they matched the parts of their chronologies correctly as we have no or insufficient data to be able to check. The Belfast data was also never published until forced via UK FIOA (by Keenan) in 2010.
And as could be expected attempts to reconstruct the long Belfast Chronologies show that there are big issues, T-score too low between the more recent parts and the (formerly & now again) floating Long BC part…
The reconstruction took quite some work as all pointers and lots of data was still missing (just raw measurements, code and provenance), such as C14 measurements for (many/all?) sections, and the index of what segment of wood was used for each part of the (published) master chronology (chronologies). To reproduce the published results then meant that people have to use the raw data and find out for themselves what matched where.
One team has made an alternative proposal for one of the problem areas (AD & Late BC), but their proposal needs many intermediate steps via wood from another area of the UK, and the result seems rather invalid to me (as other sections are then supposed to overlap but they do not match statistically). Anyways they seem to have succeeded in reconstructing Belfast Long BC (prior to ca 950 BC), Belfast Late BC and Belfast AD. Yet these 3 do not seem to overlap in a statistically valid way. Yet these 3 master sequences are assumed to be one long sequence and together with the unpublished & unverifiable German Oak chronology form the basis for e.g. the Radiocarbon calibration curve, certainly for the 1st millennium BC…
The older segments of the Irish and German Oak sequences have been placed approximately in time using RC dating, prior to determining a match with other segments to form the master chronologies. That obviously required another preexisting tree-ring chronology (+ sufficient RC samples taken from that master). Well, that RC dating was based upon earlier work by Suess and is based on the Bristle-cone chronology (…).
Although that one is also considered to be continuous it is in fact made up from many linked segments, and again based mostly upon core samples and not entire cross-sections (let alone based upon a single long lived tree). This means that any dating error in this Bristle-cone chronology will have been transferred to the European Oak chronologies.
And there is a ‘little’ problem with RC dating, likely related to the Hallstatt plateau (a strange flat-lining of the RC calibration curve in the 1st Millennium BC for which there is no known natural explanation, and which starts and ends with a very discontinuous jump).
The issue is that samples from 3 skeletons from soldiers defending the gate of Nineveh during it’s fall in 612 BC (absolute) are dated by the RC calibration curve some 200 years too early. Alternative explanations are to no avail (such as a fish diet, yet that must be sea-fish to be of any use, yet Nineveh is not anywhere near a sea and fish was not part of the local diet in any sufficient quantity; and other issues).
See: R.E. Taylor et al., 2010, Radiocarbon August 2010, “Alternative Explanations for Anomalous 14C Ages on Human Skeletons Associated with the 612 BCE Destruction of Nineveh” (URL: https://www.researchgate.net/publication/277048600_Alternative_Explanations_for_Anomalous_14C_Ages_on_Human_Skeletons_Associated_with_the_612_BCE_Destruction_of_Nineveh).
” ex post screening based on recent proxy trends necessarily biases the resulting data towards a Hockey Stick shape – a criticism made over and over here and at other “ske;ptic” blogs, but not understood by Michael (“I am not a statistician”) Mann and the IPCC paleoclimate “community”
Unfortunately we won’t ever know his understanding level, but after so many different math solutions which create the same bias, it is pretty clear to me that Michael Mann is one who does understand the problem he creates. He’s been quite clever in how he’s worked the math so many ways to the same effect. I think there are others in the field though, who simply don’t/can’t ‘get it’.
a good point that makes sense. Nice to hear from you.
“As the present post is already long, I’ll visit this topic on another occasion.”
Long, but absolutely masterful piece of work, I never figured how you could have such patience and mental agility to recall and link all these topics; the content as usual a joy and to follow. I assume all the people referenced are in gaol now, I know one, Gavin S, must of had day release to pick up an honorary degree from Bristol University this year, sadly now the home of other climate fraudsters.
Not specific to proxy issues but bossy Gavin is displaying more certitude than ever:
Gavin Schmidt in NY Times today:
“When this is all put together, the conclusions are inescapable: Without human activities the planet would not have warmed over the past century. When scientists include all of the effects that humans have had on the climate system, they can match them with these many independent and varied observations. Our best assessment is therefore that humans, at least the ones responsible for the bulk of carbon dioxide emissions, have been responsible for all of the recent trends in global temperatures.”
“The forensics have spoken, and we are to blame.”
correction, article was dated yesterday (October 24, 2018)
Gavin, as usual, is full of Schmidt. Even the IPCC does not attribute humanity “responsible for all of the recent trends in global temperatures”.
Isn’t atmospheric moisture a primary water source for pine trees? Bristlecones seemingly evolved to survive the cold dry climate of major glaciations.
Here’s a study that considers possible causes for “unprecedented” tree-ring growth in bristlecone pines at their highest elevations:
http://www.pnas.org/content/106/48/20348
Surely you understand that tree ring growth is a result of a photosynthetic reaction. Photosynthesis does not occur at night so it is very difficult to understand how measures of tree ring width reflect the ambient temperature at night.
More generally, the photosynthetic reaction is given as: water + carbon dioxide + light yields cellulose and oxygen. The energy for this reaction is supplied exclusively by light. Nowhere in this reaction is there reason to believe that it is affected by the ambient temperature.
Click to access Rate%20of%20photosynthesis%20limiting%20factors.pdf
Short brief showing the non light intensity temperature dependence of photosynthesis.
Surely you understand that tree ring growth is a result of a photosynthetic reaction. Photosynthesis does not occur at night so it is very difficult to understand how measures of tree ring width reflect the ambient temperature at night.
More generally, the photosynthetic reaction is given as: water + carbon dioxide + light yields cellulose and oxygen. The energy for this reaction is supplied exclusively by light. Nowhere in this reaction is there reason to believe that it is affected by the ambient temperature.
This observation appears nowhere else on the siteSo it is not, in any sense, a duplicate comment.
Photosynthesis encompasses a series of enzyme-catalyzed conversions and, like most chemical reactions, also the rate of enzyme-catalysed reactions increases as the temperaturen is raised, A 10 degree Centigrade rise in temperature will speed up enzymtic reactions by 50 to 100%.
in the technical literature concerning bristlecones, some of which was discussed in McIntyre and McKitrick 2005 (EE) and in CA posts tagged “bristlecone”, both photosynthesis and respiration are said to affect ring widths in countervailing directions.
The photochemical step in the production of tree rings completely determines the stoichiometry, that is, the amount of cellulose produced. The photochemical step probably produces high energy intermediates which then go on in enzyme mediated reactions to produce the final product and transport it to its ultimate destination. The subsequent steps may well be temperature dependent but in no case determine the amount of product, that is, the width of the tree ring.
Recently there has been some warning about plants in polar regions growing too big. I think they argue that temperature increase is the guilty factor. But plants grow more when there is more CO2 in the air. The correction of tree rings when humidity, CO2 and other factors must be a huge job. Do anybody know if CO2 content is taken as an important corrective factor when tree rings are used as a temperature proxy?
I think pages2k is doing a great job to gather proxy data, even if there are errors. We surely have something to learn from proxies.
PAGES2K has hugely oversold their archiving contribution. I say this as someone who probably knows the state of archival data better than anyone. In the North American network, for example, measurement data for most (~98%) of the records used in PAGESK 2013 and/or PAGES 2017 was already deposited at NOAA. So their only “contribution” was their screening – the basis of which was both inconsistent between collations, not operationally articulated and bias-inducing. Their archival version in PAGES 2013 also unjustifiably and pointlessly truncated longer versions of the records already available.
For the few new NOAMER tree ring chronologies introduced in PAGES2K, they failed to ensure that the underlying measurement data was archived. The lack of such measurement data makes it impossible to analyse. Any proper archiving sponsored by PAGES2K would have ensured integrity through archive of measurement data.
Their European tree ring network is horrendous in terms of measurement data archiving. In this network, they abandoned all the sites with archived measurement data (e.g. the Schweingruber sites) and adopted a dozen or so recent chronologies, many, if not most, of which lack measurement data archives. It took years of quasi-litigation to get Briffa to reveal details of and to archive the measurement data for Taimyr, Yamal and Tornetrask-Finland datasets, which were only archived because Briffa published an article in a science journal (Phil Trans B) which, because it was not exclusively a climate science journal, took a more stringent attitude on data than The Holocene, Climatic Change or similar climate journals which do not require archiving of data. It is ridiculous that the same situation has arisen all over again with PAGES2K datasets.
There has been considerable disinformation from Real Climate and such about prior availability of Briffa measurement data. For example, the Taimyr regional dataset incorporated some Schweingruber data, but the inclusion of this data was unreported and unknown prior to the archive; it also included much previously unavailable data. The Tornetrask-Finland dataset also incorporated some previous data, but the majority was previously unavailable data. The Yamal regional dataset, unlike the Taimyr dataset, did not include nearby Schweingruber data, though this was even closer than the Schweingruber data included in Taimyr. Despite Briffa et al 2008 claims of constructing regional datasets, its Yamal regional dataset was limited to a very small dataset from Hantemirov 2001, which was unarchived but which I had obtained from Hantemirov before a general fatwa had been pronounced against supplying data to me. Prior to mesaurement data as used in Briffa et al 2008 being disclosed and available, it was impossible to detect the opportunistic inclusion or exclusion of Schweingruber data – a topic which I was writing about at the time of the Climategate hack. A topic that interested the Climategate hacker, who downloaded a considerable amount of interesting Yamal data that had never been disclosed.
you must be new to Climate Audit. The stripbark bristlecone chronologies which give rise to Mann’s hockey stick were originally published by Graybill 1985 (Sheep Mountain) or Graybill and Idso as evidence of CO2 fertilization, with the original authors specifically saying that their growth increase was NOT due to temperature. IPCC AR2 (1995) included a caveat on this sort of problem.
Mann et al 1998 introduced Graybill’s bristlecone chronologies into multiproxy studies despite prior warnings. This was probably his main “contribution” to climate science. Mann et al 1998 not only did not “correct” the bristlecone chronologies for CO2 fertilization, but interpreted the bristlecones as a unique world thermometer.
In Mann et al 1999, he purported to “correct” for CO2 fertilization, but, as Jean S described in CA posts years ago, his “correction” was a fudge, the purpose of which appears to have been to “improve” the verification RE statistic. You can search old CA posts for lots of interesting analysis. Also see discussion in McIntyre and McKitrick (EE 2005) and many CA posts.
Steve,
As a general question, I have often wondered why the Australian mainland is so under-represented in PAGES proxy studies, given the authorship contributions of Australians like Gergis, Karoly. Have you seen references to proxies from here that did not make the grade? My privare, cynical thought is that many proxies have been researched, but overall very few pass the pre-filtering exercises. Geoff.
Geoff, Australia is probably too tropical/subtropical and low-altitude to yield usable proxies. For comparison, look at weak inventory of African proxies. I think that there;s some evidence that proxies can record north-south movement of ITCZ – a phenomenon that appears to be important globally. Now that you mention it, it would be interesting to look at Aus speleothem to see if there’s any info on this that cohere with info elsewhere.
There would appear to be ways to sample trees in the Victorian Highlands and around The Kosciusko area. There is a definite change in the species as the altitude increases suggesting that for some species there is a (probably) temperature related effect. However I believe that even at the summit there are still some trees so not a treeline level effect.
In the nearby NZ record, they have long term records from swamp preserved trees and those are most definitely not high altitude areas.
Where there are trees that have limited distribution that appears to be related to temperature, wouldn’t that be a potential source of data ? For example the NZ records use the Kauri (Agathis Australis) tree and that has a limited distribution confined to the North of the North Island. Possibly the limitation is based on frost effects on saplings so maybe the ring width or density of mature tees may not be useful. The swamp species though are the same and those are in some reconstructions.
In the South there would be treeline examples of various beech species that would be a potential source.
“The swamp species though are the same and those are in some reconstructions.”
That doesn’t mean that they measure temperature. I’ve written in detail on Cook’s Oroko swamp data.
I didn’t mean to imply that the ring widths/densities so collected were a temperature proxy, I was merely commenting that they had been recorded and published. The use of the swamp derived dead trees which are remarkably well preserved gives a much longer series.
My understanding of the distribution of the Kauri trees is that they are limited by the frost sensitivity of the young seedlings, the older trees are less affected. So the distribution of the trees would be a possible proxy for the occurrence of frosts, but it is quite unclear whether the mature trees respond meaningfully to what may be isolated frosts. It takes one good frost to kill a seedling, and that lasts a day, so I doubt it would show in ring widths.
The trees are very slow to spread and because the mature trees can live well over 1,000 years the distribution would be a very coarse and long term proxy at best. You can now find human propagated Kauri growing well South of their natural distribution, if you protect the seedlings or even plant a more mature seedling they will grow reasonably well many hundreds of km South.
There are trees in NZ that grow to the tree line – the Mountain Beech, these would be a possible source for temperature proxies but although there are papers discussing the growth and decline of the species (found in both islands) I haven’t seen a reconstruction of temperature based on it. They seem a fairly short lived tree with 200 years being old, don’t know if that complicates matters.
“Australia is probably too tropical/subtropical and low-altitude to yield usable proxies.”
Would you or anyone else care to explain why the particular tree rings they do measure are good proxy thermometers but ancient trees like Huon Pine in Tasmania are not? I really struggle with the notion that some proxy thermometers are more equal than others but I’m trying to keep up.
Observations,
Tasmanian Huon Pines have been studied and published, but I would claim that there are inadequate instrumental temperature records for calibration. See E R Cook et al and later CSIRO studies. My query was more about mainland Australia. Geoff
what us observed are, for example, ring widths of individual trees. These are not “thermometers” but trees. The term “proxy” is used recklessly by climate academics/
AFAIK Pine trees do not make great material for tree-ring studies of any kind when using the standard sampling method.
The simple reason is that most of these studies use bored horizontal core samples taken from still living or recently living trees, they rarely use full cross-sections, and depending on the type of tree those horizontal samples may or may not be representative for the widths of the tree-rings for each year.
Perhaps you can work around it by using full cross-sections (which requires cutting the tree and then slice a full disc) and then measure the width of the tree-rings by taking a photo and measure the width for each ring at multiple angles (at least dozens, but when using a computer, you may as well do it for each degree, so 360 measurements). And then determine the ring width average and SD…
In the case of Bristle-cone Pine the tree growths in a very erratic manner, which results in rings for the same year with wildly varying width around the circumference of the tree. This means that when you take two samples (same cross-section, same height from ground, but at different angle from core) from the same tree the chances are pretty high that they will fail a similarity match, i.e. too many of the same rings for the same year from the same tree look too different across these two samples. The same has been observed for other types of Pine, although clearly less so.
Logically this also means that single horizontal core samples from Bristle-cone Pine trees are not representative for the actual average width of the rings for each year, they are merely a random sample …
Oak is the best, Pine is more erratic (certainly Bristle-cone). Pine may also have either missing year rings or double rings. But there are even worse types of tree than the average Pine. Apart from Bristle-cone (arguably one of the worst), a good example of a type with problematic rings are Olive trees (see Cherubini et al., 2013, “Olive Tree-Ring Problematic Dating: A Comparative Analysis on Santorini (Greece)”, https://www.ncbi.nlm.nih.gov/pmc/articles/PMC3557290/ just look at figure 1 and imagine taking samples from various angles:
“There were also large discrepancies in the growth-ring numbers among different radii of the same cross-section, even when analyzed by the same expert, and similar differences among experts.”
Which is rather obvious when you look at the figure. It is the rings themselves that differ too much when sampled at different radii, not the eyesight of the expert…).
Tasmanian Huon Pine does not seem to be really a type of Pine tree, but its own family. Just study some cross-sections and check for issues. When it looks mostly nicely regular (like Oak) it can be a good candidate. It looks fine to me from pictures of cross-sections found online (fairly regular rings, more like Oak than like Pine).
And it is being used for these purposes (Nick Fitzgerald, 2014, “Tree Core Research Zones in Tasmania: Spatial Analysis of Rainforest Conifer Species”) and may indeed be usable as climate proxy depending on elevation (Brendan M. Buckley, 1997, “Climate Variability in Tasmania Based on Dendroclimatic Studies of Lagarostrobos Franklinii”).
But a recent study shows more doubt how useful it is as climate proxy (but then AFAIK this is generally true as Steve already noted):
Allen et al., 2014, “Continuing upward trend in Mt Read Huon pine ring widths – Temperature or divergence?”, (https://academiccommons.columbia.edu/doi/10.7916/D8G16BJ9/download).
Jaap, good to see you. You seem to have independently come to many of the same points explored through the years by Steve. I was not here before 2015 but reading the archives I found that Steve went on a field trip back in 2007 to see how hard it was to gather tree ring data in response to Mann’s claim that it was prohibitively expensive to update his hockey stick (bristle-cones and foxtails) favorites.
In doing the field tests Steve came to the hypothesis that the bristle-cones may not have become anomalous due to CO2 fertilization, as had been reported by Graybill and others, but instead the direction of their coring relative to the damaged bark was the problem, I believe. Search Almagre on this site for the full story. He also came to the “Starbucks” hypothesis, which is that one could complete the expedition in a day without missing a morning latte.
It’s just amazing that if climate science had to give up bristle-cones, as directed by the NAS, all of the hockey stick papers, from MBH98 to present, would have to be re-done. https://climateaudit.org/2006/06/29/nas-panel-2-bristlecones/
OT, I hope you can propose doing a guest post on updating the analysis of G2 fingerprints upon the next declassification or report publication.
IN response to JAAP – Good and interesting points regarding tree ring growth characteristics. I recently removed a 30 year old cedar elm ( a species with normal life expectancy of 80-100 years). As a result of JAAP comments and with intriquing curiosity, I looked at the tree rings. – the first observation was that individual tree ring widths varied by as much as 50-70% on the same horizontal plane (horizontal slice) The second observation was that the individual tree ring width would vary 20-30% at different heights of the tree, ( i tried to measure on the same vertical plane of the tree to reduce any bias). The third point is that food and water would be greater factors in a trees growth, with temperature coming in 3rd or 4th place as the most important factor. That being said, I suspect that trying to extrapolate summer temps from the trees rings is dubious.
That would seem to support/justify Stev’s comment “what us observed are, for example, ring widths of individual trees. These are not “thermometers” but trees. The term “proxy” is used recklessly by climate academics/”
Hi Ron,
Well that sure is a problem. But Bristlecone pine has other big problems: bends and twists.
Any tree that bends to one side and then bends back is likely to have compression of rings on one side and expansion of rings on the other. That is an issue that occurs with many tree species, some more than others. How this affects the width of the tree-rings also depends of the species, some are more flexible than others.
Twists can be even worse, then the tree grows in a spiral fashion. The wood grain then usually spirals clockwise up the length of the tree trunk.
Now combine this with bending (and a few limbs of various sizes) and you quickly get crooked, gnarled growth.
The issue is that the width of the rings then becomes highly irregular and rather meaningless. Meaningless for estimating the well-being of the tree in that year. Say it was was great, but the tree decided to twist a bit, which compressed the rings, so the end result is a much narrower ring.
Problematic for use as a climate proxy but also very problematic when we try to match wood samples from several trees in order to create a chronology.
Certainly when you uses horizontal core samples (as is common) instead of cutting down the tree and tacking a full cross section.
When the width of the rings becomes dependent on how we take the sample (from what angle), then obviously we will not be able to make the correct match.
Say we have two trees A & B with 5 rings according to our bored core samples: {10,2,4,12,11} and {2,8,4,5,10}, then do these match? No they do not.
But these can represent the exact same sequence of years. Some other tree (C) of the same species in the same area was more well-behaved and has {6,5,4,8,10}. Tree A has an expansion (on the side where the core sample was taken) for year 1, and Tree B has a compression for the same year, etc…
Well it could take a bit more time when you know the above… That is assuming you are interested to get a ‘good’ representative sample.
Imagine: you get to your first candidate. But you see that lot’s of bark missing on one side. And you can actually see holes at several places… OK, not a good one. Next.
Candidate number two has been doing the limbo and then swooped back up, and then did it again. Then twirled and twisted a few times. Looks like a bonsai tree, but then large. Hmmmm. Next.
Candidate three has some bends, but did bend back and has several straight sections. OK where to take a sample? Not near any tree limbs, not in any bend section. OK here is a spot: tree is vertical, nice. Oh dear, the bark seems to have a spiral twist. Next.
Let’s be realistic. What if your average Bristlecone Pine looks like this: http://internationaltreefoundation.org/wp-content/uploads/2016/10/5.jpg or like this https://upload.wikimedia.org/wikipedia/commons/thumb/1/1e/Gnarly_Bristlecone_Pine.jpg/1280px-Gnarly_Bristlecone_Pine.jpg
How do you take a good core sample of that?
Sure we can get a core sample and be back to base quick enough, but obviously that sample can’t be meaningful.
I think the cure-all in dendro is tossing out any bad samples, studies or groups of studies. Only when data has passed all have the most stringent “quality” tests will it be used to tell us what we want to know.
Yep, starting with bristlecone pine. There is a big need to educate people. Most people (in various fields) are totally unaware that there is an issue and are often oblivious to how bad it really is.
Maybe the answer is for scientists and engineers from various fields to peek into fields outside their own for fresh perspectives. The result would be hopefully alarming enough to place pressure on the Royal Society, NAS and the like to assert the a universal protocol of adversarial review. Imagine if the IPCC were a skeptical body the same way the US Food and Drug administration is to industry claims, instead of a corrupting influence, as revealed by the climategate emails. https://climateaudit.org/2009/12/10/ipcc-and-the-trick/
As it stands, there seems to be only a wink at the NAS as their proscription against the use of Bristlecone and Foxtail pines. But the proscription should have been followed by studies to determine conclusively specific causes of failure. A method, any method, needs to be debunked and pass real tests of externally imposed standards.
The one point in which climate consensus believers and skeptics alike can agree is the field should not be relying on blog posts of retired engineers and statisticians for its adversarial review.
The issues with high altitude pine tree ring width as Jaap described so crystal clear above can be understood by any farmer, so also any objective scientist. That climate science still uses these wooden crutches to support their temperature hockey sticks speaks volumes about its health.
It is only those who want to get to a pre-desired outcome who are not looking for measurement problems. Ideology and funding should not determine scientific results.
Worth the price of admission for Clapton and Velvet Underground alone. Now if you can just devise an acid reference, you could add Jefferson Airplane’s “Rejoyce” – https://www.youtube.com/watch?v=lscRNsyEzs4&fbclid=IwAR3ziuP7c2ZSo0ofyoGuB3NoGqoVjMTdOcqA_UQCRL9scGyKco7FofyrowM
in the comments to the earlier article, I included a Jefferson Airplane, in which I pointed out Grace Slick’s “early consideration of principal components and RegEM” and unimportance of data which was nothing more than white noise – the latter issue being a primary topic of the present post. I observed:
This was, of course, a commentary on Slick et al (1975) which stated:
The last clause neatly describes the ragtag collection of North American tree ring proxies so beloved of Mann and PAGES2K.
Original here

Minor correction, for the sake of accuracy.
“And the pill that mother gave you doesn’t do anything at all.”
The actual line is, from memory, “And the ones that mother gives you, don’t do anything at all.” A distinction without a difference, perhaps. 🙂
Minor proofread, no end to this sentence: “there is so much noise in the data in the network shown in the right panel that there is no HS even”.
Great piece, thanks for putting your time in on this. A peculiar enterprise indeed — but necessary.
Steve and others,
For many years I have been troubled by the inadequacy of the conventional correlation coefficient as a measure of how well groups of numbers match. Cut to the chase, I have been seeking a method that detrends the ‘general shape of response’ to leave the ‘features worth searching for correlations.’ The weakness of the unsophisticated correlation coefficient approach is shown by the presence of a journal, “The Journal of Spurious Correlations.”
Correlation coefficients were used widely in these PAGES exercises for screening. Another climate related use is for comparing weather station data from sites distant from each other, as in this BEST example http://www.geoffstuff.com/BEST_correlation.jpg
All here know that a very high correlation coefficient can exist between two straight, featureless data lines, which alludes to my description above of ‘general shape of the response’ and the need to detrend.
When the data are not featureless, there is also the exhortation by statistician W M Briggs ‘Now I’m going to tell you the great truth of time series analysis. Ready? Unless the data is measured with error, you never, ever, for no reason, under no threat, SMOOTH the series! And if for some bizarre reason you do smooth it, you absolutely on pain of death do NOT use the smoothed series as input for other analyses!’ http://wmbriggs.com/post/195/
So the question is, apart from customary detrending, smoothing, rejection of outliers etc., is there a statistical process other than the various forms of correlation coefficient calculation than might better extract the key information in (say) the BEST example shown above? Sorry for the diversion, if it is. Geoff.
Geoff: In the stock market (lots of noise there), analysts calculate alpha from a plot of all monthly or quarterly changes in one investment vs. an index of similar investments, say the stocks picked by a large cap mutual fund vs. the S&P 500. Since riskier stocks shift up and down much more than stable ones, it can be hard to tell if outperformance in any period is due to risky stocks or to picking superior stocks in the long run. Alpha is one tool used to address this problem
Since tree rings are supposed to be an annual proxy for summer temperature, I think a plot of the change in TRW vs the change in summer temperature from year to year could be more informative than the correlation coefficient. At any single location, the mean summer temperature varies from year to year by an average of 1 K. Climate change is slow and small in amplitude, seasonal weather has much larger changes from year to year. If TRW are a good proxy for temperature, year to year change may be the right place to look.
There is probably a way to use a filter to separate high frequency variability in TRW from signals that represent slower changes.
There are hundreds of thousands like me who are deeply grateful for the prodigious work you have done over the years to expose the massive inaccuracies in the claims of Michael “Piltdown” Mann and his cabal of frauds.
Today: Climate contrarian uncovers scientific error, upends major ocean warming study https://www.sandiegouniontribune.com/news/environment/sd-me-climate-study-error-20181113-story.html
Congrats Nic Lewis, frequent guest author here.
Also congrats Ralph Keeling for accepting Nic’s insight like a real man and Scientist, publicly.
Micheal Mann’s reaction to this news:
“We have to just call it as we see it, do good science, put it out there, defend it and, when necessary, correct it. That’s the legitimate scientific process, and it stands in stark contrast to the tactics employed by the forces of pseudoscience and antiscience,”
http://www.sciencemag.org/news/2018/11/high-profile-ocean-warming-paper-get-correction
If only he would have practiced what he preaches now!!
Again, massive thanks to Steve and the various other folk keeping the facts coming and uncovering the dogma and “faith”.
I happily class myself as a skeptic in this area of hysteria and many others being peddled to us.
Just re-watched Errol Morris film “The Unknown Knowns” and I can see amusing parallels between Rumsfeld and Mann et. al. as well as Mr. Gore’s foray from several years ago.
Never let good science and robust analysis get in the way of mass hysteria. WMD (no-one heard of Hans Blix?), Climate Change (4.5 billions years of climate change never hurt anyone), Diesel killing us, everyone dying of poverty (love Stephen Pinker’s Enlightenment Now, even if his CC chapter breaks all his methodology (anyone else notice that?)).
All now so ably abetted by the wonderful world of instant knee jerk judgement on Tittle-Tattle, aka the Twitsphere (ooh did I miss a couple of letters out there?).
Steve, I am sure it is getting very wearing after all these years, but try to keep rocking.
I am trying a few of my own inadequate attempts to counter some of the twaddle on my own web-site (http://www.mm1ltd.co.uk) and trying to look at some per-historical proxy data correlations, so sort of coming at it from some pretty graphs. It makes interesting viewing, even if the data granularity I have found is not top-notch.
JC
The historical proxies aren’t proxies, Jacqueline. They have no known physical connection to air temperature.
I’ve discussed the problem extensively in this post at Watts Up With That.
Other relevant links: WaPo https://www.washingtonpost.com/energy-environment/2018/11/14/scientists-acknowledge-key-errors-study-how-fast-oceans-are-warming/?utm_term=.f78a99f4f0ee
Some discussion here: http://www.realclimate.org/index.php/archives/2018/11/resplandy-et-al-correction-and-response/
Nic Lewis posted a public reply to the planned correction by one of the authors revealed only on public RC : at Judith Curry’s
Keeling & co still didn’t publish the computer code they used.
Peer review: too many Emperors without cloths.
“Secret peer review is dead, long live public Blog audit”.
OT: Steve, in light of today’s Twitter exchange on data withholding and data obstruction in the CliSci “community” perhaps you could write or list a history of highlights (lowlights) of your experiences. Otherwise, this “official” view of the saintly truth-seekers in the “climate science community” will stand uncorrected. Apologies if this idea is more than you wish to undertake now…..
Data withholding and data obstruction in the CliSci “community” was rampant, but here is another another level of obstruction: your “boss” sneakily withdrawing an article you submitted only because of its inconvenient conclusions. https://rclutz.wordpress.com/2017/05/17/the-curious-case-of-dr-miskolczi/
Another example (if needed) of “consensus” Science delaying an important discovery: C4 photosynthesis research publication was “discouraged” by one C3 discoverer (and later Nobel prize recipient) Melvin Calvin since 1961
Click to access Part1_Hatch.pdf
The science of Genetics today also suffers from a con-census fiercely maintained by a politically correct majority: https://quillette.com/2018/12/11/progressive-creationism-a-review-of-a-dangerous-idea/
Warning: Off topic:
Steve, is there any chance of a book from your hand to sum up Your Endeavours in climate auditing? I know that most of it is available here at Climate Audit, and I have read the excellent Hockey Stick Illusion by Montford, but a full account from Your perspective in the context of the climate wars would be invaluable.
I think it’s more important that Steve sits down with a chosen one or two people, and teaches them, in depth, how he thinks, how he digs, and what he knows.
We cannot do without what Steve does
Passing on deep knowledge, fruits of deep experience, feedback, essence of natural evolution and of civilization.
spot on folks.
I have been in IT for nearly 40 years. We learnt from the masters and they were experts. The current generation are not being taught to listen to experience and that deep knowledge is being lost.
Anyone in the UK will probably know of the recent TSB disaster, earlier British Airways booking failures etc. These are all the ultimate result of failure to educate and mentor the next generation.
From The American Statistician Volume 73, 2019:
Moving to a World Beyond “p < 0.05”
Coup de Grâce for a Tough Old Bull: “Statistically Significant” Expires
Any comments from our statistically minded?
23 Trackbacks
[…] READ THE ENTIRE ESSAY HERE […]
[…] READ THE ENTIRE ESSAY HERE […]
[…] READ THE ENTIRE ESSAY HERE […]
[…] READ THE ENTIRE ESSAY HERE […]
[…] through a fellow named Steve McIntyre, who has busted every of Mann’s papers. He has a must-read article that slices the guts out of Mann’s outdated and new papers. Here’s the bit about the […]
[…] PAGES2K: North American Tree Ring Proxies […]
[…] A new gem from Steve McIntyre: New post at Climate Audit on North American tree ring network of PAGES2K (2013) and PAGES (2017). Bristlecone addiction continues unabated -heroin for paleoclimatologists. [link] […]
[…] https://climateaudit.org/2018/10/24/pages2k-north-american-tree-ring-proxies/ […]
[…] The authors rely on the major published temperature reconstructions. From up in the peanut gallery, it looks to me that Steve McInyre’s criticism of them are devastating and disqualify them for use in setting public policy goals. See his posts on the latest reconstruction here and here. […]
[…] The authors rely on the major published temperature reconstructions. From up in the peanut gallery, it looks to me that Steve McInyre’s criticism of them are devastating and disqualify them for use in setting public policy goals. See his posts on the latest reconstruction here and here. […]
[…] The authors depend on the most important revealed temperature reconstructions. From up within the peanut gallery, it appears to be like to me that Steve McInyre’s criticism of them are devastating and disqualify them to be used in setting public coverage objectives. See his posts on the most recent reconstruction right here and right here. […]
[…] it lets in things like the Hockeystick paper and the numerous “Stick-alikes” despite them being laughably bad […]
[…] it lets in things like the Hockeystick paper and the numerous “Stick-alikes” despite them being laughably bad […]
[…] it lets in things like the Hockeystick paper and the numerous “Stick-alikes” despite them being laughably bad […]
[…] on the topic of ‘fixing it’, I must mention Steve McIntyre’s latest post PAGES2K: North American Tree Ring Proxies. I have long declared CE to be a tree-ring free zone, basically because I have not really delved […]
[…] Man hat Dinge wie die Hockeyschläger-Studie und die zahlreichen „Stick-alikes” veröffentlicht, obwohl es sich dabei um eklatant schlechte Wissenschaft handelt [laughably bad […]
[…] on the topic of ‘fixing it’, I must mention Steve McIntyre’s latest post PAGES2K: North American Tree Ring Proxies. I have long declared CE to be a tree-ring free zone, basically because I have not really delved […]
[…] on the topic of ‘fixing it’, I must mention Steve McIntyre’s latest post PAGES2K: North American Tree Ring Proxies. I have long declared CE to be a tree-ring free zone, basically because I have not really delved […]
[…] it lets in things like the Hockeystick paper and the numerous “Stick-alikes” despite them being laughably bad […]
[…] Apart from Steve McIntyre’s takedown of Mann et al. 2008 and PAGES 2K Consortium (for the latest, see PAGES2K: North American Tree Ring Proxies), how can you ‘square’ high confidence with “there are still many uncertainties […]
[…] Apart from Steve McIntyre’s takedown of Mann et al. 2008 and PAGES 2K Consortium (for the latest, see PAGES2K: North American Tree Ring Proxies), how can you ‘square’ high confidence with “there are still many uncertainties […]
[…] dissonance. Apart from Steve McIntyre’s takedown of Mann et al. 2008 and PAGES 2K Consortium (for the latest, see PAGES2K: North American Tree Ring Proxies), how can you ‘square’ high confidence with “there are still many uncertainties in […]
[…] dissonance. Apart from Steve McIntyre’s takedown of Mann et al. 2008 and the PAGES 2K Consortium (for the latest, see PAGES2K: North American Tree Ring Proxies), how can you ‘square’ high confidence with “there are still many uncertainties in […]