About 20% of the PAGES 2019 proxies are 50 Asian tree ring chronologies, all of which were originally published as chronologies in PAGES (2013). At the time, none of these series (and certainly not in these digital versions, had ever been published in technical literature, peer reviewed or otherwise. Nothing in the Supplementary Information to any of these articles says who calculated these chronologies or how they were calculated. PAGES (2017) does cite a couple of academic articles (especially Cook et al 2013) for many of these series, but none of these chronologies actually appears in any of these academic articles or their supplementary information.
PAGES (2013) was originally rejected by Science in 2012, because peer reviewers (including Michael Mann) objected to the introduction of so many new proxies in what was ostensibly a review paper; they sensibly recommended that components first be peer reviewed in relevant specialist journals. However, PAGES2K results had already been incorporated into a pending IPCC assessment (AR5), so the authors, now under a very short deadline, submitted to Nature, which was confronted by the same review problems that led to the rejection by Science. Keith Briffa had a clever, too clever, solution: publish the PAGES2K submission as a “Progress Article” – a classification that did not require the peer review procedure required for a Research Article. This would qualify the article for IPCC and nobody would notice the sleight-of-hand. (Even I didn’t notice it at the time; someone told me.)
One of the consequences of the 2013 manoeuvring was that several hundred Asian tree ring chronologies were introduced to paleoclimate archives with no technical publication or technical peer review, no information on how they were calculated or even who among the PAGES2K (2013) authors had calculated them.
Having been introduced through the back door, so to speak, nearly all of the 200+ Asian tree ring chronologies were carried forward into the PAGES (2017) compilation, and then a subset of 50 chronologies (more or less the most hockey stick shaped) was screened to become a substantial component of PAGES (2019) – the source of the IPCC Summary for Policy-makers Hockey Stick.
In an earlier post (https://x.com/ClimateAudit/status/1161422058347089920), I had commented on the extreme closing uptick in one of these series (Asia_207). In 2013, despite PAGES2K’s professed insistence on using proxies with public archives, measurement data for this chronology was not available, so it was impossible to see what was going on at the time.

In the SI to PAGES (2017), the data is cited to the site denoted by NOAA as paki033, a site located in a mountainous region in northern Pakistan near Gilgit. As a short editorial digression, I visited Gilgit briefly in 1968 and was there when we learned, via shortwave radio, that Bobby Kennedy had been assassinated. Twenty years later (1988), Osama bin Laden, then a CIA protege, announced himself by slaughtering the Shia population of Gilgit. (In today’s US intel nomenclature, since they were Shia, the murdered Shia would presumably be labeled as “Iran-backed” as though that were both justification and sufficient explanation.)
But back to main programming.
Measurement Data and Chronology Construction
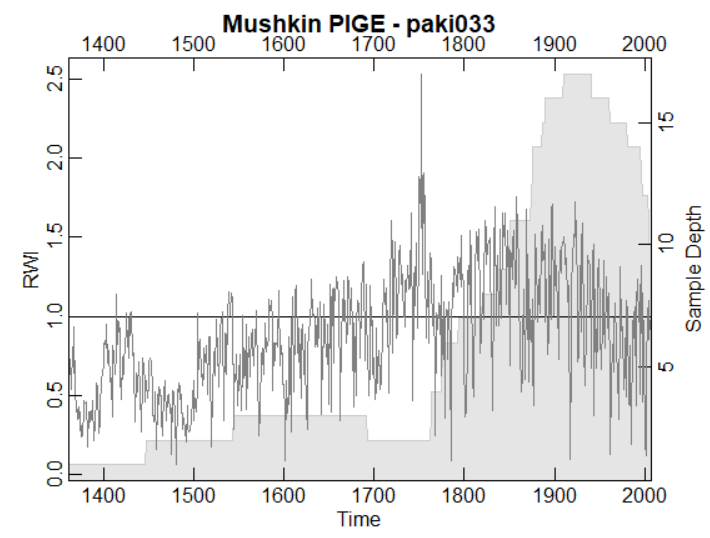
From the measurement data for paki033.rwl at NOAA, I calculated a site chronology using the rcs function from Andy Bunn’s dplR package. The resulting chronology does NOT have the huge uptick of PAGES2019 – indeed it declines over the 20th century. (Diagram below used dplR function – see script below).
Code for this diagram is as follows:
library(dplR)
loc=”https://www.ncei.noaa.gov/pub/data/paleo/treering/measurements/asia/paki033.rwl”
download.file(loc,”e:/temp/temp.rwl”)
rwl=read.rwl(“e:/temp/temp.rwl”)
Po=data.frame(series=names(rwl),po=1)
rwi=rcs(rwl,po=Po) #646 18
crn=chron(rwi, prefix = “033”)
plot(crn,main=”Mushkin PIGE – paki033″)
I got an almost identical chronology by fitting a single Hugershoff curve (rw = A+B* (x^D)*exp(-C*x) to allow for growth prior to chronology calculation.
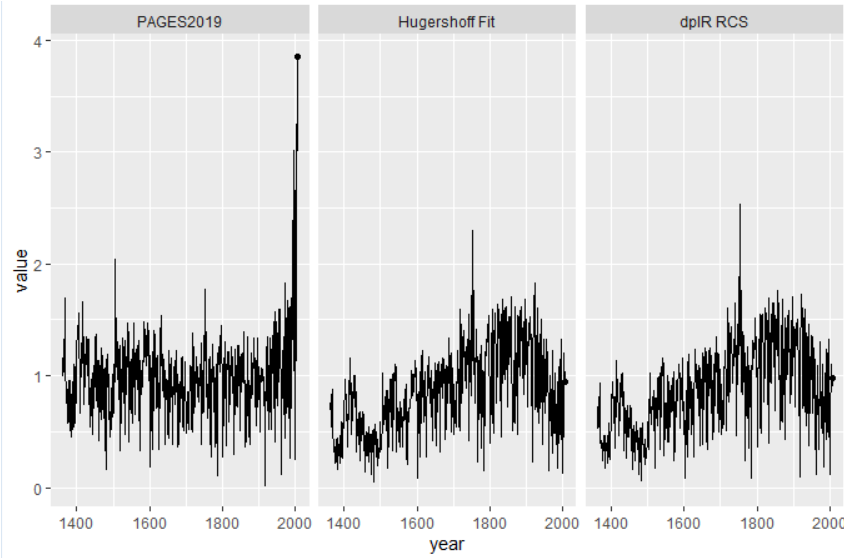
An observation here: although the overall appearance of the chronologies is very different, there is a high correlation (~0.5) between the PAGES version and the other versions – that high a correlation strongly indicates to me that they are representing the same data. (Also the start and end dates of the PAGES2K version exactly match the measurement data.)
What could possibly account for the huge uptick in the PAGES version? It turns out that the paki033 dataset consists of only 10 trees (18 cores). Only two of the trees are dated prior to the 18th century – well below usual minimums for calculating a chronology. Only 6 trees have cores extending to the last year (2007). This is a very small total – indeed, so small that it’s possible to plot actual measurements for all 6 trees very easily so we can look for ourselves at what’s going on.
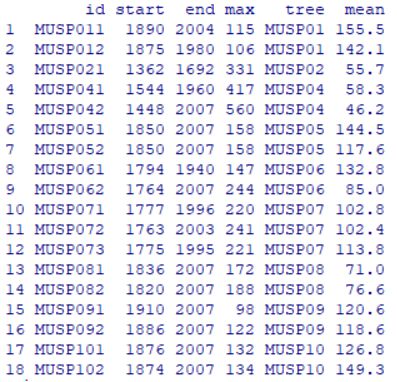
Here is a plot of actual measurements for the two cores from each of six trees for the period 1700-2007. One tree (MUSP04) is relatively old and slow-growing. Most of the trees were relatively young (dating from 19th century) and showed characteristic decline in measured ring width as the tree got older (and diameter increased.) Nothing in this data shows an upspike in 2007.

So who calculated the Asia_207 chronology? And how was it calculated?
At the time (2013), Briffa and Melvin of the University of East Anglia were hyping a method that they called “signal-free” tree ring chronology calculation, which, in the examples that they showed, resulted in a more HS-shaped chronology than produced by ordinary chronology. It’s possible that the PAGES2K chronology was produced with some variation of this method. Melvin’s article does not provide a clear description of the mathematical procedure in their algorithm. They used ugly Fortran code that might be possible to figure out. But it takes time to parse this stuff and, without knowing for sure that this technique was used in PAGES2K, I’ve got other things to do.
But, even if the chronology calculation can be determined to be Melvin’s method (or some equivalent), this example ought to raise serious issues about the validity of the method- whatever it was. There is nothing in the actual ring width measurements that justifies the huge upspike in the archived PAGES2K Asia_207 chronology. The implication is that there is something wrong with the chronology algorithm used by PAGES2K (2013) authors. If so, the defect would affect not just the Asia_207 chronology, but a vast swathe of other PAGES2K chronologies relied upon in the IPCC diagram. I checked a couple of others and was unable to replicate them either.
As a caveat, I’m not saying that “everything” in the IPCC diagram stands or falls with this particular issue. There are many issues with this diagram – I listed many in my first post on this topic and am aware of many aware. It’s possible that I’ve overlooked something. If a possible error in this analysis is identified, I’ll promptly evaluate and amend if required.


33 Comments
Statement in article above – “In the SI to PAGES (2017), the data is cited to the site denoted by NOAA as paki033, a site located in a mountainous region in northern Pakistan near Gilgit.”
I recall one to two years ago, a Comment by Steve M, that there were two proxies from two locations very close to the other ( or one proxie with two different versions ) whereby one of the Paki proxies showed 20th century warming and the other version had little or no warming.
Can anyone give me some clarification on this
Thanks
clarifying my question. The location of the 2 proxies were in pakistan.
If the proxy data used to get the HS does not show the uptick then we have the “hide the decline” deception all over again. Moreover, if the proxy data does not show the observed uptick then it may well not show the MWP and Roman warm period either. It would be shown to be insensitive to temperature (which is likely).
As I read the IPCC graphic the uptick is labeled “observed” not as part of the proxy summation. Where is the claim that the uptick shown is part of the proxy synthesis?
BTW Steve, you earlier said you could not find this graph in the main AR6 WG1 report. Is that still so? It would be an incredible deception to find Figure 1a in the SUMMARY not in that which is summarized!
Re the proxy uptick claim, I now see the blue line under the black observed line. The exact match is very suspicious as proxies are not that accurate.
my current theory on the closeness of the match is that it arises from correlation-weighting of a large network of prescreened proxies all screened to have upward trend. CWeight by correlation screening is a form of ridge regression which, under the circumstances of prescreening, appears to lead to an overfitting of a type usually associated with overfitted ILS model. Perfect fit in calibration period but no predictive value.
Thanks Steve. Would it be correct to describe this as cherry picked then heavily adjusted?
Some of the “screened” proxies, i.e. the proxies used, could themselves be data-cropped to hide no-inclines in recent years. PAGES did that before.
Steve – “I listed many in my first post on this topic and am aware of many aware” ?
delete my post when fixed
“At the time (2013), Briffa and Melvin of the University of East Anglia were hyping a method that they called “signal-free” tree ring chronology calculation, which, in the examples that they showed, resulted in a more HS-shaped chronology than produced by ordinary chronology.”
any links – can’t find any myself
forget my last comment
found this – https://www.researchgate.net/publication/235665626_A_Signal-Free_approach_to_dendroclimatic_Standardization
partial quote from above – “The term “signal-free” refers to the creation of detrending curves that do not contain the common signals shared across the trees in a chronology, and are thus ‘free’ from common variance and should preserve this signal in the resulting chronology”
clever people at UEA – I almost understand what they are saying!!!
I’m aware of and have read these articles. However, saying and doing are two different things. What is the exact algorithm expressed mathematically? And what are its properties as an algorithm?
Hi Steve – hope you & family are ok.
I tried to download/access the above paper with links given, but no luck !!!
so – are they saying “one good tree (which they deem good) is all that’s needed :
Steve: Is anyone likely to follow up the issues you have raised? Will these chronologies be simply left without review to taint later work and compilations?
Nothing is likely to be done.
So Trofim Lysenko is alive and well!! 😦
There’s not a chance that anybody linked to the IPCC will follow this up.
As we get closer & closer, to Carry on Partying 26, we’ll see more & more of this in the MSM, “proving” that Mann’s Hookey Hockey Stick was “correct”, along with every bush fire and bit of “Extreme Weather” going.
Thanks as always, well done.
w.
18 total? Can you plot the other 6? thanks!
Obama -> Osama?
Jeez. There isn’t even a “One Tree” (re: Yamal) to rule this one. To my eye, it looks like they just made it up.
It sounds like if they had prescreened for the MWP they could have found that too! Right?
Not my idea of science.
Ugly FORTRAN? Hey, we used to say, we went to the moon and back with FORTRAN! Hahaha
Words fail me for what the Team was doing with the Asian trees.
An interesting recent comment from Roger Pielke Snr at Judith Curry’s blog and his link. He is referring to IPCC AR6 and he provides a link .
The period he refers to is 3.5 decades ( 1979 to 2014) and that would be an extra warming of 0.35 c ( at least ) over that time. Or perhaps another 1.0 c of make believe warming in the next 100 years?
So is Dr Pielke Snr correct? And does anyone here have any comments? Over to Dr Pielke Snr.
“Roger Pielke Sr | August 10, 2021 at 9:55 am | Reply
“we assess with medium confidence that CMIP5 and CMIP6 models continue to overestimate observed warming in the upper tropical troposphere over the 1979-2014 period by at least 0.1°C per decade, in part because of an overestimate of the tropical SST trend pattern over this period.”
From
Click to access IPCC_AR6_WGI_Full_Report.pdf
“If SSTs are overestimated, global sfc air T would be overestimated by this amount”.
Nick MxKay of PAGES2019 provided cordial response on Twitter to inquiry on provenance of Mushkin chronology. He didn’t know. He wrote
“The metadata for that site point to https://ncdc.noaa.gov/paleo-search/study/15330, which has the raw data for that site, I believe. I don’t know the details of how the record was created or detrended, nor who did that work, although I assume it was one of the authors listed on that site.,,,
·
Improving the traceability and reproducibility of datasets like this is one of our goals, but as you can see, this hasn’t always been done well, especially in years past. ”
It is obviously disquieting that supposedly extensive quality control of PAGES2K did not include determination of who calculated chronologies and how they were calculated for 20^ of data in PAGES2019 and more like 33% of PAGES2017.
PAGES honoured its group title by producing thousands of pages plus thousands of corrections to hide their lack of quality data. That much they learned from their employers, the bureaucrats. The IPCC followed with their 4000 pages / printed 40 cm thick ‘report’.
Try to find “The” few tree data in that huge forest that exceptionally showed an hockey blade uptake the last decades: better hidden than earlier few favorite Siberian Yamal trees.
IF any accurate data would have solidly supported their Scare Story they would have prominently showed them off front page.
The length of a just-submitted comment may have consigned it to the Spam folder.
I was directing readers’ attention to the recent post Evidence of Fraud in an Influential Field Experiment About Dishonesty, at the DataColata blog.
The final three paragraphs are germane to Climate Audit. “There will never be a perfect solution [to scientific fraud], but there is an obvious step to take: Data should be posted. The fabrication in this paper was discovered because the data were posted… There is really no excuse. All of our journals should require data posting.”
Concluding line: “A field that ignores the problem of fraud, or pretends that it does not exist, risks losing its credibility. And deservedly so.”
I’m pleased to see that post-hoc subgroup analysis remains a valued technique in paleoclimate reconstruction.
Unfortunately, p-hacking is garnering more brickbats than plaudits in other contexts.
Here is “C_B” commenting at Scott Alexander’s blog on the FDA’s rationale for approving the likely-ineffective Alzheimer’s drug aducanumab:
PAGES has much to teach the broader scientific community.
Reblogged this on Climate Collections.
Steve,
There could be a big picture arsing from your numerous examples of questionable climate research. So, I am floating a concept to see if you had already thought of it, or if you and others here agree or disagree.
The core idea is that too much climate research is used before it is completed. Or, put another way, too much research has been presented before the authors have dug deep enough into the detail to validate or invalidate it.
A lot of your work in CA has put the research of others under a magnifier. You have often shown that the purported final analysis by the authors is wrong when studied more deeply. For example, you have often recommended that a deeper level of statistical skill was needed, a finding supported by the Wegman report. You might have been motivated from the start by knowing that the Devil can be in the detail, or you might have started hunting because of a completely different set of drivers – I simply do not know. (My own hunting was started in 1992 by a blatant example of cherry picking of temperature observations. I had not run into it in other branches of science.)
If it is indeed a valid generalization that climate research would benefit by deeper, more detailed study before the rush to publish, the next question arises: How can that observation be translated into beneficial action? Do we need extra modules in undergraduate teaching? Do we need paths to knowledge different to the publish or perish? Or wider ownership and control of scientific journals?
The rate at which poor climate science has moved toward becoming the new normal is disturbing. Maybe the momentum is large enough to make substantial changes impossible for now, so these concepts of deeper studies are already beyond improvement.
I am, however, quite sure that change will happen on a large and rapid scale once there is realisation that the outcomes of a lot of climate research are not settled and are in many cases harmful. That is, nothing has caused me to stop my criticisms because they have been shown to be wrong. To the contrary, the more events I study, the more I find them to unravel with deeper, more detailed study.
Colleague Bill Johnston on his bomwatch blog has just uncovered another good example. He unearthed observations from a scientific expedition by ship through the Great Barrier Reef in 1871, with measured sea surface temperatures not significantly different to those of today. It is easier to postulate that there has been no sea warming to harm the Reef with such extra, detailed study that the authorities might have missed.
Geoff S
Geoff:
Bill Johnston site is very interesting. Do you know if he has had some statisticians look at his statistical approach. It looks to me, but I am no expert, that he is using a form of hierarchical regression. My experience is that unless your independent variables are indeed independent of each other, the results are pretty unstable and very dependent on the order of entry.
Bernie1815,
Although I helped Bill Johnston a little with this work, the stats are his. He has answered you on WUWT
I note that Peter Ridd has also commented there
“Bill Johnston’s report is well worth looking at, and very comprehensive. He has gone to a lot of effort to analyze the Great Barrier Reef instrumental temperature data so that he can put the “new” older data into context.
Peter Ridd”
However, the thrust of the present matter is Steve’s work on the IPCC AR6 and the PASGES quality of work, which is much broader and rather serious. Geoff S
Geoff: Thanks for the reply. I genuinely admire all who have pursued these issues and have pulled together fresh or overlooked data. I think Bill Johnston’s case would be greatly strengthened with the input of somebody who understands the strengths and limitations of regression analysis. I am not saying anything different to what Steve has said on numerous occasions.
91, 92 and 61 are time reversed or all are. Voila!
2 Trackbacks
[…] runs the blog Climate Audit, and the two articles I cite are titled The IPCC AR6 Hockeystick, and PAGES19 Asian Tree Ring Chronologies. Both are technical challenges for the lay person. I slogged through them and gleaned important […]
[…] PAGES19 Asian Tree Ring Chronologies […]