The 30-60N latitude band gets lots of attention in paleoclimate collections – probably more proxies than the rest of the world combined. The 30-60S latitude band is exactly the same size, but it is little studied. It is the world of the Roaring Forties and Furious Fifties, a world that is almost entirely ocean. The only land is New Zealand, Tasmania and the southern coast of Australia facing Antarctica, the tip of South Africa and the narrow part of South America: southern Chile and Argentina. But 96% or so is ocean.

No Ocean Proxies
Although the 60-30S is almost entirely ocean, PAGES 2019 did not use a single ocean proxy in its data. They used only eight series (out of 19 PAGES 2017). Seven tree ring series: two from New Zealand (both less than 500 years), three from Tasmania (one long, two less than 500 years), two from southern South America (both less than 500 years) and one weird lake sediment from Chile (a “singleton” proxy using pigments in the sediments).
Only One Long Proxy
Only one proxy in the network has values prior to AD750 and only two proxies have values prior to AD1450. Thus, the only information directly comparing medieval and modern values comes from these two proxies: Mt Read, Tasmania (a series used as long ago as Mann et al 1998 and Jones et al 1998) and many times since and the Laguna Aculeo pigment series – neither of which have shapes remotely similar to the PAGES2K 60-30S latband reconstruction – see below. (The latband reconstruction was calculated from the enormous file at NOAA here).
Take a look at the underlying data (converted to SD Units) – more commentary below.
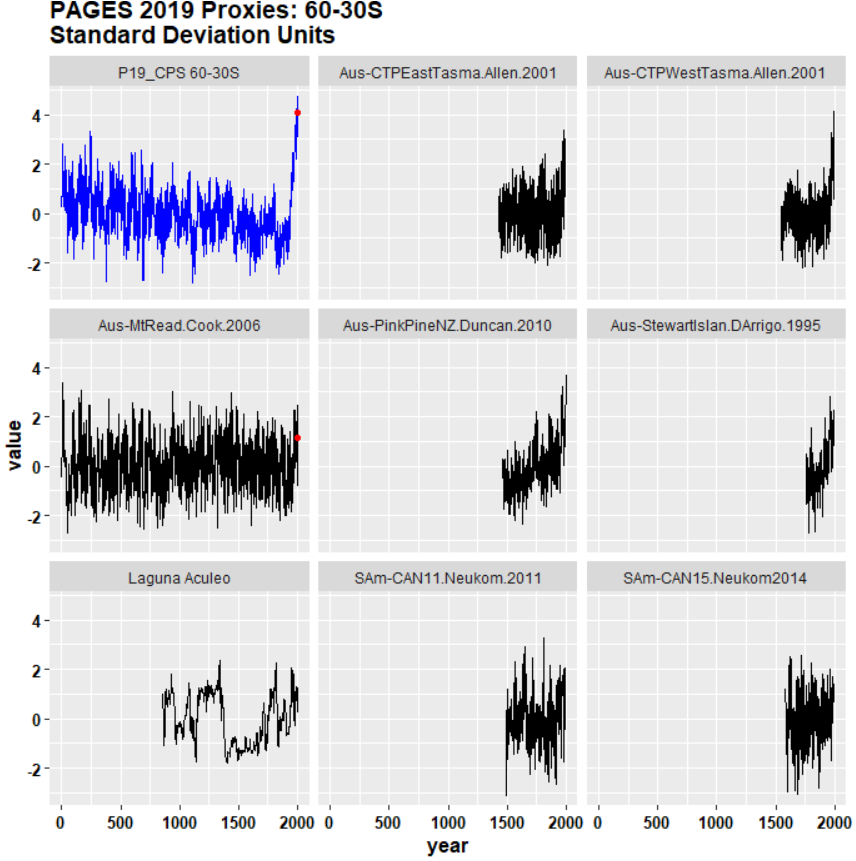
Comments on the PAGES 60-30S HS
Quite aside from many issues about the PAGES2019 selection of 60-30S proxies, obvious questions arise about how they derived their latband reconstruction.
- the blade of the reconstruction HS goes from -1 sigma in early 20th century to more than 4 sigma in 2000. Yet there is no comparable deviation in any of the underlying proxies. The three South American proxies and the long Mt Read, Tasmania tree ring chronology don’t have anything like a blade; the four short tree ring chronologies (two Tasmania and two New Zealand) have increase sharply in 20th century, but not enough to yield the PAGES 2019 HS. (These tree chronologies have been selected from a much larger candidate populaion – a screening process that already imparts a serious bias.)
- the only 30-60S proxy with a value in the year 2000 is Mount Read, which has a value of ~1 sigma. Yet the PAGES 2019 30-60S (CPS) reconstruction has a value of over 4 sigma. How did they do that?
- PAGES 2019 provide code for the generation of figures from reconstructions, but didn’t archive the code for the generation of the reconstructions. (At least in the links provided in any of the articles.) So it’s impossible to precisely diagnose what’s going on.
- although PAGES proclaim the importance of public archiving as a selection criterion, only one of the tree ring chronologies (the long Mount Read chronology) can be firmly associated with ITRDB measurement data archives. Both South American tree ring chronologies derive from lead author Neukom’s calculation on unarchived South American data. D’Arrigo’s 1995 data remains unarchived, as does the Duncan New Zealand data. At the time of the PAGES 2013 publication of the two Allen tree ring chronologies from Tasmania, no relevant measurement data was archived; since then, Allen has archived measurement data from Tasmania, but PAGES 2019 doesn’t contain any citation.
- the Laguna Aculeo series is a purported temperature reconstruction from pigments. At present, there are no other similar temperature reconstructions, leaving this series as a sort of ad hoc singleton.
High-Resolution Ocean Proxies
But most of all, given that the 60-30S latband is almost entirely (~96%) ocean, it seems bizarre that PAGES 2019 did not use any ocean core proxies, especially since there are physical formulas for estimating SST from alkenone or Mg/Ca measurements. Any conversion of tree ring widths to temperature in deg C is the result of ad hoc statistical fitting, not a universal formula. Alkenone values have been measured all over the modern ocean and nicely fit known ocean temperatures. In addition, alkenone values for ocean cores going back to deeper time (even to the Miocene) give a consistent and reproducible narrative. So there’s a lot to like about them as a candidate for a “good” proxy.
While there are numerous high-resolution (10 year resolution) alkenone and Mg/Ca measurements in the North Atlantic with values through the last millennium and up to the present, to my knowledge, there were not any such series as of PAGES 2013 or PAGES 2017. (In my opinion, IPCC AR5 ought to have noted this and suggested that this deficiency be remedied.)
PAGES 2017 included three ocean core proxy series in the 30-60S, all from offshore Chile. Their resolutions ranged from 24 to 83 years. There are some thus far undiscussed puzzles in the PAGES 2017 version of these series – as, in each case, modern values available in the underlying archive series were deleted. In each case, unsurprisingly, the effect of the deletion was to hide a decline. I will discuss this series below.
Subsequent to PAGES2017, the very first high-resolution (less than 10 years) 30-60S ocean core alkenone (or Mg/Ca) proxy was published: MD07-3093. [Collins, JA et al. (2019): Centennial-scale SE Pacific sea surface temperature variability over the past 2300 years. Paleoceanography and Paleoclimatology link.] It has values dated from 372 BC to 1992 AD, with a resolution of 5.4 years. The appearance of the high-resolution MD07-3093 is obviously very different – even opposite – to the PAGES 2019 reconstruction.

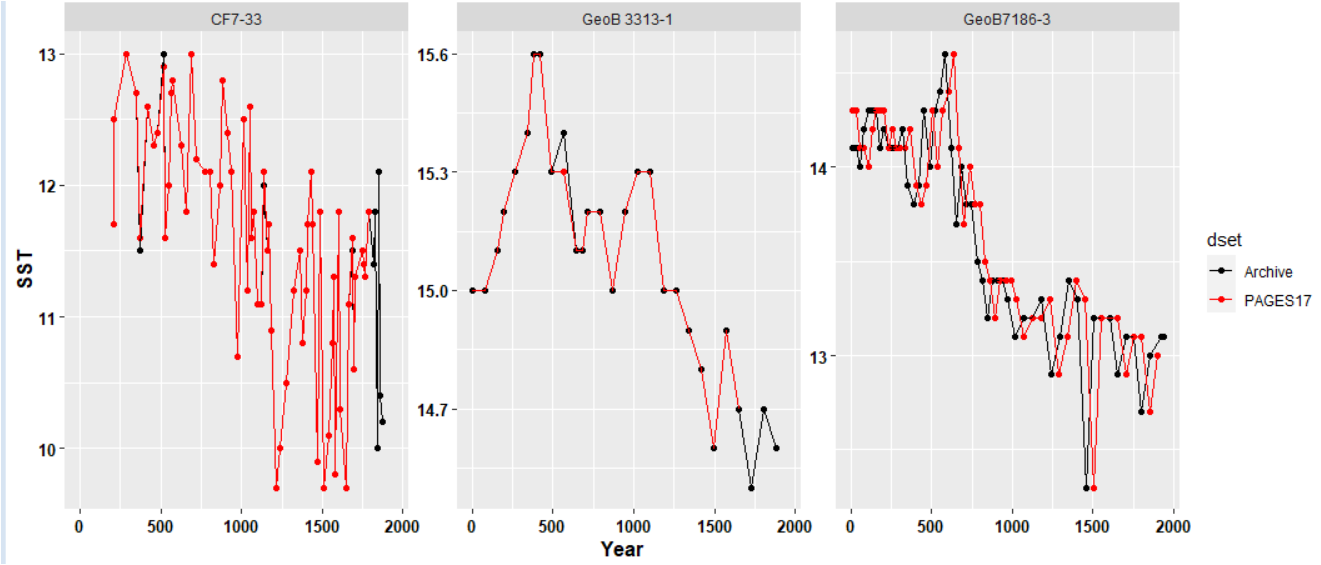
The three 30-60S ocean cores that were in PAGES 2017 (and dropped from PAGES 2019) are shown below. In each case, I’ve compared the NOAA or Pangaea original archive data (black) to the PAGES 2017 version (red). In each case, the PAGES2017 version was shortened by removal of a few closing values: CF7-33 was shortened from AD1874 close to AD1784; GeoB 3313-1 shortened from AD1884 to AD1650; and GeoB 7186-3 shortened from AD1938 to AD1900.
Although each of these series is lower resolution than the new MD07-3093 series, they tell the same story: a 1-1.5 deg C decrease in temperatures from the first millennium to the 20th century. And MD07-3093 indicates that the decrease has been maintained into the late 20th century (at least in these offshore Chile ocean core datasets.)
Conclusion
Given that the 60-30S latband is almost entirely ocean, it seems logical that IPCC and PAGES2K should use data from ocean proxies to estimate past temperature in this latitude band. But this isn’t what they’ve done. Instead, they’ve purported to estimate past temperature from a few scattered tree ring chronologies, only one of which reaches earlier than AD1850; and an idiosyncratic singleton pigment series. Ironically, the only 30-60S proxy series in PAGES 2019 that reaches back into the first millennium – the Mount Read, Tasmania tree ring series – was used by Mann et al 1998-1999, Jones et al 1998 and numerous other supposedly “independent” multiproxy studies. Neither of the two series reaching back to the medieval period permit the conclusion that modern period is warmer than medieval period. Caveat: I’m not saying that it isn’t; only that this data doesn’t show it, let alone support the big-bladed HS cited by IPCC. High-resolution alkenone measurements from ocean cores offshore Chile show a consistent decrease in ocean temperatures over the past two millennia that is neither reported nor discussed by IPCC (or PAGES 2019).
To be clear, some of the technical articles on 30-60S ocean core proxies by specialist authors are truly excellent and far more magisterial than the IPCC mustered, in particular, several articles on offshore Chile. Here are a few:
Mohtadi et al, 2007. Cooling of the southern high latitudes during the Medieval Period
and its effect on ENSO link
Killian and Lamy 2012. A review of Glacial and Holocene paleoclimate records from southernmost Patagonia (49-55degS) link
Collins et al 2019. Centennial‐Scale SE Pacific Sea Surface Temperature Variability Over the Past 2,300 Years link


37 Comments
“Climate science” is political science.
Fascinating! Please keep it up. So one cannot legitimately get their HS from their SH data and that is a big chunk of the world.
The more you find the worse it looks.
It’s a cultural perspective thing- https://travelinglight.com/upside-down-world-map/
Some contextualization is more equal than others.
Thanks, Steve. Good to see you analyzing and posting again. A pity your “Voice in the Wilderness” will be ignored as usual. Not how Science is supposed to work!
Be assured, Steve’s “voice” is never ignored by the climerati. They all come here to read and learn, just like the rest of us.
Thanks much, Steve. You definitely have not lost your touch.
My very best to you and yours, keep’m coming.
w.
I am really surprised by the limited number of New Zealand series that they include. I haven’t followed the literature at all closely but I do know that we have a wide range of long run proxies. see for instance this recent summary article.
https://www.researchgate.net/publication/312466956_The_Climate_of_New_Zealand_Through_the_Quaternary
It does suggests that at very least they have not included all the data available, which makes one wonder why
Margaret – it is fairly obvious why they didn’t use it despite the summary being very comprehensive and using a lot better proxies that tree rings. Tree lines and pollen from trees known to be cold temperature intolerant are as good as you get. Plus all the eruptions means things can be accurately dated. They conclusively show that it was a lot warmer in the past and that there was a Little Ice Age that matched the Northern Hemisphere dates.
This is excellent and much-needed detective work Steve. One thing the emerges is the arbitrariness of both the proxy selection and the number crunching methods. In the recent Mann v Steyn ruling in which the court threw out all of Mann’s expert witnesses (and allowed only one of Steyn’s to remain) the repeated principle to which the court appealed was whether the expert stated and followed a clear method that someone else would also be able to follow. Even Bradley, Mann’s coauthor, couldn’t explain how the MBH98 proxies were selected or rejected and his testimony was rejected by the court. It would be fun to see that court express an opinion on the PAGES2019 work.
Ross – I was surprised that a Judge understood and correctly applied Daubert in the Mann v Steyn case. Since Simberg and Steyn accused (accused for purposes of the court case) of torturing the data, The Judge correctly limited the ‘experts to ones who could opine on the statistical techniques. He excluded those who could opine on climate science in general. Another good example was the exclusion of Judith Curry. She was to testify as to the voluminous data in the public domain regarding the questionability of the climate science conclusions that Steyn could have relied on to dispute Mann’s work. However, she was properly excluded because she could not testify to what was in Steyn’s or Simberg’s mind.
Where does one find information like you have just exposed from the proceedings of the Mann vs Steyn case?
Go here http://rankexploits.com/musings/2021/bradley-excluded-as-mann-expert-witness/
Bradley also got excluded since he was the co-author of the study in dispute. Expert witness needs to be independent. FWIW – the judge seems to correctly apply daubert – very rare in litigation.
“the thing the emerges is the arbitrariness of both the proxy selection and the number crunching methods.”
I have a different take on “arbitrary.” It’s not. To start don’t assume the screened proxies are the end of their interrogation. These proxies could also cropped. SM points out this above in some PAGES 2017 proxies. I’ve seen it in earlier PAGES tree proxies. The PAGES approach seems to be as follows:
1. Aim to emulate IPCC HS graphs showing recent warming and about ~1900 prior years of near average no variation;
2. Select proxies that indicate a recent incline in something;
3. Also, select proxies that indicate nearly no variation in the last 2k years. If these proxies show recent decline or no-incline, crop that data.
The ocean proxies seem to be telling a consistent story.
Reblogged this on Climate Collections.
Looks like they cherry pick data to make it fit Mann’s agenda.It’s time other scientists had a say!
Most of the 30-60S HS is deep ocean. These ocean cores are proxies for (deep) sea temperature. Why should you combine them with proxies for air temperature?
To me, it looks correct to leave them out.
Bas, the alkenones derive from phytoplankton that inhabit the surface layers of the ocean, only sinking upon death, whereupon they are incorporated into the sediments.
Bas – https://www.earthmagazine.org/article/disrupting-deep-ocean-warming-reaches-abyss/
quote – “Models suggest that warming will slow ocean circulation, especially meridional overturning circulation (MOC) — the global-scale ocean conveyor belt system that moves heat, carbon, oxygen and nutrients around the planet. While there is still much uncertainty about how this will play out, mounting evidence from the past decade indicates that warming is now reaching beneath the ocean surface and into even the deepest parts of the oceans, where it can impact the processes that drive ocean convection and deep circulation”
if it is happens now it happened in the past (may not be the best link)
Jit & dfhunter, you do not answer the question: “Why should you combine proxies for sea temperature with proxies for air temperature?”.
Phytoplankton lives up to 200 meters deep. The temperature-proxy that this gives, as well as the ocean circulations, make it hardly representative for the air above.
Nakanishi et al. (2012b) investigated the vertical distribution of the alkenone concentration in the OT.
They showed that the alkenone concentration is 100–200 ng/L at depths of 0–25 m, whereas it is almost 0 ng/L at depths below 100 m. Moreover, alkenone-based temperatures reconstructed from suspended particulate organic matter were consistent with in situ shallow (above 100 m) water temperatures (Nakanishi et al. 2012b).
Thus, Nakanishi et al. (2012b) suggested that alkenone-based temperatures derived from alkenones preserved in sediments can be used to reconstruct SSTs in the OT. However, there may be changes in habitat depth depending on ages.
https://progearthplanetsci.springeropen.com/articles/10.1186/s40645-015-0074-1
markx, SST is sea temperature, do the question remains: “Why should you combine proxies for sea temperature with proxies for air temperature?”.
It still remains a mystery why there is not even one PAGES proxy site from mainland Australia, despite a cast of thousands of academic researchers. Is it possible that the continent yields no expression of change, hence tight lips? Geoff S
The data produced looks fairly convincing but the assumption this all comes from manmade CO2 is not. Look at climate history and you will find numerous warming periods such as Minoan, Roman and Medieval occuring when CO2 levels were much less than todays. Find out why these happened and you will be closer to a true picture and not one “cooked up” for green political agendas.
What they don’t tell you at the IPCC
“… Holocene neoglaciation in the Alps…summits around 3000–4000 m were likely ice-free during the Mid-Holocene or covered by glaciers distinctly smaller than today…”
https://www.nature.com/articles/s41598-020-77518-9
“… Holocene neoglaciation in the Alps…summits around 3000–4000 m were likely ice-free during the Mid-Holocene or covered by glaciers distinctly smaller than today…”
One of my complaints – that should be obvious to the climate scientists is the number of other “unofficial proxies ” that dont reconcile to the “official proxies” .
A couple good examples in addition to the one pointed out by werner is the tree line at yamal (esper?) or the forests exposed by receding glacers
Hi Steve, could you post the R code to get the data from the big netCDF files ?
which files?
” (The latband reconstruction was calculated from the enormous file at NOAA here). “
loc=”https://www1.ncdc.noaa.gov/pub/data/paleo/reconstructions/neukom2019/CPS.nc”
download.file(loc,”e:/temp/temp.nc”,mode=”wb”)
dest=”e:/temp/temp.nc”
library(ncdf4)
v=nc_open(dest)
v$var$tas$dimids # 0 1 2 3
length(v$var$tas$dim)
names(v$var$tas$dim[[1]])
v$var$tas$dim[[1]]$units # “degrees_east”
v$var$tas$dim[[1]]$vals #2.5., 7.5….. #72
long=v$var$tas$dim[[1]]$vals
lat=v$var$tas$dim[[2]]$vals # -87.5 -82.5 -77.5 # 36
dim(v$var$tas$dim[[3]]$vals) # 100
v$var$tas$dim[[3]]$vals #1,…,1000
v$var$tas$dim[[3]]$units #level
length(v$var$tas$dim[[4]]$vals) #2000
range(v$var$tas$dim[[4]]$units # “days since 1970-01-01 00:00”
v1=v$var$t
v$var$tas$ndims #4
instr <- ncvar_get( v, v$var$tas) # 1850 2006
v4 <- v$var$tas[[4]]
varsize <- v4$varsize
ndims <- v4$ndims
nt <- varsize[ndims] # R
data3 <- ncvar_get( nc, v3, start=start, count=count )
data4 <- ncvar_get( nc, vr, start=1, count=1 )
v3=v$var$tas
varsize=v$var$tas$varsize
ndims=v3$ndims
nt=varsize[ndims]
Out=array(NA,dim=c(2000,36))
for(i in 1:nt) {
start=rep(1,ndims)
start[ndims] <- i # change to start=(1,1,1,…,i) to read timestep i
count <- varsize # begin w/count=(nx,ny,nz,…,nt), reads entire var
count[ndims] <- 1 # change to count=(nx,ny,nz,…,1) to read 1 tstep
data3 <- ncvar_get( v, v3, start=start, count=count )
dim(data3)
#[1] 72 36 100
w=apply(data3,2,mean)
Out[i,]=w
}
write.csv(Out, file="e:/OneDrive/climate/data/multiproxy/pages2019/recon_by_lat.csv")
w=cos(pi*lat/180)
Recon=array(NA,dim=c(2000,6))
#south to north
for (k in 1:6) {
ind= 6*(k-1)+(1:6)
Recon[,k]=apply(Out[,ind],1, function(x) weighted.mean(x,w[ind]) )
}
write.csv(Recon,file="e:/OneDrive/climate/data/multiproxy/pages2019/recon_by_latband.csv")
the file downloaded was 1.9 GB. Given that the underlying proxy data is less than 1MB in size, it seems rather overcooked.
Thanks a lot, much appreciated.
Back in the Climateaudit post on Oceans 2K in 2015 Ken Fritsch posted plots of their proxies, including the two lonely southern hemisphere ones. Those two SH ones show just a gradual declining slope with no modern blade. I am surprised nobody, including myself, did not pick up on the obvious absence of southern hemisphere representation in the dozens of proxies, mostly alkenones. https://climateaudit.org/2015/09/19/the-blade-of-ocean2k/#comment-764201
Ron Graf,
Following your advice, I’ve just re-read Steve’s essay and comments containing the Ken Fritsch data and graphs from 2015. You make a valid point.
Overall, the main lesson I draw after those last 5 years is one of scientific discipline. As well as Steve, several of the 2015 bloggers pointed to matters of science that needed examination and likely correction, but there seems to have been little correction done by at least the PAGES people. Other groups might have done more, beyond my reading.
This modern segment named climate science has done a poor job of answering valid criticisms. As such, it could be described as “anti-science”.
It will be interesting to check after the next 5 years to see if corrections are made following the current series of posts by Steve, unless I have, by then, confirmed the Planck postulate that science progresses one funeral at a time. Geoff S
I’ve added an update to South American Proxies post https://climateaudit.org/2018/10/07/pages2k-2017-south-america-revisited/
PAGES2K (2019) further winnowed this network down to only four retained proxies: Quelccaya, Aculeo, CentralAndes11 and CentralAndes15. The two tree ring chronologies identified above as going further down when extended (CAN9, CAN6) were removed from network, no doubt for “good” reasons. So, of the original 63 tree ring chronologies in the Neukom and Gergis (2012) network, only two were retained into PAGES 2019.
Steve,
Some of my comment was badly written. It could be read as critical of your efforts because they had produced no improvement – as I wrote, “there seems to have been little correction done by at least the PAGES people.” I have no criticism of your work. It is sad that hundreds of others did not perform similar examinations with similar high quality.
To clarify, past work of your good self alone or with Ross McKitrick, has had a substantial effect on improvement of the quality of “climate science” to the extent that I have several times written that Climate Audit deserves a high place in the history of the evolution of the Internet and blogging. For example, CA was at the forefront of promoting the desirable act of requiring authors to show their data. CA is an excellent example of how the then-emerging form of communication, the blog, could be used and was used to cause improvement in high profile cases like the hockey stick and in many other examples of poor “climate science”.
My comments were meant to lament the ongoing repetition of error-filled poor science by the PAGES people, from version to version. Despite your careful past criticisms, the PAGES group has done little correction to the way that they think or to examination of the quality of their “givens”, like the ability of a proxy to adequately relate to temperature. In another sense, they have done some correction to their choice of proxy studies, even by first approving a proxy selection then dis-approving it. Maybe, eventually, they will eliminate all of their approved past proxies and leave the way more open for better studies.
Geoff S
2 Trackbacks
[…] PAGES2019: 30-60S […]
[…] PAGES2019: 30-60S […]