I discussed the China network in Jones et al 1990 which is still cited as key evidence against UHI having a material effect on temperature estimates (even in IPCC 4AR). Shortly after Jones et al was published, Wang et al. 1990 ( W-C Wang, Z, Zeng and T. Karl, Urban Heat Islands in China, 1990. GRL 2377-2380, available here – see pages 197-202 ) re-visited what appears to be precisely the same network. Jones et al 1990 reported that they studied 42 Chinese urban-rural pairs. Two authors are in common between the two articles (Karl, W-C Wang). Wang et al say:
“We used 1954-1983 surface temperature from 42 Chinese urban (average population 1.7 million) and rural station pairs (Average population 150,000) to study the urban heat island effects.”
I’ll show their map below, but this seems likely that this is the same network. But the conclusions are quite different.
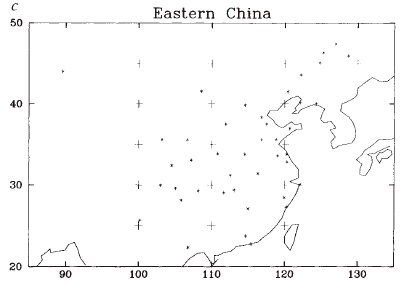
First, here is a comparison of the two location maps. There is a considerable amount in common, but also differences in details, which may affect Warwick’s proposed identifications.
 |
 |
Left – Location map in Jones et al 1990; right – location map in Wang et al 1990.
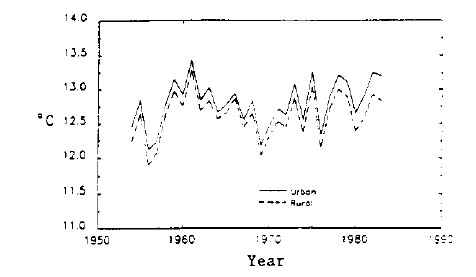
As a comparison, I calculated annual averages of 25 HadCRUT3 gridcells corresponding to the grid in Jones et al 1990 (which used 5×10 gridcells and thus overlap but are not precisely the same.) The 1954-1983 values in HAdCRUT3 look somewhat like Figure 2 in Wang et al 1990. However, the amplitude of change in the 1960s appears to be somewhat attenuated.
 |
 |
Left – Figure 2 from Wang et al 1990 showing absolute temperatures; right – average of 25 HAdCRUT3 gridcells (anomalies).
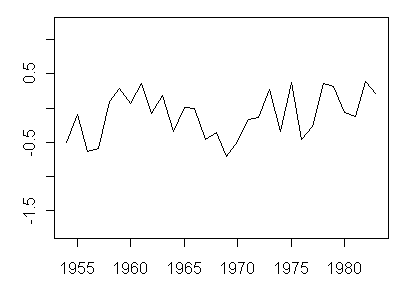
For comparison purposes, here is the 25-gridcell average over the 1850-2006 period covered by HadCRUT3, with the 1953 and 1983 end points marked. There is no trend from 1850 to 1983 – the end of the period included in the Jones et al 1990 study. Wang et al observed that, during the 1953-1983 period, China was impacted by the Great Leap Forward before 1966; the Cultural Revolution afterward, with the Open Door opening only from around 1978. Remarkably, all of the increase in China gridcell temperatures has taken place since the Open Door. Despite increased CO2 in the 20th century, the impact on China appears to have been negligible to 1983.
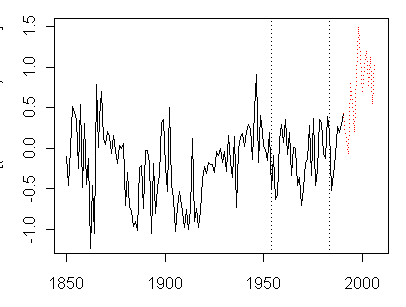
25-gridcell China average from HadCRUT3. Dotted red – post 1990 values.
Wang et al observed:
The differences over the 1954-83 period indicate that since the late 1970s the rate of warming at urban stations is over 0.1 deg C decade relative to more rural stations. … These results suggest that caution must be used when using trends from stations in the vicinity of major metropolitan centers.
Now here’s a really strange quote – given that Wang and Karl were co-authors of Jones et al 1990 –
Our work differs from the recent study by Jones et al 1990. They have shown that any urban bias in their data has been mitigated over eastern China. The reasons for this are not clear.
How can coauthors make a statement like this only 6 months after the original article? It’s seems goofy that they should be arguing with themselves only 6 months later. Jones et al 1990 had concluded that UHI bias in gridded data could be capped at 0.05 deg C (not per decade, per century). IPCC 2001 cited Jones et al 1990 without mentioning Wang et al 1990, as follows:
These results [Peterson et al 1999] confirm the conclusions of Jones et al. (1990) and Easterling et al. (1997) that urban effects on 20th century globally and hemispherically averaged land air temperature time-series do not exceed about 0.05°C over the period 1900 to 1990 (assumed here to represent one standard error in the assessed non-urban trends).
IPCC AR4 again cited Jones et al 1990, without mentioning Wang et al:
Urbanization impacts on global and hemispheric temperature trends (Karl et al., 1988; Jones et al., 1990; Easterling et al., 1997; Peterson, 2003 [which applies Jones et al 1990 in part]; Parker, 2004, 2006) have been found to be small.
Reference:
W-C Wang, Z, Zeng and T. Karl, Urban Heat Islands in China, 1990. GRL 2377-2380, available here – see pages 197-202 )
Also worth consulting (which I’ll try to review on another occasion is Zhou et al 2004. Liming Zhou Robert E. Dickinson, Yuhong Tian, Jingyun Fang, Qingxiang Li, Robert K. Kaufmann, Compton J. Tucker, and Ranga B. Myneni, Evidence for a significant urbanization effect on climate in China url
SI


63 Comments
Well, Karl and Wang could have been involved in the Jones paper only in providing data, running some analysis, or writing parts of it that did not involve reaching the major conclusions.
I have been co-author on papers where I didn’t know everything that went into the parts written by the other authors, but I would never admit it. Oh, I just did. Never mind.
RE: rural station pairs (Average population 150,000)
!!!!!!!!!! 150,000 is rural!???!
It seems like a climate wonderland where researchers can study UHI effects without ever leaving their offices or even be in the same country. The spatial resolutiong of satelite imagery is several orders of magnitude less than would be obtained from a site inspection of indivdual stations. Why does there appear to be no legwork.
Even in areas of stable population there are still new buildings, roadways are widened, houses enlarged. Income growth only accelerates this.
RE” #1 – One of my “coauthorships” consisted of having lunch with the author …. ahhhhhh … good to get that off my chest … 🙂
I’m probably missing something here because I’ve read none of these papers.
Steve’s AR4 quote cites five studies supporting a small UHI effect. What’s so special about Jones?
If for some reason Jones 1990 is the low hanging fruit among the bunch, what does it accomplish showing that he was wrong?
re: #5
It’s called, “You have to start somewhere.” Anyway, if you think another citation is better, which one is it? Surely not the wind study or the night-light study? They’re both shakey on several points.
re#6
I have been trying to find rebuttals/comments/descriptions of flaws in the wind & night light study. This has probably been answered earlier, but could you or someone else be so kind as to point an interested amateur to posts/sites where the flaws with these studies have been pointed out?
Kind Regards
Steve
99% of all business audits don’t find anything wrong. That doesn’t mean that someone shouldn’t check the work.
I don’t know that it’s “low hanging fruit”. I do know that it continues to be cited.
Steve M says: “IPCC AR4 again cited Jones et al 1990, without mentioning Wang et al”.
IPCC AR4 – sounds like jones spelled differently.
On the following site:
http://www.heartland.org/Article.cfm?artId=14282
is:
New Study Confirms Dramatic Urban Heat Island Effect
Written By: James M. Taylor
Published In: Environment News
With apologies. Steve (8), I would have said, “I don’t know that it’s ‘low-hanging fruit’ but, thank you for …”
Re: #7
If you’re talking about the Parker paper in Nature, you might look at the references cited here by Roger Pielke , Sr.
The Peterson paper referred to is: Thomas C. Peterson (2003). Assessment of Urban Versus Rural In Situ Surface Temperatures in the Contiguous United States: No Difference Found. Journal of Climate 16: 2941’€”2959. The slides for which can be found here: http://web.archive.org/web/20040719174156/http://www.ncdc.noaa.gov/oa/rural.urban.ppt ( I tried putting this in as a link but it didn’t work.) The Peterson presentation was a major factor in convincing me that the instrumental surface record was not and could not be made fit for the purpose of climate monitoring, not his intended effect I’m sure.
The Parker paper is: David E. Parker (2004). Climate: Large-scale warming is not urban. Nature 432: 290
The list of authors on these papers, particularly Karl [head of NCDC] and Dickinson [former president of AGU], comes as a surprise. Having written papers documenting the magnitude of the UHI effect (which, if we believe the papers, would seem to be the same sign and about the same magnitude as hypothesized warming), it seems odd that Karl and Dickinson did not speak up when the draft AR4 understated the UHI effect by an order of magnitude.
Am I missing something here?
That Peterson presentation linked in #11 by Dewitt is the biggest pile of tripe I have ever seen.
The winter mean temperature of Washington DC shows a 4F difference between the city centre and the outskirts and a 7F difference to the rural area with as clear an outline of winter urban heat island effect I have ever seen.
Then he goes on to say it is not adjusted properly and the urban heat island difference is only 0.1C.
I feel slimed after reading through that.
re: 11 — are the 1st 2 links working?
Not Found
The requested URL /2006/01/23/why-there-is-a-warm-bias-in-the-existing-analyses-of-the-global-average-surface-temperature/ was not found on this server.
Apache/2.2.3 (Debian) Server at climatesci.atmos.colostate.edu Port 80
#14
Let me give it a try and see if it works here.
Looks like a real long URL address and may have gotten truncated somehow.
Hmmm. From the preview, looks like mine’s getting truncated too. If it shows like it previews, try
http://tinyurl.com/2tbez6
re: #13
Yeah, the claim is that while there is a fairly large UHI, it doesn’t change much in a given area over time. That might be true in some cases, but given how much population has increased over the last century, it’s madness to believe that the difference in temperature over a century can be .05 deg C or anything close.
Now, it’s also true that if we had a degree of UHI over the past century in built-up areas it might only amount to a tenth of a degree, say, averaged over the whole earth, but that assumes that we have adjusted all station readings to represent the whole earth. If half of the stations have 1 deg UHI and the rest average .1 deg UHI, we’re not going to see .05 deg C from UHI worldwide, we’re going to see something like .55 deg UHI based on actual station readings. IMO, that’s where too many AGW believers go wrong. They average before they correct.
#11
Peterson:
🙂
Steve
I’ve written previously in regards to my observaions regarding the UHI effect in various locals, including San Antonio TX, Oklahoma City OK and Edmonton AB.
On a slightly different bent, your graph, 25 grid cell average, above, is very similar to many Canadian Arctic GISS records, showing a break at 1998 or so and a great leap to higher levels in succeeding years. I have observed numerous stations showing no apparent trend prior to the late nineties and then a break in the data and corresponding change, the “great leap”. It is as distressing to see that very few of the stations in the arctic have continued to collect data beyond 1990 (political change?). My question; did the entire globe take a great leap in 1998? I suspect that the polar amplification effect is an artifact of instrumentation and station abandonment (political?).
A few examples are:
Cambridge Bay
http://data.giss.nasa.gov/cgi-bin/gistemp/gistemp_station.py?id=403719250000&data_set=0&num_neighbors=1
Baker Lake
http://data.giss.nasa.gov/cgi-bin/gistemp/gistemp_station.py?id=403719260000&data_set=0&num_neighbors=1
Nitchequon
http://data.giss.nasa.gov/cgi-bin/gistemp/gistemp_station.py?id=403718260000&data_set=0&num_neighbors=1
Resolute
http://data.giss.nasa.gov/cgi-bin/gistemp/gistemp_station.py?id=403719240000&data_set=0&num_neighbors=1
Hall Beach
http://data.giss.nasa.gov/cgi-bin/gistemp/gistemp_station.py?id=403710810001&data_set=0&num_neighbors=1
My main problem with Peterson is that when comparing rural and urban clusters, he doesn’t consider synchronous (population) change, in fact that parameter is averaged out in his analysis.

Parks in towns also have a UHI
eg: http://climatesci.colorado.edu/2006/01/31/more-on-urban-temperatures/
Note a recent article this month in GRL on urban warming effects in China by Ren:
Abstract:
Temporal change in urbanization-induced warming at two national basic meteorological stations of China and its contribution to the overall warming are analyzed. Annual and seasonal mean surface air temperature for time periods of 1961~2000 and 1981~2000 at the two stations of “Beijing and Wuhan Cities and their nearby rural stations all significantly increase. Annual and seasonal urbanization-induced warming for the two periods at Beijing and Wuhan stations is also generally significant, with the annual urban warming accounting for about 65~80% of the overall warming in 1961~2000 and about 40~61% of the overall warming in 1981~2000. This result along with the previous researches indicates a need to pay more attention to the urbanization-induced bias probably existing in the current surface air temperature records of the national basic stations”.
They start off with the problem:
“Urbanization may have affected the surface air temperature (SAT) records at many city stations in continents, especially in industrial regions like Europe, North America and East Asia. However, this issue is still under debate at present. It is generally hold that urban heat island effect is of secondary importance, and it is unlikely to surpass 0.05°C in the past a hundred years on global average, a magnitude lower than the optimal estimation of the global average annual mean SAT change of 0.6°C [Jones et al., 1990; Intergovernmental Panel on Climate Change, 2001; Peterson, 2003; Li et al., 2004a]. On the other hand, some researches have shown that the urban heat island effect may play a significant role in the global and regional SAT trend estimated up to date, which should be paid more attention to and should be emended [Hansen et al., 2001; Kalnay and Cai, 2003; Zhou et al., 2004; Zhou and Ren, 2005]”.
Their conslusion:
“In summary, temporal trends of annual and seasonal mean SAT for time periods of 1961~2000 and 1981~2000 at Beijing and Wuhan stations and their nearby rural stations are all significantly positive, and the annual and seasonal urban warming for the two periods for Beijing and Wuhan stations is also positive and significant. The annual urban warming at the city stations can account for about 65~80% of the overall warming in 1961~2000, and about 40~61% of the overall warming in 1981~2000. The quality control and the in-homogeneity examination and adjustment for the data of the stations used for the analysis have been made”.
Ref.: Ren, G. Y., Z. Y. Chu, Z. H. Chen, and Y. Y. Ren (2007), Implications of temporal change in urban heat island intensity observed at Beijing and Wuhan stations, Geophys. Res. Lett., 34, L05711, doi:10.1029/2006GL027927 here
The evidence of a large UHI effect is right out in the open for all to see, and is reported in the academic literature. But it is ignored because it is inconvenient and because those who would make it an important issue are not on the inside.
Similarly, the evidence that Antartica and Greenland are not warming and are in fact gaining ice is right out there in the open.
When I discuss this with people who hold the conventional wisdom to be the truth, they have to concede that sea level rise, temp changes, ice changes, etc. are not happening now. They fall back on the idea of a tipping point. Can anyone here refer me to a statement of the argument that while not much has happened so far, all the ice is about to slide off of Antartica?
Thank you
RE: #16 – In many areas, major urban areas have cropped up since the early 1900s and then exploded outward since 1970. Take for example the Sun Belt in the US.
Question from a person who just turned “dummy” when dealing
with UHIEs…Peterson writes about negative UHIs…So the
business idea of some 50 % was obviously to get a cooler
climate…Whatⳳ next from Team Halleluja AGW? “The polar
bears are leaving Churchill MB because itⳳ too cold!!”
Steve McIntyre when you were in Stockholm last September
at Fred Goldberg et alⳳ seminar one person in the audience
asked if you were a climate scientist…(not me of course…)
“No, IⳭ doing statistics” or something like that was your
answer…IⳭ getting more and more inclined to think that
all these meteorologists and climatologists that can tell
1 from 2 or 3 or…should have a good course in statistics
though I still think the Disraeli saying quoted by Mark Twain about
there being 3 sorts of lies is “valid” There are simply
too many “Pinnebergs-Mr Bean” around Angela Merkel being one
possibly, Vaclav Klaus not hopefully…
Re 11, 13, 15, etc I am pleased to see scales are clearly falling from readers eyes over some of Tom Peterson’s recent contribution’s to IPCC compliant science.
It is worth understanding how deceptive the Vose et al (incl T.P.) 2005 paper in GRL which purported to trumpet how similar are the GHCN and CRU global grid points 1976-2003.
http://www.warwickhughes.com/papers/vose05.htm
I ask, “Is this 2005 paper by leading IPCC climate scientists, deceptive ?”
Steve, sorry for this “off-Topic”. What do you think (or some of the readers here) about the “Wunsch discussion“? Is Wunsch under pressure? I can’t understand his reaction.
“They fall back on the idea of a tipping point. Can anyone here refer me to a statement of the argument that while not much has happened so far, all the ice is about to slide off of Antartica?”
No.
The “tipping point” is not the concoction of scientists, or science. It is public relations meme with a political purpose. The purpose was to manufacture a sense of crisis so that politicians, state and federal, in the US would enact cap and trade without much examination. The political term of art for the tactic is “stampeding.” “Tipping point”
was vented, in the US at least, just after the “consensus” meme failed to gain traction.
Roger:
I checked around on Canada Statisitics for Cambridge Bay, one of these sites, and it appears that since 1990 the population has increased from 1120 to 1477 with a commensurate increase in the number of buildings see here
There are also some interesting maps that indicate that a number of these hamlets have grown significantly in relative terms since 1991 suggesting that there may well have been am impact on the micro climate of the station. Also note that a numebr of these location also house early warning radar stations. Let me know if you need any help on this kind of fact gathering.
Re broken links in #11
Sorry about that. I pulled the URL’s from Google and forgot that Pielke, Sr. had changed his domain name in the meantime.
In case anyone didn’t find the correct address on their own, I’ll try again:
“Why there is a Warm Bias in the Existing Analyses of the Global Average Surface Temperature”
full address:
http://climatesci.colorado.edu/2006/01/23/why-there-is-a-warm-bias-in-the-existing-analyses-of-the-global-average-surface-temperature/
Now let’s see if the hyperlink works:
link
and for the second:
“Where are the Newly Recognized Uncertainties Assessed in the 2005 GISS Surface Temperature Record?”
http://climatesci.colorado.edu/index.php?s=Where+are+the+Newly+Recognized+Uncertainties+Assessed+in+the+2005+GISS+Surface+Temperature+Record%3F&submit=Search
link
Reminder to self, always test links before posting.
Dear Climate Audit UHI experts, I have a couple of questions on some UIH research I am attempting, using remote automated weather stations in California.
I have been down loading the data from the Remote Automate Weather Stations operated by the Bureau of Land Management and Forest Service in the US. Details at the Western Region Climate Center
I have used Google Earth to confirm the station locations are in remote forest glades and meadows, plus some stations have meta data files with photos to show the location in 360 panoramic displays. Some records start in 1989, others in the early 1990s. Many have complete daily records, with a monthly and yearly summaries. Users can graph the data using the onsite tools.
I have been plotting the yearly summaries in R, as part of project to learn R. Of the six sites I have plotted in so far, all show a declining average annual temperature starting about 2003. I am going to compare the RAWS plots with National Weather Service COOP stations in near by towns. However, I am finding errors in some of the COOP data that needs to be resolved first.
Our Regional Air Quality District also has stations that record temperature in some of the target towns since 1993. They will not have the 2006 summary data available to the public until April. I am going to photograph the COOP and Air Quality stations this spring on a road trip, and compare there localtions with the RAWS stations, I will also compare the temperature graphs.
My question, is this an effective approach to coming up with some effective data on UHI effects? I am trying to control for altitude differences between the RAWS and COOP/AQ stations. What other controls should I consider? Are records only ten years long, long enough to produce good evidence of UHI results? Any advice would be welcome.
In recent years U.S. television stations have been expanding automated weather data collection points in their viewing areas to feed the local weather reports with live data. Some of it even is on their website. Has anyone ever analyzed these closely spaced sites for UHI effects? Population and development densities can be determined and correlated from satellite imagery. It seems that the current method of comparing urban/rural pairs of stations doesn’t provide sufficient areal coverage.
re 29:
IMHO the best proxy for UHI is population, you might want to compare your remote forest data with urban data that show a significant population change. UHI value (in degrees C) is typical T= 1.5 log(population), so you need a steep population change to see any effect, I doubt that a decade is sufficient considering also that growth in US population is levelling off.
I just had a look at the new Jones et al for 2006 for Arctic 70N-90N 180E/W and what a BIG surprise!!
Until for 1 week ago, with the period 1930-2005 we had the following 12 warmest Arctic years:
Year Anomaly degrees C
1938 2.030988
2005 1.971766
1937 1.856739
1944 1.600208
1998 1.413495
1934 1.371807
1981 1.363475
1947 1.272157
1943 1.212582
1954 1.132263
1953 1.086665
2002 1.075276
But today I had a look at the new Jones et al 1930-2006 and the list have been somewhat modefied!!
2005 2.032369
2006 1.891971
1937 1.806445
1938 1.562015
1947 1.593568
1944 1.544973
1998 1.285725
1943 1.251363
1940 1.200875
1934 1.137410
2002 1.129200
2003 1.029881
If nothing happens today you can always change the past to make people feel that today is changeing?
1930-2005 Temperature Time Series
Latitude Range 70 to 90, Longitude Range -180 to 180
(from the Jones et al. dataset)
# These are the actual spatially averaged temperature anomalies.
1930 1.057836
1931 0.822728
1932 0.461019
1933 0.685168
1934 1.371807
1935 0.898136
1936 0.768844
1937 1.856739
1938 2.030988
1939 0.756727
1940 0.961139
1941 -0.032142
1942 0.309564
1943 1.212582
1944 1.600208
1945 0.959755
1946 0.542403
1947 1.272157
1948 0.064689
1949 0.328692
1950 0.394103
1951 0.114640
1952 0.485958
1953 1.086665
1954 1.132263
1955 -0.023157
1956 0.197146
1957 0.110060
1958 -0.134437
1959 0.457103
1960 0.445223
1961 -0.356539
1962 0.617784
1963 -0.057281
1964 -0.719134
1965 -0.276294
1966 -0.736738
1967 0.068669
1968 -0.169783
1969 0.153807
1970 -0.222404
1971 0.014638
1972 -0.094320
1973 0.265136
1974 -0.391371
1975 -0.088867
1976 0.105701
1977 0.267857
1978 -0.204542
1979 -0.501220
1980 0.315983
1981 1.363475
1982 -0.359360
1983 0.082396
1984 0.120352
1985 0.292629
1986 -0.057358
1987 -0.102902
1988 0.482947
1989 0.359517
1990 0.656490
1991 0.407470
1992 0.056066
1993 0.448382
1994 0.379537
1995 0.822520
1996 0.576891
1997 0.496474
1998 1.413495
1999 0.724289
2000 0.872611
2001 0.918726
2002 1.075276
2003 0.973584
2004 0.853293
2005 1.971766
1930-2006 Temperature Time Series
Latitude Range 70 to 90, Longitude Range -180 to 180
(from the Jones et al. dataset)
# These are the actual spatially averaged temperature anomalies.
1930 0.979681
1931 0.467501
1932 0.420641
1933 0.644316
1934 1.137410
1935 0.874134
1936 0.675953
1937 1.806445
1938 1.562015
1939 0.837707
1940 1.200875
1941 0.340131
1942 0.532315
1943 1.251363
1944 1.544973
1945 0.986542
1946 0.537499
1947 1.593568
1948 0.024155
1949 0.269275
1950 0.269522
1951 0.125743
1952 0.471106
1953 0.910339
1954 0.982158
1955 0.006910
1956 0.167435
1957 0.051216
1958 -0.023120
1959 0.398250
1960 0.504195
1961 -0.272194
1962 0.589913
1963 -0.075309
1964 -0.671331
1965 -0.199427
1966 -0.651262
1967 0.055958
1968 -0.141580
1969 0.470765
1970 -0.097566
1971 0.217686
1972 0.107556
1973 0.336958
1974 -0.216583
1975 -0.108465
1976 0.083699
1977 0.228694
1978 -0.281115
1979 -0.518541
1980 0.290864
1981 0.972302
1982 -0.362166
1983 0.080650
1984 0.187645
1985 0.343015
1986 -0.129860
1987 -0.274626
1988 0.403730
1989 0.225025
1990 0.757527
1991 0.404496
1992 0.025602
1993 0.340465
1994 0.237649
1995 0.665007
1996 0.593312
1997 0.468849
1998 1.285725
1999 0.685798
2000 0.868651
2001 0.954385
2002 1.129200
2003 1.029881
2004 0.828808
2005 2.032369
2006 1.891971
Jones et al 70N-90N 180E/W
Yesterdays list
1930-2005(Yesterday)
list of 12 warmest years:
1938 2.030988
2005 1.971766
1937 1.856739
1944 1.600208
1998 1.413495
1934 1.371807
1981 1.363475
1947 1.272157
1943 1.212582
1954 1.132263
1953 1.086665
2002 1.075276
1930-2006(Today)
2005 2.032369
2006 1.891971
1937 1.806445
1938 1.562015
1947 1.593568
1944 1.544973
1998 1.285725
1943 1.251363
1940 1.200875
1934 1.137410
2002 1.129200
2003 1.029881
#31
Depends on the city. Some cities are growing very fast, others are stable, a few are actually loosing population.
I believe Las Vegas has grown close to 30% over the last decade.
re: #31 Hans,
I know the world’s population has more than doubled in the past century so 1.5 * Log(2) = .45 This would mean that instead of .05 per century we should subtract.45 deg C from the .60 warming measured by the surface temperature people. I.e. instead of a net warming of .55 we should have .15 deg C. I know it’s not that simple, but that should be the starting point to be explained.
#32&33. Wow! 1938 lost 0.5 C in one day. Time machines are only dreamt of in physics.
#32-33. Jon=Anders, could you give the exact URL that you used for download?
I used the USHCN temp data as linked on CO2Science.org to satisfy my curiosity about a place I know well, the state of Vermont. Vermont has only 7 temp series in the USHCN. I used CO2Science’s slope coefficient estimator to see what the gradient has been from 1930 to 1997 (the data only go to 2000, and 1998 is such a large spike that I decided to leave that cherry out).
Here are the results: slope from 1930 to 1997 and population.
City (town) slope coeff.
Dang: hitting the “tab” causes the comment to be submitted.
Once again, here are the results for all USHCN locations in Vermont
City(town) slope coeff. 1930-1997 2000 Population
Burlington 0.008 38,531
St. Johnsbury 0.006 7,571
Chelsea -0.005 1,470
Cornwall -0.016 1,240
Enosberg -0.004 2,788
Northfield -0.034 5,791
I know most of these towns, and outside of Burlington and St. Johnsbury, the others have hardly changed in 100 years. Agriculture has also declined a lot over the period. So no general conclusions here. But Vermont has not warmed. And there is a UHI effect.
RE: #26 – On that note, there was a highly disturbing article in today’s FT. Essential points were, top 4 US auto execs are now on board with aggressive cap and trade, as are a number of key GOP senators. AAARRRRRRRGGGGGHHHH!
RE: #32 – The Dust Bowl years are a highly inconvenient truth for AGW fanatics. Therefore, the Dust Bowl years have now been cooled by Big Brother’s Ministry of Truth.
Reply#37
I used http://www.co2science.org/scripts/CO2ScienceB2C/data/temperatures/jones.jsp
And have for several years used it and saved each year for 70N-90N.
Re#37
ref:
http://www.climateaudit.org/?p=1133f:
http://www.iisd.ca/vol12/enb12319e.html
“On text noting high decadal variability in Arctic temperatures, Canada, supported by Norway, suggested removing a specific reference to a warm period observed from 1925 to 1945. The Coordinating Lead Authors explained that “climate sceptics” often point to this warm spell to question the IPCC for not acknowledging such warm spells. Participants agreed to keep the reference.”
Maybee Norway and Canada went both their way determined to do somthing about the historic data without coordiniating the change of Arctic between Norway and Canada?(historic change upon historic change?)
Re #42,
It is very important to distinguish between what Jones says,
and what someone else says, or implies, that Jones says.
Re#37 Or
Maybee Jones was there and afterwards made som changes to his dataset?
I dont know.
But I don’t like the smell of it.
Re#44
Agree.
I have just used the same source for many years and now experience a huge change in the Arctic historically.
I am just blowing the wisle.
You can get Jones’ numbers at http://www.cru.uea.ac.uk/cru/data/temperature/
If you get Idso’s interpretations of Jones’ data set, you
may find that you get different numbers; I did.
Re # 32 from Jon-Anders Grannes. Interesting comparisons Jon-Anders. Can I just suggest that it might be better to refer to the HadCRUT3 data through 2006 as coming from the Hadley Centre. You say Jones et al. I think there are several signs that Hadley have largely supplanted Jones now. A point that I make at;
Huge variations now between the 3 main global T datasets, 31 Jan
and the linked page with maps;
http://www.warwickhughes.com/sst/comp2005.htm
I notice that the CO2science.com site gives the source as a Jones et al paper and I will email them and see if they are correct with that.
If the data through 2006 is from Brohan et al then it is as I say, a Hadley production with Jones as the tail end author.
If it is from a Jones et al publication then we have another competing dataset which I doubt.
Note that Jones CRU website;
http://www.cru.uea.ac.uk/cru/climon/data/tgrid/
stops updating HadCRUT2 at end 2005.
Re #42 Jerry, can I add to what you said;
It is also very important to distinguish between what Jones says, and what Jones DOES.
Re my 48, I have heard from the CO2science people who say their website will be updated next week to take account of the Hadley Centre authorship of HadCRUT3.
A huge sea change has happened in the way IPCC global T data is compiled.
Re#48
Thanks for the reply.
This page http://www.cru.uea.ac.uk/cru/data/temperature/
states that there are
CRUTEM3 land air temperature anomalies on a 5° by 5° grid-box basis
CRUTEM3v variance adjusted version of CRUTEM3
HadCRUT3 combined land and marine [sea surface temperature (SST) anomalies from HadSST2, see Rayner et al., 2006] temperature anomalies on a 5° by 5° grid-box basis
HadCRUT3v variance adjusted version of HadCRUT3
HadSST2 sea surface temperature anomalies from Rainer et al (2006)
Absolute Absolute temperatures for the base period 1961-90 (see Jones et al., 1999)
Data for download seems to be for all valid up to 2007-01 (2007-02-15)
I have downloaded these files earlier but have problems using them.
Find the version at http://www.co2science.org/scripts/CO2ScienceB2C/data/temperatures/jones.jsp is more easy to use.
But as I understand it they are making new datasets that have the effect to make historic climate colder and todays climate warmer?
What is the name of this game?
“Think of a number?”
You will also find some more data here
http://www.cru.uea.ac.uk/cru/data/tem2/
CRUTEM2 – land air temperature anomalies on a 5° x 5° grid-box basis (see Jones and Moberg, 2003 for details)
CRUTEM2v – variance adjusted version of CRUTEM2 (see Jones et al., 2001 for details of the variance adjustment method)
HadCRUT2 – combined land and marine [sea surface temperature (SST) anomalies from the Hadley Centre of the UK Meteorological Office, see Rayner et al. 2003 for details] temperature anomalies on a 5° x 5° grid-box basis
HadCRUT2v – variance adjusted version of HadCRUT2
Absolute – Absolute temperatures for the base period 1961-90 (see Jones et al., 1999 for details)
Do I understand correctly that records of past temperatures are being massaged?? As an historian, I’m both outraged & worried. Is there any way of retrieving/preserving the older, un’adjusted’ records??
#52: That what it certainly seems like. The problem here is that not only these people delete their old versions when they “move on”, but also slightly change the structure of data (e.g., grid cell locations as Jones did) which makes comparing hard. Sinan is trying to make a visualization of the changes in Jones’ data sets in the other thread. If he succeeds, we may see the degree of the problem. If someone is interested in comparing these old data sets, there are some additional data (e.g., 1992 GHCN Data Base) available here:
http://cdiac.ornl.gov/ftp/
#52. There are layers to this question – there are the original measurements – say daily max and min’s; let’s say that monthly averages are calculated and sent to CRU. The originating metorological service may have already done a “homogeneity adjustment”. Then CRU might make another adjustment. Brohan et al 2006 said that meta-data is lacking for many series that have been adjusted. Whether this represents adjustment by the originating service, by CRU or both is beyond my knowledge and would require audits (in the form of detailed spot checks) of individual station records. Of course we would have to know what stations are being used, but they refuse to disclose this information.
The next stage of aggregation is the compilation of annual global and NH averages. What we’re finding here is that the 2006 estimates for (say) 1938 temperature are lower than the 1988 estimates. Much of the time the past estimates were recorded electronically and the files are over-written as newer information becomes available. For example, the gridded data used in MBH98 was unavailable. I’ve been looking for digital forms of older versions and you can find odds and ends – for example, I found an old version of Hansen’s data in an example for an undergraduate statistics class in North Carolina. Some versions were preserved at john-daly.com. The original Hansen and Lebedeff 1987 data doesn’t appear to be online anywhere anymore. However, I located it in an extremely improbable place: in hard-copy in the original article.
I’ll try to post up some of the data sets that I’ve located.
#53. Jean S, the switch from 5×10 to 5×5 gridcells is a bit of a one off situation.
#54: Hansen and Lebedeff (1987) seems to be here (needs registering, haven’t tried):
http://dss.ucar.edu/datasets/ds283.0/
Re #52,
Sudha,
There is no indication that anyone is altering records of
“raw” or “original” temperature data.
When someone attempts to find “trends” in temperature data,
they often meet certain kinds of problems, sometimes due to
changes that occurred over many years. For example, the
times of day at which temperature observations were made may
have changed, the location of the thermometer may have
changed enough to give different readings than it would have
if the location remained the same. Also, estimating missing
observations can be regarded as an adjustment.
Some adjustments are clearly stated, as in the USHCN (United
States Historical Climatology Network), which lists raw
monthly averages, and separately lists results of various
adjustments to those monthly averages, month by month, year
by year. One may, or may not, be confident in their
adjustments, but they are clearly distinct from the raw
numbers.
Others may not be clear about the adjustments that they may
make, which would not much matter if their results were not
being used for major policy decisions.
JerryB:
Thanks for the clarification.
Do I understand correctly: Unknown ‘adjustments’ are made to ‘observed’ data, whose provenance _may_ have changed over long periods. And these ‘adjusted’ data are the basis of policy discussion/recommendation? And those who question this are treated as ‘fringe’ scientists?
Re #52:
JerryB,
Thanks very much for the clarification.
Do I understand correctly:
1. Over long periods, the provenance of the ‘raw’ data _may_ change. 2. In any case, unknown ‘adjustments’ are made. 3. These last are the basis for policy discussion/recommendation. 4. Questioners are, ipso facto, ‘fringe’ scientists. ??
Sudha,
I am concerned that a brief reply may mislead, but an adequate reply may
take me so long to compose that I won’t finish it. So, let me try
something, but be cautious about inferring too much from it.
A large amount of historical temperature data has been gathered into
something called GHCN (Global Historical Climatolgy Network). Various
sources were used for various lengths of time. How accurate the numbers
are is not clear. The exact locations often not clear. Multiple
sets of numbers occur for some locations, but when are different numbers
due to different sources, and when are they due to actually being for
different locations, is not clear.
GHCN monthly data
page linking PDF files describing GHCN
In any case, different people use various subsets of GHCN data to concoct
global, and hemispheric, temperature averages, usually in 5 by 5 latitude/
longitude grid cells. Some, such as GISS in the US, make it clear which
“locations” they use, and publish their adjustments location by location,
month by month. One may agree, or disagree, with their adjustments, but
you can see what the adjustments are.
For GISS see
for station data.
GISS station data processing is briefly discussed in the paper
“GISS analysis of surface temperature change”
linka
The paper “A closer look at United States and global surface temperature change”
linkb
discusses the inclusion of some USHCN adjustments (not including
estimates of missing data, and not including urban heat island
adjustments) into the GISS station data files.
On the other hand, CRU (Climate Research Unit) in the UK publishes grid
cell, and hemispheric, and global, average estimates, but does not
publish which stations they use, in what years, or with what adjustments.
For CRU see
but no station data
and at is an older
version, also with no station data.
Brohan et al
linkc briefly discusses recent changes of CRU versions.
A GRL paper, abstract at
linkd
compares some aspects of GISS, CRU, and NCDC(GHCN) grid cell concoctions,
and may, if not explain, suggest some reasons for some differences.
Now, back to the topic of this thread: one of the issues of historical
temperature adjustments concerns UHI, or UHIE (Urban Heat Island (Effect)).
One of the papers that claimed to support very little need for UHI
adjustment was Jones et al 1990, Jones being Phil Jones of CRU. It seems
that he has avoided publishing the names of the stations, and the
temperature numbers, used in that study, thereby preventing anyone from
checking his work.
The following link was missing from my previous comment:
“>
page linking PDF files describing GHCN
Some day I will learn to proof read better.
page linking PDF files describing GHCN
Re # 59, 60, 61
JerryB
Thanks very very much for all the trouble! I’ll look carefully at the refs.
One comment: if CRU & Jones et al don’t give the origins of their data, this is ?analogous to an historian writing something but not giving the documents on which it’s based…(?)
It may be analogous to the historian saying that the supporting
documentation can be found somewhere in a large library.
In another thread
East Anglia Refusal Letter
Steve posted a reply from the University of East Anglia,
at which CRU is located, and that reply indicated that
the data are somewhere in GHCN, so Jones is not required
to be more specific.
One Trackback
[…] sites at climateaudit, noting that questions about these claims were raised here (for example, here here and here . Since then, we’ve also looked at adjustments in the USHCN, GHCN and GISS networks, […]