Kaufman and the PAGES2K Arctic2K group recently published a series of major corrections to their database, some of which directly respond to Climate Audit criticism. The resulting reconstruction has been substantially revised with substantially increased medieval warmth. His correction of the contaminated Igaliku series is unfortunately incomplete and other defects remain.

In several Climate Audit posts, I criticized PAGES2K for using Miller’s Hvitarvatn, Iceland varve data, upside down to the interpretation of the original author, an eminent paleo-scientist (see here; here). Kaufman stated that they “corrected temperature relation” of the Hvitarvatn series:
The interpreted temperature relation of the series from Hvítárvatn was corrected from positive to negative.
The series as now reoriented is shown at left.
This confirmation of my interpretation is of considerable interest to me, since there seems to be a close relationship between the Iceland varve series and Baffin Island varve series, a location of considerable interest from a multiproxy perspective, as discussed in a previous post here, where I showed the close relationship between the Hvitarvatn, Iceland varve thickness series and the Big Round Lake, Baffin Island varve thickness as below. PAGES2K is in the awkward position of orienting the Hvitarvatn in an opposite orientation to their orientation of Big Round Lake, though the two series are evidently responding similarly. It is surely unacceptable for assessment-quality studies to leave such inconsistencies unresolved.

Figure 1. Varve thickness (mm). Purple – Hvítárvatn from Miller et al 2012 Figure 2D; blue – Big Round Lake (NCDC sheet 7 column 4) 30-year running mean. Both shown on same mm scale. See here.
I also severely criticized PAGES2K’s use of a sediment series from Igaliku, Greenland that had been contaminated by modern agricultural runoff – an issue that one would have expected them to be attentive to, given the previous issues with Korttajarvi. For this record, they state:
removed two most recent values due to anthropogenic fertilizer influence
In my previous post on the series, I showed the following plot from original NOAA data, showing three contaminated points, showing in red a datapoint not included in the PAGES2K version. So when they say that they removed the “two most recent values due to anthropogenic fertilizer influence”, they did not remove the two “most recent” values from their previous dataset, but only one value from the PAGES2K, still leaving the series contaminated. This is the largest HS-series in the dataset and it is disquieting that it continues to be contaminated. (They also changed the dating of the series by up to 108 years in some places – not sure why.)

Kaufman’s footnotes to Table 1 state that they “restricted” four series “to temperature-sensitive section” – a post-hoc adjustment that warrants closer examination. The adjusted series are: Blue Lake, Alaska varve thickness (from 5 to 730); Forfjorddalen 2 tree rings (from 877 to 1254); Lower Lena, Russia tree rings (from 1408 to 1490); and Coppermine tree rings (from 1048 to 1288).
As an example for this sort of adjustment, they gave Korttajarvi, well known to Climate Audit readers, where agricultural contamination is readily understood. However, it seems odd that series can be determined, after the fact, to go in and out of being “temperature sensitive” in their early portions and these exclusions warrant some attention. If these factors impact the early portion, how do the specialists ensure that they do not impact the later portion.
The Blue Lake series has elevated values in the early portion, which are now removed as not “temperature sensitive”. I understand that these lake sediment series are inhomogeneous – that’s one of the large problems in using them as continuous temperature proxies – but similar or greater inhomogeneities have been observed in the Iceberg Lake series, which go the “right” way and which have been ignored (See here and prior discussion of Iceberg Lake here.)
Kaufman removed three lake sediment series as “not temperature sensitive”: East Lake, Melville Island particle size; Kepler, Alaska d18O; and Holsteinborg, Greenland Fragilariopsis cylindrus. I’ll look at these series some time.
These various lake sediment series have been the most prominent “new” thousand-year proxies in the past 7 or 8 years, but they are fraught with difficulties in terms of interpretation as temperature proxies, with post-hoc interpretation rife.
In a CA post almost immediately following PAGES2K, I observed that there was longer data available for the Lomonosovfonna, Svalbard ice core (Divine 2011); this has now been incorporated.
They incorporated a new versions for Gulf of Alaska tree rings (Wiles et al 2014) and changed their Tornetrask version from Grudd’s reconstruction with high MWP values, to CRU’s most recent rival version (Melvin) which has higher modern values. However, they continued to use the older supersticked version of Yamal, rather than the more recent much-attenuated version of Briffa et al 2013.
I haven’t been able to locate a digital version of their revised reconstruction, but the before-and-after is shown in their Figure 2 here, indicating a substantial upward revision in their medieval reconstruction and downward revision in their modern reconstruction. Jean S draws our attention to the fact that the scales of the two versions are inconsistent in the diagram: I don’t know why at present.
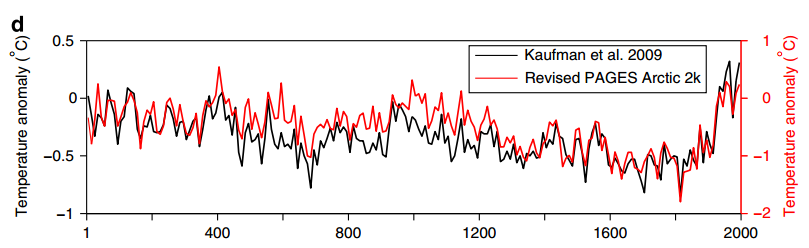
Original Caption: Effect of revising the PAGES Arctic 2k database on the Arctic annual temperature reconstruction published recently by the PAGES 2k Consortium … (d) Comparison between Kaufman et al.7 Arctic—wide temperature reconstruction and the revised PAGES 2k Arctic reconstruction (averaged to decadal values). Note the factor-of-two difference in the temperature scales.
They show the following diagram of changes – all in the direction of increasing MWP warmth relative to modern warmth in their reconstruction. These are large changes from seemingly simple changes in individual proxies – a longstanding CA theme.
There is much of interest both in the data and the changes. The dataset is considerably more ambiguous than PAGES2K proponents recognize, though the scope of Kaufman’s changes may change some of these perceptions. And, finally, kudos to Darrell Kaufman for chinning up to errors like upside-down Hvitarvatn and Igaliku, as he did with upside-down Tiljander. I can’t imagine that it was very easy for him to face up to these mistakes, but it’s a far better practice than trying to tough it out by sliming his critics, a la Mann.


70 Comments
Indeed. And, much more, to the writer. Audit doesn’t seem a hollow joke this time.
Penultimate para incomplete
Why do they have different temperature scales for Kaufman 2009 (black) and PAGES 2K (red)????
Edit: The figure caption has ” Note the factor-of-two difference in the temperature scales.” What is this?
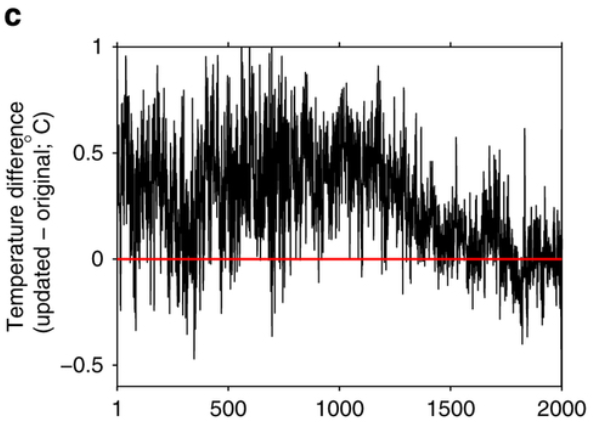
Steve: Dunno. I;ve added in the original caption as well as FIgure 1C showing the differences. The article mentions use of PAICO – a method that I haven’t parsed. Perhaps they changed method as well as data. If so, makes one wonder why. I haven’t located a digital version of the recon.
Eyeballing their Fig. 2a and Fig. 3g of Kaufman et al (2009) it appears that the scales are correct. Unbelievable. Darrell’s trick?
Why are you showing differences to Kaufman (2009) [fig 2d] rather than differences to PAGES2K(2013) [fig 2a]? Isn’t the latter more relevant to the changes noted? (And also, you show fig 2c, which is the arithmetic difference of the update to PAGES2K(2013).)
The changes to their PAGES recon (fig 2c) appear to be about the size of the Kaufman et al (2009) recon … so it appears (unless there is something I’ve missed) 1) these changes to PAGES2k recon are not minor 2) PAGES2k totally kills Kaufman et al 2009 (too little low freq variability). Here’s the whole picture we are talking about:

Here’s Kaufman et al (2009) Figure S4 from their correction:

The black line (n=23) seems to match to “Kaufman et al. 2009” curve (black) in Fig 2d and so does the scale! This is indeed a new trick: plot two temperature curves with different scales in the same figure. Amazing.
there’s something weird in the size of the adjustment. I’ve looked at the series involved – the CA issues (Igaliku, Hvitarvatn, Lomonosovfonna) all increase medieval; the Blue Lake change removes early warmth, but the other changes all, at a very quick look, are sort-of neutral or increasing modern-medieval difference.
The size of the change is over 0.5 deg in most of the medieval period and this seems a lot relative to the number of series involved. I could do a quick CPS on the proxies, but I think that they did a complicated procedure Paico, for which I dont have code.
Although Darrell’s scale trick in Fig 2d does not seem to interest anyone, here’s anyway comparision of Kaufman et al. 2009 and the original (I cant either locate the update) PAGES2k Arctic recon plotted on the same scale:

What is a good English word for the lack of variability? I’m trying to think what Darrell was trying to hide … 😉
Here is a plot comparing the PAGES2K series for Hvitarvatn and Big Round, both in PAGES2K orientation. Paleoclimatologists interpret this information as a sign of regional variability.
The different scales remind me of the seven graphs at AR5 WG1 Fig. 5.12. Temp anomalies 1500 – 1850 are in red; temp anomalies for 1881 – 1980 are in black. Each graph is centered on the red at zero. Every black zero is offset to a different space, the Arctic being the worst at about .7 degree. Why, I do not know, but the two scalings of these graphs appear to be proportional, one degree in red equaling one in black..unlike the “d” graph above.
Steve, PaiCo Matlab code is here. It is pretty much turn-key, IMO nicely written, and I didn’t have any problems with it when I played a little bit with it a year and half ago. In the original PAGES2k there was quite a big difference between their actual recons and PaiCo recons, but they hid it by using SD units in the SI comparisions, see my comment from the time. If I recall right, PaiCo was the main method only for this Arctic recon, but which, on the other hand, was not in line with Hanhijärvi’s Arctic Atlantic PaiCo recon:

Eyeballing that to the revised PAGES2k Arctic recon, I see “remarkable similarity”.
Jean S asked:
“What is a good English word for the lack of variability?”
Dampened. (I could not come up with one that rhymes with “decline.”)
“Hide the Harmony”
JeanS
Thanks for your revised graphic plotting the two versions to the same scale. Visually, it makes sense of graph C.
Although the revised reconstruction may still have issues, it does quite accurately, in time, show the Maunder and Dalton minimums, along with the early and late twentieth century warming periods. It is the relative size of these changes that the biggest questions lie. For instance, global temperature series, such as HADCRUT4, show the warming of 1976-1998 to be slightly larger than that of 1911-1944, whereas the Arctic reconstruction has the later warming half the size of the former. Providing answers to this type of question might provide insights into both proxy reconstructions and thermometer-based average temperature anomalies.
Jean S: “Graph C” is the difference between PAGES2k original (2013) and the newly updated arctic reconstruction. My plot has the PAGES2k original and the Kaufman et al (2009) (corrected) reconstruction.
Here’s my plot of the archived PAGES2K (thin black) onto the 2014 figure. WHen I was doing this, I didn’t appreciate that the thick black if Kaufman 2009 – I had jumped to the conclusion that it was PAGES2K 2013. These are very consequential changes to their reconstruction. Must have been some tight sphincters in Kaufman-land.
We can almost say that the medieval warm period was warmer than now! What heresy!
We have to get rid of the medieval warm period!
Nobody likes a sweaty knight.
Steve,
Is the black scaling correct in this graph? Just looking at the last value, in fig 2 at the bottom of the article the eyeball value is ~0.3 and for your graph in the comment it is ~0.6.
Steve: they are in Standard deviation units, since PAGES has one series as “deg C” and one as negative “mm thick”. I wanted to show them in the same scale.
.
The difference in scales is really puzzling. Couldn’t someone contact Kaufman and ask for his reasons for this? Who knows, maybe he’ll answer.
In the acknowledgements section, it states: “We thank those who discovered and shared errors and updates to the original PAGES Arctic 2k database.” However, there is no mention of Steve. As noted previously here, Steve is “He Who Must Not Be Named” over at RC.
It is positive sign, however, that there is an effort to admit mistakes and correct them in this paper.
Steve — At a glance, I didn’t locate the recent corrections to the data. The linked web page at Nature says “Published online 19 August 2014.” Were the changes you discuss made after that date?
> As an example for this sort of adjustment, [McKay and Kaufman] gave Korttajarvi, well known to Climate Audit readers, where agricultural contamination is readily understood.
Yes, they remove data points post-1720, per the text of the Tiljander et al article. (Graph-gazing suggests that land-use changes didn’t substantially affect the varved sediments until many decades later, but that is a quibble, and a prospective rule like “do as the primary authors suggest” avoids the pitfalls of post-hoc analysis — the main point.)
A separate take-home lesson about Tiljander is that there were other problems for these “proxies” beyond the two screamers of Upside-down and Uncalibratable. These included extrapolation of the data series beyond its endpoint, conflating primary data with calculated numbers, and misunderstanding of the number of degrees of freedom in the four time-series categories that Tiljander submitted to the public database.
One hopes that McKay and Kaufman understand these new proxies more intimately than the authors of Mann et al (2008) understood the Lake Korttajarvi varves.
Steve: there’s a fresh data archive at NOAA under PAGES2K
Isn’t it now the case that none of the regional Pages 2K have a hockey stick?
I haven’t been able to locate digital versions of the regionally weighted PAGES2K reconstruction as plotted in their SI. Has anyone else noticed it?
Indeed three series were removed [orig. Arc_21, 46, 56}. I noticed substantial changes to the “youngest” data of the proxies between the original and the new set linked to above: Arc_7, 2002 [orig.]-2010 {new]; 12, 2004-2010; 14, 2004-1800; 26, 1995-1800; 31, 1985-1720; 47, 1948-1949; 48, 2004-2003; 53, 1983-1984.
FYI, Arc_12 = Tornetrask tree rings; 14 = Finnish varve; 26 = Finnish lake sediment; 31 = Finnish lake sediment.
Oldest data entries were changed for four proxies between the original and the new: Arc_1, 9 [orig.] – 730 [new]; 6, 1140 – 1288; 7, 724 – 800; 12, 500 – 39BC (“-39”).
Arc_1 = Alaska varve; 6 and 7 Alaskan tree rings; 12 = Tornetrask.
Arc_48’s original oldest data date is “-12523.6606.” The new version shows “###”
Reviewing the original PAGES2k Consortium (2013) paper I noticed at Table 1 the “time period” for N. American tree ring reconstruction is “1204-1974.” I earlier queried why the AR5 WG1 Fig. 5.12 N. American tree ring data (faint gray line) cut off about 1970. Here’s the answer: because of the underlying paper’s data. However, both colorfully bold graphs at PAGES2k (2013) Fig. 2, both the temp. anomalies and proxy counts, depict the North American tree data extending to 2000. Compare the data representation for N. American pollen – it ends in 1950 (for open reasons stated in single underlying published study). But more than a depiction criticism, how was “1974” selected to be the end date? Other regional reconstructions end on or around 2000, though Asia is a iffy at 1989. I see nothing in the listed youngest dates for the 146 N. American tree proxies that would lobby for such an early (and odd) endpoint date as 1974.
Steve: the North American tree ring study is a bizarre study. Paleoclimatologists should be embarrassed that a 2013 study ends in 1974, when studies 16 years ago ended in 1980. Plus they’ve continued to use Graybill bristlecone data: we know that these have a HS shape – so the study adds nothing.
I am looking at the PAGES supplement. Everything the text says about the NA tree recon would push one to believe, expect, and trust that the product delivered would extend to “1987.” “1987” is mentioned ten times for the “reconstruction.” The proxy data also goes to 1987. Interesting is the S2 NA tree and pollen graph. The pollen data ends at 1950, and the tree data looks like it ends around 1987 or about. The latter shows continual decline since a peak in the 1950’s.
But in the published PAGES (2013) article, such details are hard to discern due to the ostentatious pregnancy (litmus?) test strip graphic style. But in the Metadata (Table 2, not “1” I said above) the extent date, that is the last data that is actually used, is clearly stated as “1974”. This date compares well with the NA pollen and tree graph at AR5 WG1 fig. 12. Noting the pollen data ends at 1950, the tree data ends no later than the middle of the 2nd half of the century, i.e., about “1974”. Had fig. 12’s light gray line reflected data to 1987, I assume its decline would continue, not comporting with the overlain instrumental data. I sense woodchucks.
As for the multi-colored pregnancy test strip graphic, chucking wood after 1974 might have the effect–just more speculation ‘natch– of.. color change. Maybe some woodchucks did not want some blue hue divergence marring the palette of optic climatic rhetoric.
Like any temperature reconstruction, whether it does a hockey stick or shows a middle age warming period, I would want to understand how the proxies were selected and the data manipulated.
“Three records were removed because of insufficient evidence that they are sensitive to temperature20,21,22”
I did not see an explanation on how proxies were selected.
“Overall, the reconstruction and records as a whole appear more representative of annual than either winter or summer temperatures. This is not because the records are sensing annual temperatures, rather, it is likely an artifact of including both summer and winter sensitive records in the compilation.”
If that is the case then I think this reconstruction of the Arctic region does not agree with polar amplification seen in the instrumental record for 60N-90N. Gridlines would have made the estimation easier but I see no trend in the Arctic region from approximately 1930-2000.
“Finally, it should be noted that whereas these analyses are useful for quantifying some aspects of temperature sensitivity, they are poorly suited to determine the extent to which the records reflect long-term (centuries to millennia) changes in past temperature, or the stability of the modern relation back through time.”
No reasons given for this speculation, but I think it was kind of expected given the lack of an unprecedented modern warming period in the reconstruction. What was the purpose of this revised reconstruction and has it become different than the original?
Reblogged this on I Didn't Ask To Be a Blog.
The image for Miller’s Hvitarvatn, Iceland varve data is shown reversed/mirror image. Was that intentional?
Steve: yes, they flipped the series over in the revised version.
A lot of these decisions (like whether to include a series, or just part of a sample, or even a single time interval, etc.) originate with the authors themselves who publish the series they archived, along with their recommendations on how/where/if it is sensitive to temperature.
These recent updates, are they all (or some):
– A reflection of new attentiveness to the original publisher’s recommendations regarding their data;
– A reflection of new determinations about the data as newly published by the original authors;
– A reflection of the opinions of PAGES2k with regard to various series, with or without regard to the original publishers.
It had been most often an issue where skeptics had protested the inclusion/exclusion of certain proxy data on what seems reasonable grounds, but were insta-denied (perhaps reasonably) by way of the original author’s recommendations. However, it seems others have been given more license.
Curiously that suspiciously large jump at the end seems pre-1950, ie before the canonical IPCC 1950 cut-off and then there is just a plateau. So while they can still claim rapid rate of change it seems to be significantly at odds with the official IPCC mankind-must-be-responsible-because-we cannot-think-of-anything-else fallacy. At least they didn’t do the usual paleo-trick of inappropriate splice/overlay of temperature records. I don’t rule out a sneaky change of baseline in spin-off publications though.
I noticed that too. Curious.
“Note the factor-of-two difference in the temperature scales.”
Seems this is designed to hide the massive changes in the reconstruction. Note the the minimum achieved in the early 1800s.
That single chart tells me absolutely all I need to know about these folks.
From the article above – “They incorporated a new versions for Gulf of Alaska tree rings (Wiles et al 2014) and changed their Tornetrask version from Grudd’s reconstruction with high MWP values, to CRU’s most recent rival version (Melvin) which has higher modern values. However, they continued to use the older supersticked version of Yamal, rather than the more recent much-attenuated version of Briffa et al 2013.”
Steve & Jean S – Any thoughts on the above and the impications of assertaining whether the wmp was warmer or cooler than today.
(my recollection is that a) you are somewhat neutral on the relative temps today vs the mwp and b) that the various hs reconstructions provide limited insight into the question. my apologies if i misstated your thoughts on the matter)
Steve: I’ve spent a lot of time recently looking at the MWP in a Holocene context rather than a 1500 year context. It is not “loud” in an Holocene context. What seems more surprising to me in a Holocene context is that the modern period isn’t as “loud” in the proxies as one would expect (alkenones, d18O). However, when you press the proxies, there always seem to be issues that qualify comparisons, so it’s hard to get to conclusions.
The contrast of the holocene period and either the mwp or the current wp is large/loud whereas the contrast between the mwp and cwp would tend to be inconclusive. I am aware of drift wood discovered on the northern coast of greenland which was carbon dated 4-6k years old which would indicate the artic was completely or near completely ice free during that period which we are no where close to today. thanks for the info
The updated data for the Arctic is in agreement with my long-held belief that the Arctic during the MWP was similar to a longer duration ETCW.
A recent paper has shown you can simulate these events in the Arctic:
“Pronounced positive decadal-scale temperature anomalies occurred in the Arctic region in the first half of the twentieth century, an episode known as the early twentieth century warming (ETCW). Analyzing a 3,000-year unperturbed climate simulation performed with the Max Planck Institute Earth System Model, we demonstrate that internal variability of the Northern Hemisphere climate system is sufficient to reproduce warm events matching the observed ETCW. We perform a superposed epoch analysis on simulated data and identify 26 Arctic warming episodes compatible with the ETCW. The simulated events reproduce, in their ensemble average, magnitude as well as spatial and temporal extent of the observed ETCW. In individual realizations, the ETCW-like events indicate that different patterns of internally generated decadal Arctic warming are possible, including pan-Arctic warming events. We investigate the dynamics that typically lead to the simulated warming events: positive oceanic heat transport anomalies that form in the North Atlantic initialize the warming events and trigger an ocean-ice-albedo feedback in the Barents Sea region. The consequent reduction in sea-ice extent leads to enhanced multi-year surface warming through strengthened ocean heat release to the atmosphere. The oceanic heat transport anomalies reduce to pre-event levels around the year of the maximum warming. However, the warming events typically lasts for another 5–7 years until the sea-ice extent recovers to pre-event conditions.”
http://link.springer.com/article/10.1007%2Fs00382-013-2004-5
From another interesting and relevant paper with 81 dates of organic material exposed by receding glaciers and snow patches:
“Most alpine glaciers in the Northern Hemisphere reached their maximum extents of the Holocene between ad 1600 and 1850. Since the late 1800s, however, glaciers have thinned and retreated, mainly because of atmospheric warming. Glacier retreat in western Canada and other regions is exposing subfossil tree stumps, soils and plant detritus that, until recently, were beneath tens to hundreds of metres of ice. In addition, human artefacts and caribou dung are emerging from permanent snow patches many thousands of years after they were entombed. Dating of these materials indicates that many of these glaciers and snow patches are smaller today than at any time in the past several thousand years. This evidence, in turn, suggests that glacier recession in the 20th century is unprecedented during the past several millennia and that glaciers in western Canada have reached minimum extents only 150–300 years after they achieved their maximum Holocene extents.”
http://hol.sagepub.com/content/early/2014/09/26/0959683614551214.abstract
Robert, thanks for commenting on this. I know that you have a specific interest in Baffin Island.
I’ve commented from time to time on evidence from retreating glaciers and believe that I’ve been pretty consistent in saying that this sort of evidence is the sort of evidence that one can reasonably use to ground-truth one’s perspective on past paleoclimate change in the Holocene. Here are a couple of early CA posts on stratigraphy in glacial retreat (disapproving of the lack of stratigraphic context in Lonnie Thompson’s work at Quelccaya.)
I’ve spent a lot of time recently looking at proxies in a Holocene context and the MWP, as I mentioned a few comments ago, is not a loud event in Holocene terms. Your ETCW analogy seems apt.
I’ve generally found Gifford Miller’s work to be interesting. BTW I’m amazed that Kaufman actually corrected the Hvitarvatn orientation in the PAGES2K to match Miller’s article – I guess I’ve gotten to expect shut-eyed-obfuscation. But, as I mentioned, it has a knock-on impact on a very widely used Baffin Island proxy, the Big Round Lake varve series. Regardless of what one’s interpretation of past history may be, there’s no possible way that Hvitarvatn and Big Round Lake varve series can both be temperature proxies in their present opposite oriented interpretations. I think that Gifford Miller’s interpretation of Hvitarvatn makes sense in terms of what we know (or think we know) of the Little Ice Age and that the Big Round Lake series will have to be interpreted the same way – which will mean flipping over the Big Round series as a proxy. Does that make sense to you from a Baffin Island perspective?
I’m not terribly familiar with the specific details of the proxies in question but my general knowledge of the LIA in the western North Atlantic glaciers were typically at their LIA maximums between ~1870 and ~1920 AD (Muller, 1980; Dowdeswell, 1984; Hagen and Liestøl, 1990; Dowdeswell et al, 2007; Citterio et al, 2009; Davis et al, 2009; Paul and Svoboda, 2009).
Ice caps are much easier to interpret the interaction between advance/recession and climate as opposed to glaciers. In particular in the Canadian Arctic where ice losses are strongly related to surface mass balance (melt) rather than outlet glacier discharge (e.g. Antarctica).
Generally speaking the maximum extents of glaciers in the western North Atlantic regions occurred in the late 1800s which is consistent with Miller at al’s (2012) interpretation of the Hvítárvatn series and inconsistent with an inverted interpretation of Big Round Lake as compared to Hvítárvatn.
Like I said, I’m not an expert on the series in question so I should probably read up more on the series in question before making any strong statement on its usage.
Those things being said – the interpretation of substantial glacier melt during the MWP in the Canadian Arctic is nothing surprising. Neither is the interpretation of widespread ice expansion until the early 1900s. However, I do not see how post-2000s melt in the Canadian Arctic occurs in an unforced climate under a non-hypsithermal orbital alignment.
Robert,
I wrote some posts in 2006 about Holocene material being disgorged from retreating glaciers. The ice patch research that you cite (based on a quick look), most of which is subsequent to this, certainly strengthens the case for present retreat exceeding medieval retreat. From a Holocene perspective, I think that the LIA is surprisingly loud and it’s not so much that the MWP was an upward blip, though there seems to be some, but that it was a warmer predecessor to the LIA.
Treelines have also been advancing in the 20th century, but in some places are still below medieval treelines, though the present “potential” treeline may well be higher. I’d suggested to IPCC in 2006 that this be reviewed, but they refused. I think that this is too bad, as I think that one might be able to find firm ground on this sort of discussion.
The handling of proxies in proxy reconstructions is hugely frustrating. I think that analysis of multiple proxies is important, but that each class has to be parsed and fisked carefully before trying to do multivariate analysis of large datasets.
If you have time to parse the Round Lake dataset – which is used in many recent reconstructions – against the Hvitarvatn interpretation now conceded by PAGES2K, it is relevant to your work in Baffin Island. I think that it is consistent with Miller’s moss work in Baffin Island as well.
in looking at things from a Holocene perspective, I’m actually a little surprised that the modern warming doesn’t give a louder signal in holocene ice cores.
A useful time to remember that the higher the climate sensitivity to CO2, the lower the temperature we would now be without anthro effect. We’d better hope the temperature recovery has been dominated by nature, for we have only so many hydrocarbon bonds left to burn.
==============
My experience with ice patches on my lawn over the course of a winter is that heavy/dark objects placed on the ice early in the season will end up under the ice patch by the end of the season. I’ll have to read Robert’s linked reference.
Robert, any comments on the updated Arctic temperature reconstruction estimate of the last 50-70 years anomalies in the 20th century in comparison with the Cowtan and Way data sets for the Arctic region? I thought you might be particularly interested since your data sets are different than the commonly used ones by showing an accelerated polar amplification in the Arctic.
“And, finally, kudos to Darrell Kaufman for chinning up to errors like upside-down Hvitarvatn and Igaliku, as he did with upside-down Tiljander.”
I will second that comment. Darrell Kaufman must be a man of integrity.
Jean S asked Posted Oct 1, 2014 at 3:37 PM | Permalink
What is a good English word for the lack of variability? I’m trying to think what Darrell was trying to hide … 😉
perseveration, a tendency to repeat what has just been done, or as a lack of variability
perseveration, a tendency to repeat what has just been done, or as a lack of variability
My head spins – some of you, especially McIntyre, are really steeped in this stuff (both analysis techniques and specific studies). Great to have your expertise online.
I just had a look at the Igaliku data in the database zip-file. Now the last point is 1649 from 1970.
Steve: yes, I looked at this file carefully before saying anything about it. This is only one less point than the 2013 file even though they said that they removed two points. The 2013 file did not include the last point in the NOAA file and they might have got mixed up. The bottom line is that the 1970 point is impacted by agricultural runoff. It’s a stupid series to use, especially given all the publicity over Mann’s use of similarly contaminated data (upside down Tiljander). To comply with their statement that they had dealt with contamination, they need to remove the 1970 point as well, which peels the series back to 1916 or so. The series doesn’t even meet their resolution standards of 50 years, so it’s hard to understand why it’s in.
Given the large effects on this reconstruction from the changes thus far, I think that removal of this single contaminated point will have a noticeable impact on their reconstruction. Unfortunately they’ve used a novel method and I don’t have code to test the impact. Jean S will eventually look at it (he uses Matlab).
Although some people say that these issues only impact the “regional” reconstruction, the Arctic recon had the largest HS and the reductions will impact the overall recon (which has its own share of stupidity that is another topic.)
The difference between PAGES Arctic and Hanhijärvi et al seems (reading from graphics), however to build up during 1860-1940, too early to have much contribution from this point with 50 year smoothing.
Steve: There is some “high-frequency” variation in the differences and I suspect that you’re seeing its effect. I don’t think that it is possible to get to the observed differences without the individual series with the most extreme sigmas making a substantial impact – doesn’t make sense. We’ll know better when Jean S has time to run some variations in Matlab.
> Kaufman and the PAGES2K Arctic2K group recently published a series of major corrections […]
Under “published” there’s a link to this page:
http://www.nature.com/articles/sdata201426
The names of the authors are Nicholas P. McKay & Darrell S. Kaufman.
Under “Corresponding author” we read “Correspondence to Nicholas P. McKay.”
Under “Contributions” we read that “N.P.M. updated the chronologies, generated age ensembles, and formatted the data.”
Why name Kaufman?
Willard, as usual, trying to divert.
Read your own link Willard:
“How to cite this article: McKay, N. P. and Kaufman”
“Contributions: N.P.M. and D.S.K. designed the study and prepared the manuscript.”
And yet I bet you’ll object to the suggestion that you are trolling!
Which part of “N.P.M. updated the chronologies” do you not get, Mooloo?
The bit where you think NPM did it all by himself, without reference to Kaufman. Despite Kaufman being listed in the citation, and having prepared the manuscript. And despite them working at the same university.
That the junior did the actual leg work is not really an issue. Or do you think Kaufman did all the heavy lifting in the original paper?
Could you please stop worrying about trivial side issues, and discuss the major points. Or is that actually the best critique of this post that you have?
Please tell me more about what I think, Mooloo, that ought to get to “the” issue.
In the author information section of the Pages 2K study we can read:
> Arctic: A.A.K., D.S.K. & S.T.H. coordinated the study. S.T.H, D.S.K. & F.C.L. collected and reviewed the proxy data; S.T.H. calculated the reconstruction and managed data.
http://www.nature.com/ngeo/journal/v6/n5/abs/ngeo1797.html#author-information
If there was any problem with the reconstruction based on Arctic data, S.T.H. would deserve at least a mention, don’t you think?
Something’s amiss.
Steve: at this stage, we don’t have enough information to allocate blame as between Kaufman and the junior authors. I agree with your point that Hanhijarvi, together with Kaufman and Ljungqvist, “collected and reviewed” the proxy data. Kaufman was clearly the senior author and the contaminated Igaliku data came from Kaufman’s JOPL collection. Should Hanhijarvi have been aware of and vigorously protested Kaufman’s inclusion of contaminated data? Perhaps. But my guess would be that Hanhijarvi is doing the technical processing and that he presumed that Kaufman knew what he was doing. Even if Hanhijarvi has some secondary responsibility, the primary responsibility for inclusion of contaminated data is clearly Kaufman’s. But even if it was the responsiblity of a junior and Kaufman was merely negligent in the first instance, Kaufman was well aware of the contamination at the time of McKay and Kaufman and ought to have fully removed the contamination at that time.
Hanhijärvi presented his doctoral thesis on Multiple Hypothesis Testing in Pattern Discovery in 2012. There wasn’t anything on climate science in it. Now he has left academia and is working for Sanoma, the largest private media house in Finland applying his data mining knowledge to yet another field.
The unavoidable conclusions is that his contribution was almost totally restricted to the development of the PaiCo method. That he contributed also to the related data handling task of creating the database, is natural.
Pekka, on your sharp-eyed earlier observation wondering about the impact of Igaliku given that the effect seemed to have been implemented by 1940: Jean S has been doing some interesting experiments with paico that we will report soon. His experiments have been on the H13 dataset, but it looks like the low-resolution data may not have as large an effect as people (including me) had thought. Also inversion of single series can have a large impact. Therefore, at this point, it looks like it was the inversion of Hvitarvatn that had the largest impact. More on this next week.
Steve,
Having looked a little at the PaiCo method, I think that it’s rather insensitive to extreme outliers, because it’s based only on the ordering of the values. Thus the largest value is nothing more than the largest value how ever large the difference from the other values.
Yes, that’s correct. It is essentially an order statistic based method, and does not care about amplitudes.
as a sort of confirmation, the paico arctic reconstruction doesn’t have the closing extreme values of the Arctic “basic composite”.
I have also downloaded the PaiCo code. I got it running by commenting out a couple of lines used to tell about the progress of the calculation (the problem may be related to the version of Matlab, I have the latest 2014b). I started something called “Simple Experiment” about 9 hours ago. Then I noted that every example is expected to take long. On my slightly outdated PC that might be around 24 hours. Thus I don’t know yet, whether that example runs correctly. Perhaps I know more tomorrow morning Finnish time.
I havent’t even started to look on the details of setting up an production run.
Pekka, it’s not worth running the “Simple Experiment” as it is running all the algorithms tested in the paper (that’s why it takes so long). Start with the “runArcticAtlantic” (generates the recon), and once you figure out the input, it’s rather easyto experiment with the method.
Jean S,
I realized that when I returned home (I started the test just before I had to go). I just thought that I might let it run anyway, but some of the steps are likely to take too long (LNA, perhaps some others as well).
Did the Progress Monitor work for you? I’m not very fluent with Matlab, although I have used to some extent. There are simpler progress monitors that could be used instead. Adding Java on top of the rest seems also excessive.
Kaufman was not only lead author of the PAGES2K Arctic section, but the corresponding author for PAGES2K-2013 as a whole. He should take responsibility for issuing a corrigendum. By failing to issue a corrigendum, the incorrect results continue in circulation – a tactic that Mann also used in connection with contaminated data in Mann et al 2008. Amazingly, Nature has not even required Kaufman to archive the corrected results. I asked them to place the revisions online, but they told me that it was up to me to try to get the information from the authors – exactly the opposite of what should be going on with a corrigendum.
> Kaufman was not only lead author of the PAGES2K Arctic section […]
The first initials to appear are “A.A.K.” which indicates that Korhola may be the lead author for the Arctic section, if there was a lead between A.A.K., D.S.K., and S.T.H.. It does not seem an alphabetical order.
We could argue, though, that D.S.K. led the synthesis, and so he should “take responsibility,” whatever that means. This might seem plausible, although this might have repercussions in previous episodes. Or perhaps D.S.K. should take responsibility because he’s the corresponding author?
Steve: your point about Korhola’s involvement is interesting. Given Korhola’s strong condemnation of Mann’s use of contaminated data, he ought to be (and behind closed doors probably is) very embarrassed at being associated with the similar use of contaminated data himself in PAGES2K. He ought to be furious with Kaufman and doubly furious at their failure to fully correct the contamination in their amendment. He should therefore be very forceful in requiring Kaufman to properly correct the analysis without using the contaminated data. It would be worth drawing this to his attention.
Before discussing matters of embarrassment, it should be salutory to acknowledge that Korhola ought to “take responsibility” for the Arctic data, some of which was upside-down, along with D.S.K. and S.T.H., whether or not A.A.K. was the lead author of the Arctic section.
D.S.K. might not be the lead author of the Arctic section, or if he is it’s along with A.A.K. and S.T.H., in which all the authors could be said to be lead authors. This is not impossible if we consider that Gremlins could be involved.
***
We should also point out that in the section **Acknowledgement** of MK14, Sami Hanhijärvi and Atte Korhola are being thanked “for compiling the original version of the PAGES Arctic 2k database”.
http://www.nature.com/articles/sdata201426#acknowledgements
Acknowledging this ought to be salutory too.
Willard
Do you think it is necessary for someone to issue a Corrigendum, and if so who would be responsible for issuing it?
Put another way, who is responsible for the decision to *not* issue a corrigendum? In my mind, that is the person who deserves the ‘credit’ for this situation.
> [A]t this stage, we don’t have enough information to allocate blame as between Kaufman and the junior authors.
Hanhijärvi and Korhola may not qualify as juniors in the same way, but instead of wondering about what “being a junior” means, it might be more circumspect (let alone salutory in terms of time management) to leave such allocation problems to professional blamers like lawyers, and to simply assume that authors are to be “held responsible” for what they undersign, which is one of the reasons why we have authorship in the first place.
4 Trackbacks
[…] The PAGES2k group rediscovers the medieval warm period. ClimateAudit […]
[…] Climateaudit reports […]
[…] plot or check the revised reconstruction at the time of my original post on the amendments (see here). I asked Nature to require Kaufman to archive the revisions. Initially, Nature asked me to try […]
[…] to their PAGES2K Arctic database of paleoclimate data. The series started with McIntyre’s Revisions to Pages2K Arctic back on October […]