Kaufman and paleo peer reviewers ought to be aware that the recent portion of varve data can be contaminated by modern agriculture, as this was a contentious issue in relation to Mann et al 2008 (Upside Down Mann) and Kaufman et al 2009. Nonetheless, Kaufman et al 2013 (PAGES), despite dozens of coauthors and peer review at the two most prominent science journals, committed precisely the same mistake as his earlier article, though the location of the contaminated data is different.
The contaminated series is readily identified as an outlier through a simple inspection of the data. The evidence of contamination by recent agriculture in the specialist articles is completely unequivocal. This sort of mistake shouldn’t be that hard to spot even for real climate scientists.
.
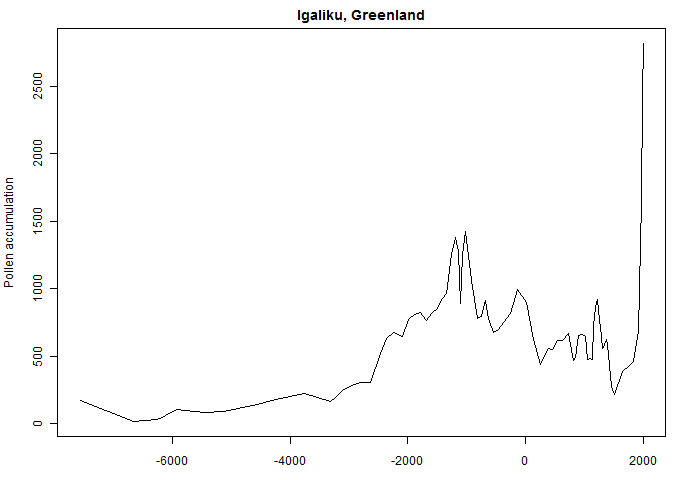
Here is a plot of the last nine (of 22) Arctic sediment series. One of these series (top left – Igaliku) has the classic shape of the contaminated Finnish sediment series (often described as upside down Tiljander). Any proper data analyst plots data and inspects outliers, especially ones that overly contribute to the expected answer. The Igaliku series demands further inspection under routine data analysis.

Figure 1. Plot of last nine (of 22) Kaufman et al Arctic sediment series. The Igaliku proxy is total pollen accumulation.
The Igaliku series is plotted separately below. It is also available at a NOAA archive here , which actually contains one additional recent value plotted in red. The NOAA archive contains many other measurements: it is unclear why Kaufman selected pollen accumulation rate out of all the available measurements.
The resolution of the data set is only 56 years (coarser than the stated minimum of 50 years) and only has three values in the 20th century. The value in 1916 was lower than late medieval values, but had dramatically surged in the late part of the 20th century.

Figure 2. PAGES2K Igaliku series.
Igaliku is in Greenland and was the location of the Norse settlement founded by Erik the Red and is of archaeological interest. Sediment series from Lake Igaliku have been described in three specialist publications in 2012:
Massa et al, 2012. Journal of Paleolimnology, A multiproxy evaluation of Holocene environmental change from Lake Igaliku, South Greenland. (Not presently online). (Update: online here h/t Mosher. I’ve added a paragraph from this text referring to pollen accumulation.)
Massa et al 2012. QSR. A 2500 year record of natural and anthropogenic soil erosion in South Greenland. Online here.
Perren et al 2012, 2012. Holocene. A paleoecological perspective on 1450 years of human impacts from a lake in southern Greenland. Online here.
The three articles clearly demonstrate that the sediments are contaminated as climate proxies.
Igaliku has been re-settled in the 20th century and modern agricultural practices have been introduced. The specialist publications make it overwhelmingly clear that modern agriculture has resulted in dramatic changes to the sediments, rendering the recent portion of the Igaliku series unusable as a climate proxy. Here are some quotes from the original article.
The modern community consists of 60 permanent inhabitants and was founded in the late 1700s. Agricultural practices resumed in the 1920s, at the same time that the climate of southern Greenland reached its recent maximum (Box et al., 2009). Current sheep farming in the catchment is limited to one farm, established in the early 1960s, which has a barn for wintering sheep and summer hay production on a 30 ha field. A small ditch currently drains effluent from the barn into the nearby lake. The farm currently deploys 750-900 kg N fertilizer per year within the lake catchment to boost yields for winter fodder (Mikki Egede, personal communication, 2011)
A multiproxy sedimentary record from Lake Igaliku in southern Greenland documents 1450 years of human impacts on the landscape. Diatoms, scaled chrysophytes, and C and N geochemistry show perturbations consistent with recent agricultural activities (post- ad 1980), superimposed upon long-term environmental variability. While the response to Norse agriculture (~ ad 986-1450) is weak, the biological response to the last 30 years of modern sheep farming is marked, with drastic changes in diatom taxa, d 13 C and d 15 N isotopic ratios, and a sharp increase in scaled chrysophytes. Indeed, current conditions in the lake during the last 30 years are unprecedented in the context of the last 1450 years. The dominant driver for recent changes is likely an intensification of agricultural practices combined with warming summer temperatures. W
The PCA of diatom results show two major features: a major shift in lake ecology ~ ad 1980 as registered in the PCA axis 1… the rise in d15N in Igaliku is likely a result of the addition of fertilizers from manure and industrial sources, but some component of internal utilization of N, such as enhanced sediment denitrification, cannot be ruled out.
However, beginning in 1976, the method of farming shifted towards fodder production and higher yields at slaughter which introduced fertilizers
(250-300 kg/ha per yr) and effluent from winter sheep stables into the local landscape and lake (Figure 7: agricultural phase II; Greenland Agriculture Advisory Board, 2009). After 1976, sediments from Igaliku show a rise in planktonic diatoms ( Cyclotella stelligera, Fragilaria tenera ), as well as chrysophyte scales, d15N, and N, reflecting increased nutrient additions and the beginning of industrialized agriculture.
The digging of drainage ditches for hayfields caused a dramatic increase in MAR, which reached unprecedented values. The use of nitrogen fertilizers on thesefields (200–250 kg ha -1 yr -1of N, Miki Egede pers.commun.) have outpaced the natural buffering capacity of Lake Igaliku, resulting in a sharp rise in the mesotrophic diatom,
This is precisely the same sort of contamination that affected the Korttajarvi sediments in Finland – for which, Kaufman, Mann and others were rightly criticized at Climate Audit. Kaufman conceded that the prior criticism was justified by issuing a corrigendum to Kaufman et al 2009 (but conspicuously failed to acknowledge Climate Audit or myself by name). It’s ludicrous that Kaufman has made an identical error with a different site. And that peer review at major journal was unequal to the identification of an error that Kaufman’s made in the past.
Now it is not evident to me that Kaufman’s varvology lends itself to multiproxy sausage-makers in any event. Varve compaction was not addressed in Kaufman et al 2013 and has the potential for a very serious bias. Nor is there any direct physical connection between temperature and varve thicknesses. The traditional interpretation of varves requires presence of a nearby ice cap and thin varves have been interpreted as evidence of warmth and thick varves as evidence of cold (Miller et al 2012) – the exact opposite of Kaufman. Until such issues are resolved, varve thickness data is unusable for temperature reconstructions that are destined for policy-maker consumption.
The network was unusable in the first place. However, the unusability is made much more evident when the authors and peer reviewers are once again unequal to the small task of separating out contaminated data.
Does this sort of error “matter” to the reconstruction? It’s hard to say.
It did in the case of the no-dendro reconstruction of Mann et al 2008, though it was never formally retracted. In that case, Mann toughed it out and continued to use the contaminated no-dendro reconstruction of Mann et al 2008 even after conceding it did not validate prior to AD1500 without the contaminated Tiljander data: see 2012 RC here; also cited in the EPA response to the Petition for Reconsideration). On the other hand, the Kaufman et al 2009 reconstruction was able to survive the correction of contaminated data.
While critics will be quick to say that it is my responsibility to show the impact of the error, I view today’s post as part of extended peer review: no author will tell a peer reviewer that it was their job to figure out the impact of using contaminated data. It’s the responsibility of the author to correct contaminated data, not the responsibility of a reviewer, either at the journal stage or in the present “extended” review. I presume that Kaufman will do so, once he has satisfied himself that there is a problem.
In the present case, it may well be that varve compaction – which impacts multiple series – is a more serious problem that a single contaminated series. But one really wonders at the quality of work when such gross errors are made.
Update: 6 pm. The Journal of Paleolimnology article which Mosher located also stated in respect of pollen accumulation:
Despite the possible influence of land use, pollen accumulation appears to document climatic changes of the last millennia nonetheless. PAR reached minimum values during the Little Ice Age from 1500 to 1920 AD, consistent with maximum glacial re-advance at Qipisarqo (Kaplan et al. 2002) and elsewhere in south Greenland (Weidick et al. 2004; Larsen et al. 2011). It is also coeval with high rates of isostatically driven transgression, which caused the inundation of a Norse graveyard at Herjolfsnæs (Mikkelsen et al. 2008). The sharp increase of Salix/ Betula pollen accumulation rate after 1920 AD (Fig. 6) suggests a rapid warming, which reversed the Neoglacial cooling trend similar to other locations in the Arctic (Kaufman et al. 2009).
Nick Stokes has argued in comments below that this is sufficient to qualify the contaminated sediments as a climate proxy. I disagree. The sediments are clearly contaminated by human activity. Can pollen accumulation within contaminated sediments be separated as an indicator? I’ve got a better idea: the Arctic is a big place. Don’t use contaminated sediments.
Postscript: Here is the longer Igaliku pollen accumulation series as plotted from the data at NOAA. Values are low in the mid-Holocene despite other evidence of mid-Holocene warmth. My interpretation of this is that glacier retreat took a long time in this area (think LIFO accounting) and had not retreated sufficiently to permit pollen accumulation until rather late in the Holocene.
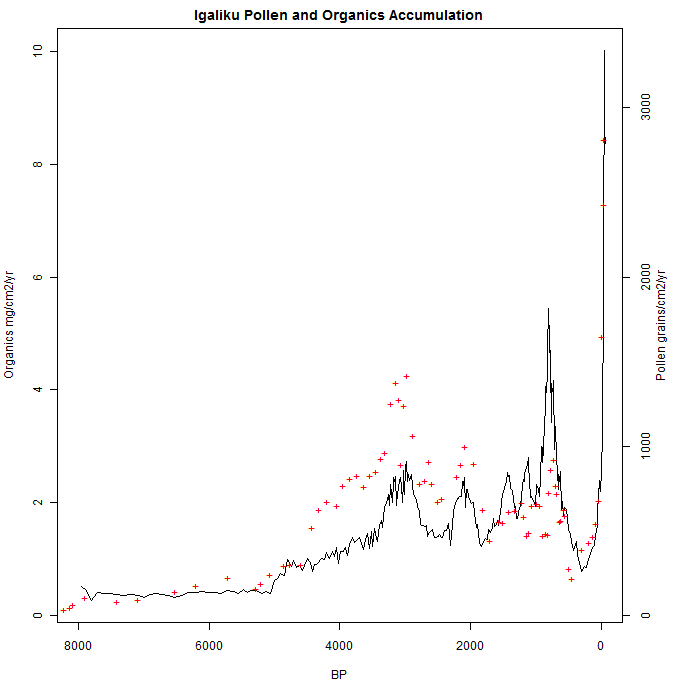
Update 2: Here is a plot comparing pollen accumulation rates to organics accumulation rate. (Organics accumulation is the Korttajarvi proxy.)
Update 3:
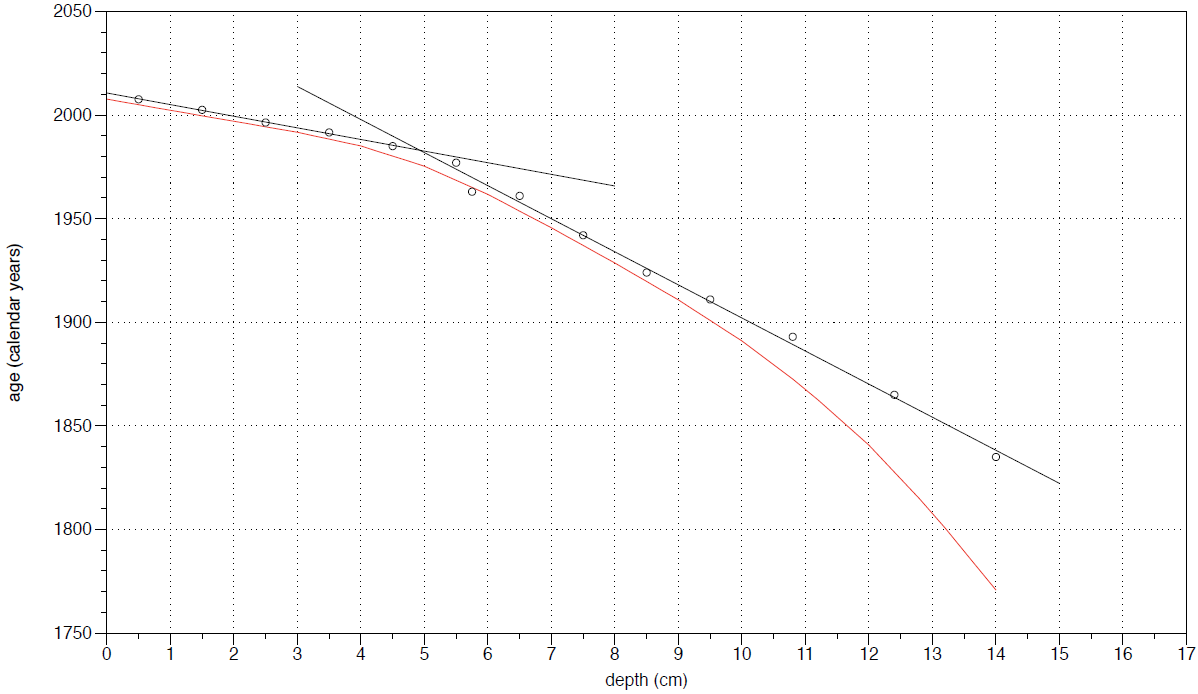
Igaliku age model calculated by Paul Dennis. Red- age model of authors.
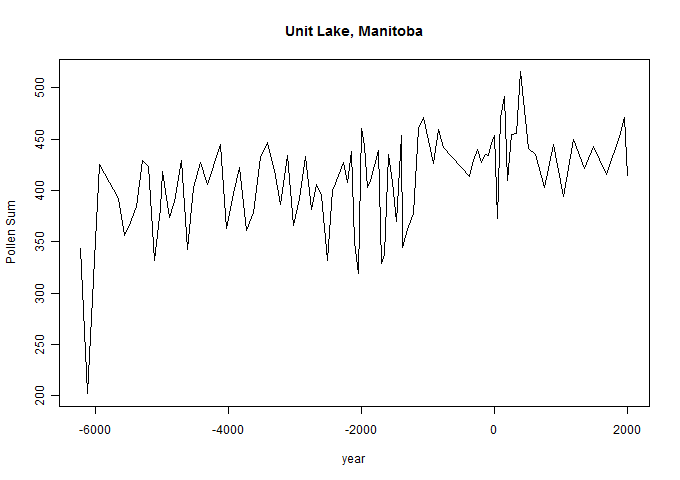
Update 4: here is a plot of pollen sum at Unit Lake, Manitoba, one of the data sets published in the Kaufman 2012 JOPL issue.
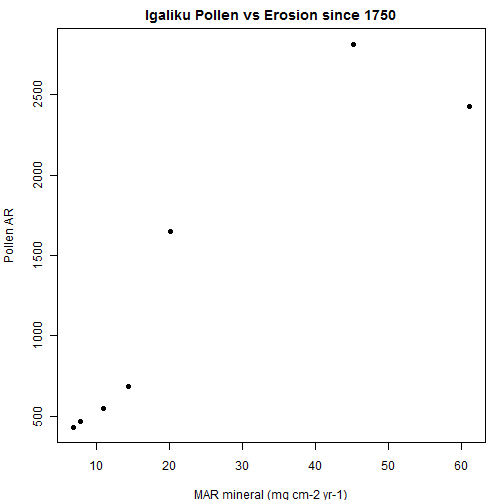
Update 5: here is a plot of pollen accumulation vs mineral matter accumulation in the same interval for the 7 pollen measurements since 1750. The pollen intervals (1 cm) do not exactly overlap the mineral intervals (0.5 cm) and so weighted averages were taken. There is an obvious relationship between erosion (indicated by mineral matter accumulation) and pollen accumulation. Massa could just as easily “suggested” that erosion was a proxy for temperature.


232 Comments
“This sort of mistake shouldn’t be that hard to spot even for real climate scientists.”
🙂
It leaves one wondering about the competence of the scientists in paleoclimate in general and the industry-wide pervasiveness of their mercurial immunity from criticism.
Or perhaps he just forgot…
Kaufman was refreshingly quick to issue a corrigendum to his 2009 paper. Given his positive attitude to admitting error, did you consider notifying him of this problem before publishing this post?
Steve: They issued press releases. So there’s every reason to respond publicly. In 2009, I notified him of problems in a polite email and asked him to comment. He blew me off. The Climategate emails show that Kaufman described the contact as “hate mail”. In the Corrigendum, he refused to acknowledge me, instead acknowledging “H. McCulloch and others who have pointed out errors and have offered suggestions.” While Hu’s contributions here are highly valued, this was a decidedly odd way of handling the situation.
In any other field, no one would consider correcting mistakes as anything more than complying with obligations: it’s a minimum standard rather than something praiseworthy.
Thanks for the reminder. I’m constantly amazed that climate scientists think that the best way to deal with you is to prod you with a stick.
You reveal yourself. This is Climate Audit and Kaufman’s error was egregious. Turn it around- Kaufman should acknowlege McIntyre’s critique. Will he? Will you remind him to?
I think there’s envy involved here. These scientists probably fall in the top 5% of intelligence and then they come up against someone in the top 1% in McIntyre. That has to be hard to swallow.
In that same I got “hate mail” email to the team, Kaufman had this wonderful statement demonstrating his ethical clarity.
“This is new territory for me, but not acknowledging an error might come back to bite us.”
>He blew me off.
He suggested you call him, and you chose not to.
Now you are resorting to name-calling against another commenter.
Steve: I asked him for data and he was unresponsive. I offered him the opportunity to comment and he blew it off. He falsely disparaged my contact to him as “hate mail” to his Climategate associates. The validity of my criticism of Kaufman’s proxy handling has nothing whatever to do with whether we chit-chatted a few years ago. As to Nick, he has a long history of not agreeing with anything here and isn’t bothered by the term Racehorse.
MikeN also made similar complaints in a Kaufman thread here https://climateaudit.org/2009/09/14/kaufmans-anatomy/ where I put the correspondence online. I offered Kaufman a password to make place his side of the story unexpurgated, but he accused me of making “vicious commentary”. I said that there had been no such vicious commentary, whereupon Kaufman snottily said that I must have just “cleaned up” the site. I asked Kaufman to point out any offending remarks whereupon Kaufman asked that I not contact him again.
MikeN thought that I was too curt with Kaufman at the time and he’s entitled to his opinion.
But quite aside from our emails, Kaufman’s attitude in the Climategate emails was very shirty, rather vindicating my reaction at the time IMO.
I didn’t follow the Kaufman stuff much further because the Yamal data became available soon afterwards. And then Climategate.
Full acknowledgement of sources of ideas, including sources of corrections to one’s own work, is fundamental to academic and scientific honesty.
Undergraduates fail courses when they are caught doing the kinds of stuff that seems routine for “Team” members. I have never seen an advanced undergraduate as slovenly with notes, sources, and acknowledgements as a lot of “Team” members prove to be.
http://www.academia.edu/2367255/A_multiproxy_evaluation_of_Holocene_environmental_change_from_Lake_Igaliku_South_Greenland_of_environmental_change_from_Lake_Igaliku_South_Greenland._Massa_C._Perren_B._Gauthier_E._Bichet_V._Petit_Ch._Richard_H
“Norse farmers settled southern Greenland *985 AD(Jones1986) including the area around Lake Igaliku,which was used for grazing and hay production.Following the disappearance of the Norse *1450 AD,Igaliku was resettled during the 18th century (Arne-borg2007) and large-scale agriculture, based on sheepfarming, was developed in the 1920s (Austrheim et al.2008). Consequently, the response to climate changeover the last millennium was overprinted by land-useeffects (Gauthier et al.2010; Massa et al.2012; Perrenet al.2012). However, the consideration of human-induced changes at Lake Igaliku in light of the entire Holocene ecosystem development provides newinsights about their magnitude.Relative to the preceding Holocene shifts, thevegetation was slightly impacted by land clearanceand grazing, and exhibits a small decrease in woodytaxa abundance (from 60 to 45 %). Until *1335 AD,the related soil erosion, documented by high TOC/TNand MAR values, clearly compounds the long-termincreasing trend (Fig.6). Contrary to the other studiedvariables, the diatom assemblages indicate that thelake ecology was not significantly impacted, and thatthe changes are within the range of natural Holocenevariability.Both in terms of lake ecology and soil erosion, theperiod since 1988 AD is likewise unprecedented in thecontext of the Holocene by a magnitude and rate of change greater than the previous 9,500 years. Thedigging of drainage ditches for hayfields caused adramatic increase in MAR, which reached unprece-dented values. The use of nitrogen fertilizers on thesefields (200–250 kg ha -1 yr -1of N, Miki Egede pers.commun.) have outpaced the natural buffering capac-ity of Lake Igaliku, resulting in a sharp rise in themesotrophic diatom,
Fragilaria tene
Steve MC: thanks for this. I’ve included the link and amended the running text accordingly.
ur welcome
I like the phrase “overprinted” so much more paletable than contaminated.
in an overprinting of course you can discern the old print and the new print. I wonder how they do that with proxy’s
I think “palimpsest” is the pretty word for texts with over- and under-printing.
Yes, I didn’t want to bring up Derrida and palimpsests.. and the theme of erasure.
There’s a related paper – “Pollen and non-pollen palynomorph evidence of medieval farming activities in southwestern Greenland.” Gauthier is the lead author, Massa is also an author. The paper analyzes (I’m pretty sure) the same Igaliku core. But is behind a pay wall and I can only see the abstract.
Whenever I read one of these takedowns of the writing/reviewing processes in paleo-climate science, I can’t help but think of Casey Stengel’s ‘Can’t anyone here play this game?’
Another remarkable episode in the continuing saga of “RealClimate® Science”. Simple competence seems hard to come by, even after polite reminders. These are the world-savers?
“it is unclear why Kaufman selected pollen accumulation rate out of all the available measurements.”
I think it is clear, and your post shows the reason. Massa et al explain why various measures like diatoms would be affected by agriculture. But they do a detailed analysis of the origins of the pollen they collect, and they are not agricultural species. And so they say:
“Despite the possible influence of land use, pollen accumulation appears to document climatic changes of the last millennia nonetheless. PAR reached minimum values during the Little Ice Age from 1500 to 1920 AD, consistent with maximum glacial re-advance at Qipisarqo (Kaplan et al.2002) and elsewhere in south Greenland (Weidick et al.2004;Larsen et al.2011). It is also coeval with high rates of isostatically driven transgression, which caused the inundation of a Norse graveyard at Herjolfsnæs(Mikkelsen et al.2008). The sharp increase of Salix/Betula pollen accumulation rate after 1920 AD(Fig.6) suggests a rapid warming, which reversed the Neoglacial cooling trend similar to other locations in the Arctic (Kaufman et al.2009).”
They specifically comment on the post-1920 rise in Salix/betula.
Steve: Racehorse, yes or no: do you agree that the Igaliku data is contaminated and should not be used?
Steve,
I see no reason to disagree with the original authors, Massa et al in saying that “pollen accumulation appears to document climatic changes of the last millennia nonetheless”. The Betula/Salix counts are not contaminated. So yes, the pollen data can be used.
racehorse, can you show me an example of an uncontaminated core with similar results?
Steve,
In Greenland at least, pollen and people tend to be found together.
Could you say exactly what you mean by “contaminated core”?
“Salix” is willow and “Betula” is birch. Both are used for ornamental horticulture in many parts of the world. Both have pollen in structures amenable to wind dispersion and willow at least favours water rich locations like lakesides.
Google Earth photos show very few shrubs in this region. However, a farmer planting a garden including willow and birch near his farm a few decades ago could upset the apple cart close to a sampling site. The present absence of such a garden is not proof that it did not exist.
Problems like this are usually solved by rejection of outliers (though it’s neat to find a reason for atypical behaviour).
Steve: New Zealand South Island has many planted windbreaks. I presume that farmers in desolate Greenland would also try to protect themselves from wind. But I think that the more important effect is the relationship of total pollen influx to total sediment influx.
Geoff
Here is a picture of the lake and farm. There’s nothing very close, and no sign of windbreaks. There are lots of other pix if you search for Igaliku on google maps. It’s not the Garden State.
Let’s see Nick. The lake is next to a farm. Farms change the ecology of lakes. This is only arm waving, but have any of the specialists in this field thought about the effect that palynivores (pollen eaters), such as mites and insects may have on this type of proxy? A little excess nutrients in the lake, an algal bloom, a die off of a mite or insect species or two, and voila, a hockeystick of pollen deposition occurs.
This is just arm waving from a non-scientist, non-specialist, but this outlier definitely requires extra scrutiny before use. And it seems reasonable that changes to any ecological environment should certainly be considered when using an edible proxy.
Dr. Loehle, whaddya think?
Well, jeez, there is some imagination needed. But how does this relate to Kaufman? I see earlier demands that selection criteria be declared for proxies. Kaufman has done that, and appears to have stuck with them. But when a spike appears, suddenly the CA throng has a thousand a posteriori reasons why Kaufman is a reprobate for not throwing it out.
The criteria people are calling for include a rational examination of the behavior of each individual proxy, both with regard to its relationship to other similar proxies or to measured reality. For example,the Igaliku series’ “spike” as you call it, which you presume “…to document climatic changes of the last millennia nonetheless” does not remotely correspond to instrumental records for any of the stations in the vicinity, for example:
http://data.giss.nasa.gov/cgi-bin/gistemp/show_station.cgi?id=431042610010&dt=1&ds=14
So this outlier must be teleconnected to temperatures elsewhere or perhaps, just perhaps, it is contaminated (by sheep) crap and should be discarded.
The “spike” does align well to the “Current sheep farming in the catchment is limited to one farm, established in the early 1960s”.
I’m as skeptical as anyone of armchair theories, such as my own algal bloom killing the palynivores hypothesis, but edible proxies? I know it’s a long established field, but…EDIBLE PROXIES??????
@Nick
You say “I see earlier demands that selection criteria be declared for proxies. Kaufman has done that, and appears to have stuck with them.”
Steve says:
“The resolution of the data set is only 56 years (coarser than the stated minimum of 50 years) ”
even independently of any other problems, isn’t this different from the declared criteria? Or am I misinterpreting?
mrsean,
The series runs for about 10000 years. The time spacing is irregular. Some periods are well resolved; there are gaps. I presume the 56 years is based on the fact that there are 35 (or 36) readings since 0AD, but some other basis could have been used in the original scan.
Nick says:
Full quote in head post (bold mine):
The (partial) line quoted by Nick relates to the next sentence and the time period up to 1920. Where does it say that the counts are “not contaminated”? ‘Suggests a rapid warming’??? C’mon Nick! Just for once, try to achieve some level of credibility.
Cut off Igaliku at 1920 and the set of 9 proxies above look much more coherent. What “magic dust” made that proxy ever so much more responsive in the 20th century than the other eight?
“Where does it say that the counts are “not contaminated”? “
Where does it say that anything is “contaminated”? That’s Steve’s word. They do mention some use of nitrogen fertilizer which can change N isotope ratios and diatom growth, and affects those measures.
But the pollen blew in on the wind. It gets stuck in the mud, and can be counted. Provided it can be dated and counted, the purity of the mud is not critical.
The magic dust is pollen. It’s a fast responding indicator, and you can associate it with species of known growth pattern. Steve says that the Arctic is a big place, but pollen is hard to find, and where it is, people are likely to be not far away.
Re: Nick Stokes (Apr 29 18:42) —
OK, I see it’s “Say Anything!” time.
Nick is sharp when he wants to be. Neither Nick nor any other literate, numerate person writes this way if they care about getting at the truth of the matter under consideration. For whatever reason, Nick’s aim is to turn this into another “amusement value” thread.
Three plants ‘Betula pubescens, aka European White Birch’, ‘Betula glandulosa, aka American Dwarf Birch’ and Salix – Willows that are frequently planted by humans near the habitation. All three plants are sources for acetylsalicylic (aspirin). Willow bark is infused into a tea, birch can be infused or the twigs chewed since the birch flavor is pleasant and even sweet.
Another plant contributes a massive component to the pollen-sum, algae.
‘Suggests!’ Is this some sort of new science where when one doesn’t ‘know’ the cause, they make it up?
Up for discussion is a proxy that has an huge spike in pollen data during modern times, exact cause unknown or perhaps better stated uninvestigated. Science calls for discarding unexplainable step change events in data, at least until science is able to detail, verify and presumably test the causes. Assumptions are bad replacements for science
Right off the top are four pollen components where mankind is the main likely cause; three by plantings one by fertilizer (and other influences). Two of the plants are known to form dense thickets while the third plant is a landscaping addition.
suggests, seriously? And there are team adherents here trying to defend this proxy by every word twist and nuance? It’s time for science children, not make believe suggests.
Re: Nick Stokes (Apr 29 17:40) —
The risk is that readers might follow the link in the original post and look at Table 3a in the NOAA data archive. If they do, they’ll notice that the Betula glandulosa, Betula pubescens, and Salix counts are only three of the eight pollen counts that comprise PollenSum.
“PollenSum” is what Kaufman used and what McIntyre graphs in the post.
Apples and oranges, much?
Anyway, visual inspection of the Betula glandulosa, Betula pubescens, and Salix counts reveals obvious likely overprinting of any climate signal by other factors, during the 20th Century.
Say Anything or a dearth of common sense, one or the other.
hmm.
I suppose I could have a look at it
Click to access EGU2013-6452-1.pdf
Nick,
I don’t have the non-paywalled paper yet, but I get a much larger lake if I just Google Igliku. Sure you have the right one? Not doubting, just checking. The one you show looks like it had some of its banks graded at some time past to make it squarish. Thanks for the photo, I saw it before I posted last time.
How can one write “The Betula/Salix counts are not contaminated.” without knowledge of what might have grown nearby historically? A few trees and a tiny lake like this and you lose the connection between total pollen influx and total sediment influx that Steve refers to.
Geoff,
Here are the detailed maps from the multi-proxy paper – the same as in the other Massa paper. They are a bit messed in format, but the info is there. Anthony below has the same pic with hay bales.
One cannot say much, other that the hand waving and presumption, that can be read in the comments and the papers themselves without a priori work on the species, the location, and limiting factors. Specialized species such as those whose roots can withstand periodic full immersion often have reactions to changing conditions such as increased pollen production due either to nutrients or to increased inundation.
Another point above that was hand waving concerns increased sediment flow from farming. This is a well known and documented problem with farming and is known to alter wetlands species, species response to the environment, and can be complex.
At a site like Igaliku I would expect Betula nana (dwarf birch) to be the dominant birch species. Betula nana pollen is very difficult to distinguish from tree birch, requiring a combination of size and morphiological criteria for a certain determination.
Betula nana is a quite low creeping bush, usually only several inches high, and I would expect it to respond quite strongly to fertilization, as indeed would Salix.
Re: tty (Apr 30 09:16),
It’s B. glandulosa I think which some style as a synonym of B. nana. This paper by Bent Fredskild (1992) from the same site seems to regard the increase in birch pollen as due to erosion, not fertilisation. (At least that’s what I take the author to mean when he says: “The peak in Betula in the 7cm sample, caused, beyond doubt, by macroscopically induced, contemporary B. glandulosa pollen is disregarded.”)
I think the issue here is sheep grazing/soil erosion. Fredskild talks about “destructed” pollen, which is presumably re-deposited from upslope.
Nick, I believe that you have missed your true calling in life.
Ever thought of been a contortionist, or a politician?
Just what will it take for you to admit that some “proxies” are anything but?
Or are you more concerned about getting the “right” answer than getting the science right?
I think the reason for why these sediments are contaminated is very clear. Run-off is increased dramatically with farm land. The water cycle of farm land doesn’t follow that of the environment (if it did then there is no need for irrigation!), so the nearby lake has unusually hgh run off compared to a lake without surrounding farmland, and that exceptionally high run off also leads to a higher rate of pollen being washed into the lake rather than absorbed into the soil.
More over, the tilling of the soil unearths pollen deposited in the soil that would normally not wash into the lake.
It doesn’t matter whether the pollen production was affect by agriculture, it’s conveyance to the local lake sediment was most certainly affected by agriculture.
Amac
““PollenSum” is what Kaufman used…”
Yes, and Massa et al say:
“pollen accumulation appears to document climatic changes of the last millennia nonetheless”
C’mon Nick – Your always taking the devils advocate position (which I respect) is good, but you’re going to a ridiculous extreme on this one, with your argument based on Massa el al say: “xxxx” and I have no reason to disbelieve them, so I’ll assert it as true (NS – So yes, the pollen data can be used.).
Massa el al say: “xxxx” is good enough for you, but any assertion by Steve Mc, Roman, Hu, Jean, etc is parsed and researched on your part to no end. I can’t imagine you EVER accepting “Yes, because McIntyre et al say” as a valid argument for anything (and I don’t expect you to). Why the double standard?
Let’s show a little bit of equal due diligence beyond “Massa said, therefore…”, lest the Racehorse moniker become indelibly imprinted.
overprinted, not imprinted
🙂 Touche
I’ve been reading Nick’s posts for years here, and since so many of the math/science issues are over my head, I’ve had to use other methods to figure out who’s wrong and who’s right. Since Nick doesn’t make personal attacks, like most of the other anti-skeptics, it’s posts like yours here that help to clarify things for me.
He presents so even-handed, but, as you say, he parses everything Steve says, but accepts everything the Team says.
Thanks!
Because, I guess, the Team is his “Massa”?
Terry,
‘Massa el al say: “xxxx” is good enough for you’
I wasn’t the one who invoked Massa et al, it was Steve. And it was to show that “But one really wonders at the quality of work when such gross errors are made.”. Gross error? You need a pretty good case for saying that, and it was allegedly using “contaminated” sediments, as said by Massa et al.
But in fact Massa et al said that pollen accumulation does appear to document climate changes. So where’s the case?
It’s not that Massa et al is good enough for me, it’s that it was good enough for CA to beat Kaufman with. Now apparently not.
Hi Nick, thanks – that isn’t the impression that I got reading the post/thread but I’ll read the three papers linked.
Kinda/sorta related, Gauthier has another paper that seems much closer to the center of discussion (with Massa as a co-author – I noted the title above). Any chance you have a subscription to the journal?
Cynwar 1978 http://labs.eeb.utoronto.ca/mcandrews/PDFs/Laboratory/RecenthistoryGreenleaf.pdf relates total pollen influx to total sediment influx:
On the same basis, the very high sedimentation rates in the contaminated modern portion of the Igaliku sediments would also yield very high rates of pollen influx. The Korttajarvi-look of the pollen influx curve is totally consistent with this.
It is madness for scientists to simply close their eyes to this sort of contamination, as Kaufman has done and as Nick Stokes endorses. Nobody would be allowed to do this in real world activities.
Steve,
“It is madness for scientists to simply close their eyes to this sort of contamination, as Kaufman has donee and as Nick Stokes endorses.”
Kaufman has followed his rules, which are to use proxies which:
“(5) exhibit a documented temperature signal, and (6) are
published in peer-reviewed literature as a proxy for temperature”
If you have a quarrel here, it is with the authors Massa et al, whom you enthusiastically introduced. But I cannot see any basis for your claim that “contamination” is associated with very high sedimentation rates, nor that these are responsible for high rates of pollen influx.
TerryMN,
Sorry, I don’t have a subscription to that journal.
What is your emotional investment in defending the alarmists?
Why don’t you take a step back and self-reflect?
It is so tedious to see you leaping to their defense on every thread.
Nick,
Let me get this straight – are you really saying that “Pollensum” as used by Kaufman is not contaminated in the modern era?
For once, Nick, I agree with you.
“Kaufman has followed his rules, which are to use proxies which:
(5) exhibit a documented temperature signal, and
(6) are published in peer-reviewed literature as a proxy for temperature”
The trouble is that climate psietists, like Kaufman and Mann, really do like making their own rules.
Such a pity that a clearly intelligent person yourself appears to mistake “making one’s own rules” for science.
Sophistry, yes. Science, no.
I’m not very familiar with farming in Greenland, but looking at the site via Google maps makes me wonder how much of anything humans like to eat would grow there. The coordinates were taken from the NASA spreadsheet.
https://maps.google.com/maps?hl=en&q=61.00%C2%B0N,+45.43%C2%B0W&ie=UTF-8&ei=mAx_UcSbFJK00AGt7ICYBQ&ved=0CAgQ_AUoAg
The spreadsheet:
ftp://ftp.ncdc.noaa.gov/pub/data/paleo/paleolimnology/greenland/igaliku2012.xls
It’s quite clear to any real afficionado of dendro that Igaliku is the only true signalling proxy while the other 8 are seriously contaminated and of no use. Well perhaps we of the commanding heights would concede Kepler if the skeptics want to really split hairs.
Woops! Pieni-Kauro for Kepler and never let it be said we’re above correcting the odd oversight.
So one proxy out of 9 above shows something possibly alarming. Are the other 8 chopped liver? Why should we be alarmed about possible climate warming because one proxy went off the rails?
Indeed, what even is the conceptual meaning of the combining of any data series in scientific analysis in which the overall trends utterly mismatch one another? Climatology uses scattered noisy data to smooth out the past, merely, allowing cherry picked bad local data outliers to assert themselves as a worldwide trends worthy of news headlines.
Massa, et al., reference Moore, Webb, and Collinson 1991 Pollen analysis Blackwell Scientific Publications, 216 pp., as their method for evaluating the pollen accumulation rate (PAR) at Lake Igaliku.
I don’t have access to Moore, but the same PAR method is described by Heikki Seppä, et al., in their study of Holocene biomass using pollen counts in sedimentary cores taken from Lake Nautajärvi and Lake Orijärvi in Finland. [Calibrated pollen accumulation rates as a basis for quantitative tree biomass reconstructions (2009) The Holocene 19(2), 209–220.]
Seppä, et al., describe the calculation as varve PAR = C x S, where “C” is the pollen count (N) and “S” is the sedimentary rate in mm/yr.
“C” is corrected for observer error using a marker pollen of known number added to the sediment.
C units are N/mm^3. PAR is C x S = N/mm^2/yr. Thinking about this, PAR will rise and fall in an anti-correlated way with sedimentary rate. For constant a pollen deposition rate, a greater sediment deposition rate produces a smaller PAR. Variable pollen rates plus variable sedimentation produces a mess difficult to disentangle, unless annual varves are visible.
If pollen production is a measure of plant type and vigor then PAR values will have to be corrected for any changes in sedimentation rate over time in order to accurately reflect the plant ecology.
Massa et al., did not count individual annual varves. They applied an “age-depth” model based on constant accumulation of 210-Pb and 137-Cs during the recent past, and used 14-C to date the deeper core. So, they can model sedimentation rates, but don’t actually know them.
Massa Table 1 shows date uncertainties averaging around (+/-)80 years (2-sigma), which means the PAR values represent an average of ~160 years.
The unknown sedimentation rates are an added uncertainty hidden within the date range. Hidden changes in sedimentation rates will impact the PAR value, making the true uncertainty greater than just the date range.
The uncertainty in the Massa PAR is therefore not limited to the date range. There’s an added uncertainty due to the unresolved sedimentation rates within the dated core segments.
It’s careless, therefore, to just accept the date ranges in Massa Table 1 as representing the full uncertainty in the core PAR values as, crediting Steve M., Kaufman apparently did.
Pat,
The pollen accumulation rate (PAR) and sediment accumulation rate (SAR) are correlated and not anti-correlated as you suggest. The key factor in the increased PAR in the Massa paper is the increased near surface sedimentation rate. This is entirely dependent on the age model and quality of the dating.
I’m intrigued that despite an apparent significant change in sedimentation rate suggested by their age model that factors such as wet bulk density, water content etc. remain largely invariant not only through the past century but also for the past 1000 years.
Another interesting anomaly I don’t understand concerns Figures 4 and 6 in the Massa paper. In Figure 4 they plot PAR for hygrophilous trees, water taxa, algae and the total PAR. It is clear from this that the total PAR (>2000 grains per cm^2 per year) is dominated by algae with hygrophilous PAR at about 30 grains per cm^2 per year. Yet in Figure 6 the Betula/Salix (are they hygrophilous?) PAR has now jumped to 1000 grains per cm^2 per year. I’m not sure how this inconsistency is resolved.
I’m very cautious about how the near surface sedimentary record here is interpreted. First, despite their assertions, and from my own experience of gravity coring a lake sediment in 4m of water, it is not possible to core the near surface layers without significant mechanical disturbance over the first few cm. All their action takes place over just 5-10cm of the top sediment. Note that the sediment has a water content of 80%! This will disturb their age model and any subsequent calculations of sediment accumulation rates and PAR’s.
“I’m not sure how this inconsistency is resolved.”
It is confusing, but I don’t think pollenSUM (PAR) includes algae, aquatic taxa etc. I think it’s the sum of the land plants on the left. In the archive, the figures roughly match. But if you look down about 8000 BP, the algae greatly exceed PAR.
“I’m very cautious about how the near surface sedimentary record here is interpreted.”
I think they have become more cautious too. In the erosion paper, they show plots of SAR. But not in the multiproxy paper that Kaufman cites, AFAICS, and the figures don’t seem to be in the archive, though they could be derived.
Nick, I see what you mean about the peak in algae at 8000+ years not being picked up in the total pollen PAR implying algae is not included. It would be strange to include algae in the PAR. However, neither the text, the diagrams, or the figure captions are clear on this.
Notwithstanding this point I think my concerns over interpreting the near surface data hold. In sediment with 80% water content it simply is not possible to core and recover undisturbed near surface layers. Since the calculated PAR is strongly driven by estimates of the SAR over the top 5cm I would caution against any interpretation of this data in terms of a climatic signal. This can be seen from the mass accumulation rates (MAR’s). With invariant WC, WBD and OM over the top few cms the increase in MAR is solely due to the estimated increase in SAR. Since the increase in MAR in the last century correlates with the PAR I surmise that all the PAR is doing is tracking the SAR. Given my concerns about sediment disturbance I doubt that the SAR variation over the last century can be measured and it would be better to use a simple average over this time period. Of course if one does this then the PAR remains flat over the last century.
Paul you can core the top, but not continuously to depth. Used to do it for Sediment Oxygen Demand studies. That adds another variable since the results would have to be spliced. I don’t know about these samples, and hydrology, but often the top 2 cm have to be considered separate due to flora and fauna disturbances, and hydraulic scouring depending on hydraulogy of the in situ sample sites and variance.
Paul wrote:
This is a pervasive issue in Kaufman et al. Kaufman used many proxies that are “varve thickness”. In the case of Lower Murray Lake, the authors had also calculated density and “mass accumulation rate” (factoring in density), using the latter as their proxy. Unsurprisingly, the density of recent varves was much lower due to the compaction of older varves. However, instead of using mass accumulation in the case of Lower Murray (as, according to their procedures, it appears they ought to have), Kaufman used varve thickness.
IN other locations, the original authors (many of them directly associated with Kaufman) generally failed to show density and reported only unadjusted varve thickness without accounting for compaction. This gives a modern bias to all these proxies – another shortcoming of Kaufmannian varvology.
If a varve represents one year, why is a relatively complicated formula necessary? Just express the results as #grains/year and be done with it.
I defer to you on pollen/sedimentation correlations, Paul. I was assuming independence of their respective transport.
I wouldn’t expect there to be much disturbance at the top of a gravity core, unless the sediment is exceptionally sloppy – the sort of organic-rich soup that can accumulate in very eutrophic lakes – or the core was handled carelessly. That there is not gross disturbance at the top of the core can be inferred from the variability in the proxies – variability that would be smoothed out had there been gross mixing. The agreement of the PB210 model with the Cs137 bomb-testing peak is also reassuring that the age model for the last century is good.
Richard, that’s the point! The core contains 80 wt% water and has bulk densities of between 1.2 and 1.4 g per cm^3. It can’t be anything other than sloppy. Moreover, the proxies don’t vary with depth at the near surface. Very similar TOC, N, S, bulk density, water content etc. As for the other proxies we don’t know. Massa et al don’t archive the raw pollen counts and instead archive the pollen accumulation rate which is a derived variable. Since this is largely driven by the sediment accumulation rate it may well be that the raw pollen counts don’t vary much either as with TOC.
I do agree with you about the good match between the Pb-210 model and the location of the Cs-137 spike. But this is not conclusive. For example, I’d like to know if Cs-137 was tested for at all other depths and what the Cs-137 signal was like. This would confirm to confirm that the 1963 spike is truly located at 5.75cms depth. Unfortunately, if the data was collected it wasn’t archived.
Paul, the core has the ~same %water for the top metre, and I don’t think that 80% water is unduly high. This will be soft, but not sloppy mud. (What did you core – one of the Broads?) The diatom/scale record varies considerably in the top few cm – it is implausible that this sediment is substantially mixed. The only time I have had real problems with disturbing the sediment was with coring an 40m deep lake with CO2 saturated sediment – Henry’s law in action!
And if the sediment was substantially mixed, the effect would be to reduce variability in the pollen accumulation rate, not to accentuate it.
Could the change in PAR by be driven by errors in the sedimentation rate alone? The mean PAR over the last 2000 yr, excluding the uptick is ~600 grains/cm2/yr. This doubles in 1960 and triples by 1991. So we can get the changes in PAR is the apparent sedimentation rate at 1960 is twice the real rate, and that at 1990 is triple the real rate. But we know that the Pb210 age-depth model agrees with the Cs137 data (and there is the post-bomb C14 date), so it is not possible for the sedimentation rates to be grossly incorrect.
Richard, I’m not convinced by your argument here. The PAR is given by N * SAR. The authors don’t archive N for this core, just PAR. They derive SAR from their age model. The age model for the top 14cm (say last 200 years) does not fit the Pb-210 data. Their model gives a factor of 8 increase in sediment accumulation rate over this time period. Very large changes in recent PAR are driven by their modelled SAR. These changes are on the order of those you suggest. However, the effect is not to eliminate the uptick, rather to drastically change its shape. The modern, 1990-2000 PAR’s seem correct. It is the earlier ones back to the early 1800’s that are too low and by a factor of three or so.
PAR’s are higher than the long term record but don’t suddenly jump up over the past few decades. Rather the change is over a much longer period.
I could back out the pollen counts using their modelled SAR’s and recalculate them using the Pb-210 age – depth relationship but am not that interested.
I wasn’t coring on the Broads, but on a 200m diameter lake called Seamere near Norwich. It has a near continuous 19m sediment record covering the Holocene. Some early Holocene pollen work has been done on this lake by Hunt and Birks.
I’m certain that the very large uptick in the MAR(org), MAR(min) and PAR’s are largely driven by a very large change in the calculated sediment accumulation rate (SAR). In deed over the top 15cm the Massa et al paper use an age model which shows a factor of 8 increase in the SAR between 15 and 0cm. This is virtually the same as the increase in PAR and MAR.
We’ve discussed mixing above and I agree with you that the Pb-210 ages, plus the location of the Cs-137 peak all looks consistent. Let’s exclude mixing for the time being. Now what about compaction. These sediments are recorded as having close to 80 wt % water. Allowing for a component of bound water (associated with organics, adsorbed onto clay particles and other fine grained mineral surfaces etc.) this still implies very high porosities of may be up to 70% or so. To me this implies that the physical structure of the sediment in terms of grain packing etc. is highly unstable. Any disturbance associated with coring may result in a degree of grain re-packing with changes in porosity. These only need to be small to have a significant effect on the calculation of the SAR. A change of 10% in the water content at close to 80% water content will result in a factor of 2 increase in estimate of apparent sedimentation rate since this term is proportional to (1-WC).
For me to be convinced that a change of x8 in the SAR is robust then I need to be convinced that it’s estimation is based on more solid evidence. Since the extraordinary peak in PAR and MAR is driven by this change in SAR I have the same concerns regarding these variables too.
Most of the discussion has been based on land use and vegetation changes driving both extra sediment transport and pollen influx. This may well be correct, but until we understand the nature and magnitude of the changes then the discussion might be a little premature.
I’d be interested in any ones thoughts, and especially Richard’s because of his wide experience of coring lake sediments.
Dewatering of the sediment during coring is unlikely to be important – the paths the water would need to move along are very tortuous. Even if dewatering did occur, it would have no impact on the PAR. The age-depth relationship would change, but the age-mass accumulation relationship would not.
Coring artefacts can be a problem. For example, using a gravity driven piston corer (eg a Kullenberg core), the stretch on the wire is released when the weight release mechanism is triggered. The causes the piston to pull up slightly rather than staying still, sucking more mud into the core at the sediment water interface. This problem is not relevant here as the gravity core they used does not have a piston.
A second problem can occur with long cores, friction builds up inside the core tube, making it more difficult for more mud to enter, instead it is pushed away. This is usually only a problem with long, especially narrow, cores and stiff sediment. It can usually be noticed because the length of core collected is less that that expected. On the lakes I’ve worked on, this has never been more than a few cm of sediment loss.
Obviously any accumulation rate will be heavily influenced by the age-depth model. But I think it unlikely that the uptick is an artefact of a faulty age depth model. I am not surprised by the higher sedimentation rate at the top of the core: the sediment will have compacted less, the ditching and the farming may have increased erosion, and increased temperature and perhaps nutrient status will have increased authigenic sedimentation.
Richard, thankyou for your comment but it doesn’t make sense to me for the following reasons. First we are talking about the top 10cm or so of sediment and not dewatering of the whole sediment. Second the sediment already has a porosity of close to 80% and likely a high permeability. It doesn’t seem reasonable that the top few cms will have a high tortuosity. I’m only talking about losing a small amount of water from the sediment column, say from 85% to 80% WC. This will alter the age-depth relationship but probably not significantly. However it could have a significant impact on the calculated mass accumulation rates. According to Massa et al. (and the equation is dimensionally correct) the MAR is given by (using organic material as an example)
MAR = (1 – WC)*WBD*OM*SAR
Because of the 1-WC term a change in the water content from say 85% to 75% changes the 1-WC term from 0.15 to 0.25. i.e it imparts a 66% increase in calculated MAR (and also PAR). The rate of change of 1-WC is particularly high at high water contents as in these sediments so any dewatering occuring in the top few cms will distort both the SAR and the MAR.
The Massa et al paper reports a factor of 8 increase in sediment accumulation rate, mass accumulation rate and PAR’s all whilst recording an invariant WC, WBD, TOC, N, S.
I’m just surprised that such a change in sediment accumulation rate isn’t accompanied by any change in the physical structure or makeup of the core as determined by WC, WBD etc. over the top ten or so cms. You yourself say the sediment will have compacted less at the top of the core. If so then where is the change in WC, WBD etc.
As for filtering out the different components (increased run off due to land use changes, ditching, farming, vegetation change, temperature, authigenic minerals and sedimentation etc.) I’d contend that with the information available that is not possible.
Pb210 dating with the CRS model requires an estimate of the Pb210 inventory. This is calculated on a dry weight basis, so even if the core had lost water during coring or storage, this would have no affect on the Pb210 chronology. The chronology is first expressed in cumulative mass, then put back on the depth scale, and the sedimentation calculations carried out, but they could equally well be done on the cumulative mass scale.
There is a reduction in WBD at the top of the core – just as expected.
I haven’t worked with surface sediments, but I do know that for many soil types in groundwater zones, when you drive the sample, the soil goes compresses to the bottom of the sampler and the water floats to the top. I’m sure lake sediment samplers are more gently than what we use in commercial operations for environmental and geotech, but we aren’t coring soft sediments either. To preserve the top, you could freeze a block of sediment in place and core it that way or use one of those freeze corers developed for lake sediments.
When you are done coring, just add a touch of vermouth and an olive: shaken, not stirred.
home.badc.rl.ac.uk/mjuckes/mitrie_files/docs/mitrie_sediment_lake.doc
Steve writes:
=======================================================
By way of support for this, photos can tell you a lot.
Google Earth’s aerial view clearly shows the developed agriculture signature:
And from the ground, hay bales in Igaliku from the Wikipedia page on Igaliku:
The slope of the land drains right into the lake, and along the slope is clearly human agricultural development.
Given the drainage pattern of the land, it seems like a clear case of sediment contamination to me.
One wonders though if Igaliku wasn’t preselected due to the shape of the data without any other considerations.
Igaliku reminds me of the small farms in the Okanogan River valley of central Washington state. Note that dirt would wash into the lake from the several roads going up to the higher country.
Exactly, basically what agriculture does is increase the pollen catch-basin area though land use change. Fighting runoff and erosion is always an issue with agriculture.
With a larger area near the lake having undergone land-use change, it will allow more runoff, and therefore more pollen to be funneled into the lake. Kaufman was probably never a farmer and wouldn’t get this, or maybe he simply didn’t want to since that uptick looks so “elegant” when trying to fit the theory to the data.
Also, farming disturbs the natural flora, changes the succession for that area, and with introduced species can change the succession such that the biotic response has been changed due to different species. Different species can effect sedimentation, competitive nutrient uptake, and other parameters of growth.
Anthony;
Is it readily evident to anyone besides me, that tillage increases surface area of the soil and exposes pollen from prior years that was not washed out?
Just as tillage increases runoff vs. absorption, it concomitantly (and by a separate factor) increases sediment runoff by the increased surface area. Any old-and-buried pollen could be re-exposed to runoff by the same increased-surface-area mechanism.
There will not be ‘bomb-spikes’ or other tracer elements in the prior year deposits, to be smeared over the later year ‘varves’ to make this painfully obvious.
I guess I am relying on dust deposition to bury old pollen over time. (same dust that buried ancient Rome)…
AC
Figure 2 from PAGES 2K has an interesting pollen bump from about 1150-1400.
I think I’ve found a proxy for that. Modern day Igaliku is on the same site as Garðar, Greenland, which had a period of growth during the MWP.
Garðar was the seat of the bishop in the Norse settlements in Greenland.
Garðar had enough success as a town to warrant the Catholic Church to issue a permanent Bishop for the construction of a cathedral there. The first bishop of Garðar, Arnaldur, was ordained by the Archbishop of Lund in 1124. He arrived in Greenland in 1126. In the same year he started with the construction of the cathedral, devoted to St. Nicholas, patron saint of sailors.
To support something like that, you need a successful agricultural base. People that are starving don’t have time for such luxuries.
Bishop Álfur was ordained in 1368 and served as last bishop of Garðar until 1378. The Greenland diocese disappeared in the 1400s, when the ship departures from Norway stopped.
If you look at this table of Bishops, it seems to correlate with that bump in the pollen data, then dives after 1400.
Bishop Served years
Arnaldur First-Bishop 1124–1126
Bishop Arnaldur 1126–1150
Jón Knútur 1153–1186
Jón Árnason 1189–1209
Þór Helgi 1212–1230
Nikulás 1234–1242
Ólafur 1242–mid-1280
Þór Bokki 1289–1309
Bishop Árni 1315–1347
Álfur Last-Bishop 1368–1378
Source: http://en.wikipedia.org/wiki/Gardar,_Greenland
A timeline is here: http://www.greenland-guide.gl/leif2000/history.htm
Bishops would seem to be a proxy for the success of the town, and the success of the town had to rely on the sea and agriculture. When the climate turned colder, the agriculture failed, as we have heard about other areas of southern Greenland.
Of course the pollen bump due to agriculture would have been smaller then than now, since they had no mechanization to amplify the area they could till and plant.
Anthony — Eric Gnupsson (c. 1121) was an even earlier “bishop of Greenland”, though his official title may have been more general.
See http://en.wikipedia.org/wiki/Erik_Gnupsson
Here are the conclusions from Gauthier et al. “Pollen and non-pollen palynomorph evidence of medieval farming activities in southwestern Greenland”.
The outlier dominates because?
Minor clarification – in the satellite pic posted by Anthony, the water is the fjord (sea), not the lake. You can see the lake on google maps/satellite if you go slightly NW from the settlement, though the lake is ice-covered at the time of the satellite pic. The field lines leading to the lake are very clear. The wiki photo of the fields is the lake though. See the paper linked by Steve Mosher for a map.
At this writing, Nick Stokes has authored 11 comments, all directed to the concept that the Lake Igaliku pollen data series are proxies for climate through the 20th century, and aren’t overprinted by the effects of 20th-century agricultural activity. Thus Kaufman 2013’s failure to reject the hockey-stick-shaped PollenSum curve is valid (and the peer-review process is vindicated).
Kaufman 2013 may offer additional “who are you gonna believe, me or your lyin’ eyes?” propositions to defend. So far, only Nick has made such an effort. So, clearly, Nick wins Best-of-Thread by a landslide.
(I am aware that some may claim that landslides can result in increased sedimentation, affecting varve series. Though Racehorse Haynes would disagree.)
Here is a plot comparing pollen accumulation rates to organics accumulation rate at Igaliku. (Ass a reminder, organics accumulation is the Korttajarvi proxy that kaufman truncated.)

Steve,
I think this proves my point that the PAr’s are simply a function of the age model they used. Organic matter accumulation rates are given by (1-WC) * WBD * OM * SAR.
As far as I can see the water content (WC), wet bulk density (WBD) and organic matter content (OM) of the sediment are all nearly constant over the last few hundred years. Thus the mass accumulation rate (MAR) of the organic matter directly scales with the sediment accumulation rate (SAR).
Similarly the pollen accumulation rate is given by N * SAR, where N is the pollen count per cm^3. Again PAR scales directly with the SAR.
I don’t believe in sediments containing 80% water it is possible to recover and accurately determine the sedimentation rate in the top few cms and thus the PAR is unreliable.
Paul, I notice that box cores are used in ocean coring when recovery of top sediments is sought. Would this have been a better alternative” Or would the problem be pretty much the same?
Steve, I’ve only cored one lake and that was last year so my experience isn’t great. If they wanted undisturbed sediment then it would have been advisable to have used a box corer. These tend to have a much greater area of penetration and are lowered onto the sediment surface before being pushed in. A gravity corer, dropping onto a sediment from the water surface induces a degree of disturbance, mixing etc.
The sediment in Lake Igaliku contains 80 wt % (!) water and has a wet bulk density of between 1.2 and 1.4 gms per cm^3. It won’t have any cohesion so is liable to settling etc. during core recovery with subsequent disturbance of the true depth-age profile.
There must be other experts out there (Telford) who can pass a more knowledgeable comment here.
BTW, would tillage tend to release pollen from prior centuries which had been deposited on the ground and not washed out by annual rains?
Clearly tillage will increase the surface area of soil exposed to rainfall.
AC
Recently, at WUWT, there was a discussion around a paper, which I had read, claiming greater than 100% external quantum efficiency in an organic photovoltaic device. This is a field in which I have some experience. The physics was sound, a clever and useful contribution to understanding organic semiconductors. I was impressed, however, by the jeering of the commenters on the thread, most of whom clearly hadn’t read the paper, nor understood the quantum mechanics, nor even basic thermodynamics. A few, better informed, tried to educate, but the flow of cynical invective ran on, and on. It occurred to me that what WUWT needed was a Nick Stokes, doggedly, civilly representing the view of the authors of the paper, and challenging others to think a bit more; detuning the echo chamber, as it were.
About the only sensible thing that Ayn Rand ever wrote was that if rational people disagree, then their premises are different. I suspect that Nick S’s premises and mine are different, but he is probably better informed, which I respect. I like to think that we could reasonably discuss these differences over a beer. Meanwhile, I’m glad that he participates here.
Nick D
Nick is a delightful, intelligent man. I’m always glad when he shows up and brings his best.
one might suspect that Nick takes his moniker with the same kind of attitude that steve ‘gadfly’ mcintyre took his moniker
Old Nick Stokes the defender, just like Racehorce Haynes
He never takes umbrage; he always takes pains
His graphing tools dazzle, but his schtick does get old
He’s a quite artful dodger if truth’s needing told
Oh the forum was crowded and Nick Stokes was there
But the comments all focused on how poor proxies fare
As they were in studies, but some upside down
The studies had stumbled, and Steve went to town
And a-way down CA threads, answering all the folks
With a-ducking and a-diving was old “Racehorse” Stokes
I’d a bet he’d admit it — that the varves here were bad
If I’d trusted his history, more money I’d had
Oh the birches and willows and the algae pile high
I’d have thought he’d agree here, but he sooner would die
He can misdirect questions, just like Racehorce Haynes
He never takes umbrage; he always takes pains
===|==============/ Keith DeHavelle
Steve
“same kind of attitude that steve ‘gadfly’ mcintyre…”
In Keith’s spirit,
Horses have gadflies, upon their backs to bite ’em,
Gadflies have Racehorses, and so ad infinitum…
Steve: very,very cute 🙂
When the antagonistic Tamino announced that he had become a bull dog, I wrote something similar about the escalating animosity from Hansen to more minor figures:
https://climateaudit.org/2008/07/08/bull-dogs-have-little-dogs/ comments are well worth re-reading. I declared Evan Jones the winner, but I like some of my own contributions e.g.
Big trends have little trends
That disguise their true identity
And little trends have lesser trends
And thus self-similarity.
Cherry trees have tasty fruit;
And pickers need dexterity;
But not as much as paleos,
Who claim unprecedentity.
The data, even right-side-up
Must still sometimes be cropped
Judicious choices on the sly
The inconvenient, dropped
Thus greater blade is often made
By choice without compunction
But CA calls a spade a spade:
It’s selectile dysfunction
===|==============/ Keith DeHavelle
A new climate paper has just come out – “Gilbert and Sullivan et al”.
Allright, but don’t quit your dayjob, Steve.
you played a bender Mosher 🙂
dfhunter, Mosh, Paul D, Keith DeH, Gadfly, Racehorse and all: you’ll playing a bender. What a great and informative thread.
Playing a blender?
if you say bender’s name 3 times he might appear.
bender bender bender…..
Is he here yet?
btw, for all who watch with varying bemusement or disgust as each new iteration of Mannian “science” appears, I think we tend to ignore the real ingenuity of Mannian incoherence…. which is the traditional principle in logic and mathematics, sometimes called the “Principle of Explosion” — that from a contradiction, anything is implied, making Mannian Cuisinart science a perfect generator of every result desired:
http://en.wikipedia.org/wiki/Principle_of_explosion
I think you have finally come to the true definition of “new normal” science.
na Steve,3 times cleaning your pool was enough for him.
odd varves laid down.
ps. hope all is well with bender, not a word for a long time ?
One of CA’s strengths is that occasional meta-discussion lies right alongside the real thing (and isn’t that fitting, Plato scholars?) though whiny complaints are ever subject to the purging power of the zamboni.
Anyway, one of the most thoughtful reflections on CA and its boisterous younger sister I’ve ever seen. Thanks Nick and meta-Nick.
Nick Darby said …
” I like to think that we could reasonably discuss these differences over a beer. Meanwhile, I’m glad that he participates here.”
You are missing a rather large boat there Nick D.
At what point would you start doubting Nick Stokes in this hypothetical situation?
http://en.wikipedia.org/wiki/Richard_Haynes
Say you sue me because you say my dog bit you. Well, now this is my defense:
1. My dog doesn’t bite.
2. And second, in the alternative, my dog was tied up that night.
3. And third, I don’t believe you really got bit.
4. And fourth, I don’t have a dog.
As a defender of the AGW theory or papers supporting climate alarmism Nick S does a great job.
As an objective observer or truth seeker Nick S rates an -1 on a scale of 1 to 10.
If you don’t care about being objective and are just having a good time talking about climate related issues then belly up to the bar.
As I learned it years ago:
ON being confronted for not paying back a $100 loan…
1.I never borrowed any money from you
2.It was only $50
3.I paid you back already
How are we to interpret the tree (salix, betula) pollen data? I see no trees at all in the photos posted above. Where is this pollen coming from? Tree pollen can blow a long way, but does this mean that pollen count is a proxy for wind? On the other hand, these species can be shrubs in such a cold climate and not easily visible in aerial photos. Trees are persistent and once they grow above the grass layer (say due to earlier melting of snow) will continue to grow and will thus not be a good proxy for short-term climate. On the other other hand, the size of the area from which water washes in due to roads will surely increase the pollen load (as the pollen vs total organics plot shows). So while there MAY BE some relationship of tree pollen to climate, it is a long way from MAY BE to a quantitative relationship.
How about a steady increase of trees to 50000 specimens at the Arboretum that has, apparently, been established since *1988*, about 20miles north of at Narsarsuaq:
http://en.wikipedia.org/wiki/Narsarsuaq#Arboretum_Groenlandicum
Could the pollen in the lake be a proxy for the well-being of the Arboretum?
http://oiswww.eumetsat.org/WEBOPS/iotm/iotm/20060509_pollen/20060509_pollen.html
It may be a proxy for wind patterns at the appropriate time of year, operhaps.
JF
Craig, agreed.
I’ll limit the discussion to Salix glauca as one commenter has said they are to be found in the region. Most description comes from Canada/Alaska, but we’ll assume similarity to Sth Greenland.
http://www.fs.fed.us/database/feis/plants/tree/salgla/all.html and elsewhere –
(GHS – in general willows are short lived and fast growing).
Salix glauca is an early seral species. It pioneers freshly
deposited river alluvium, glacial outwash, and disturbed areas with
exposed mineral soil, such as road cuts and mine tailings [35]. It is
also common in spruce woodlands following fire, especially in stands
about 20 to 30 years old. It has been found in 160-year-old
open spruce woodlands, but it is usually displaced in densely
forested stands because of its shade intolerance.
This willow produces an abundance of small, lightweight seeds. Like most willows, it
probably begins seed production at an early age (between 2 and 10 years).
Seeds are not shed as they ripen but remain on the plant
throughout the summer and are dispersed in the fall. Each seed has a
cottony down which aids in dispersal by wind and water. These willow seeds overwinter under snow
and germinate in the spring soon after snowmelt.
(But we are looking at pollen, which has an earlier cycle. From elsewhere)
…. willows also produce masses of seeds, each with a tuft of soft, white hairs. Since they are dioecious, with pollen-bearing male and seed-bearing female trees in the population, only female trees produce the actual cotton.
So, to answer some questions.
Paul Dennis, these willows are certainly hygrophilous and/or riparian. (Love those words). (I’ve since read your post on time axis reconstruction below).
For Steve, seed dispersion (not pollen) from females is about coincident with ice melting. However, pollen from male trees needs to move to female trees to form seeds. Pollen is generally short-lived on the tree, being dispersed in days as its catkins disintegrate, as under strong wind. Therefore the main pollen production is likely to be in Spring flowering, with dispersion happening at the same time before the next snow that buries the seeds that result. This can be tied in with whenever you consider the main sedimentation to accumulate in the lake.
There is a neat fit with what I proposed above as a possibility with no evidence, that trees could be planted or grow after some event like a fire, close to the lake where they like to colonise. They could start from zero, grow into a thicket and decay within the 56 year sampling timespan adopted by the authors, leaving a large pollen residue.
Re pollen abundance from plants in general. Although it is a different plant, it is worthwhile noting that one fuzzy brown cattail spike may contain a million tiny seeds. Each seed has a tuft of silky white hairs and is small enough to pass through the “eye” of an ordinary sewing needle. They are shed in clouds of white fluff and float through the air like miniature parachutes. A cattail marsh covering one acre may produce a trillion seeds, more than 200 times the number of people in the world. For each seed there was a grain of pollen, or even several times that if a high % of pollen grains were infertile or unfertilized.
Geoff, thanks for confirming the succession and the competetive nutrient uptake problems. When one adds land use changes that can effect not only what you quoted, but the nature of succession that can be effected by continuing or stopping land use changes and climate changes as well, the assumptions have grown overwhelming for the paper to just hand wave, IMO.
What about the pollen that is entrained in the glacier, then released in the melt? It seems that could release centuries of pollen in one relatively short event into the lake.
tty, Craig Loehle,
From the Gauthier paper
It is noted that a reduction in B. pubescens is difficult to interpret, as it could indicate either a worsening climate or just increased use of firewood.
Steve, I’ve been worrying myself about the Igaliku data all day (whilst I’m trying to write a different paper at the same time!). I’m pretty sure that the sharp up-tick in the PAR and the MAR (both organic and mineral) is an artefact of the spline function they’ve fitted to the age-depth relationship. Here’s my reasoning. Plotting the depth versus Pb-210 and Cs-137 ages given in table 1 of the paper gives two different sediment accumulation rates (SAR’s). Between -35 and -57.6 years (0 and 5cm) (measured with respect to 1950(?)) the SAR is 0.2 mm per year. Between 115 and -35 years (5 and 13.5cm) it is 0.1mm per year.
The MAR for organic matter you plotted is calculated, according to the paper, from the following formula: MAR = WC*WBD*OM*SAR.
Over the top 13.5 cm the water content (WC), wet bulk density (WBD) and organic matter (based on TOC) vary by only small amount percentages. Thus the near surface variation in MAR is driven by changes in SAR. However the SAR only changes by a factor of two meaning the MAR should vary by a factor of two or there abouts.
Your plot shows more than a factor of 10 change in MAR. I think this discrepancy can only be due to the curve fitting for the age model which is becoming ever steeper towards the surface and doesn’t represent the true age profile.
We don’t have the number counts for the pollen but the similarity of the PAR and MAR curves leaves me virtually certain that the number counts are probably invariant with near surface depth too and that the uptick in PAR is driven by the SAR model too.
My conclusions are based on the plots in the paper and I’ll try and download the data and supplementary information for a better analysis.
I wonder if the same thing happened with Korttajarvi.
Re: Steve McIntyre (Apr 30 17:00),
> I wonder if the same thing happened with Korttajarvi.
I don’t believe so (though this is written off-the-cuff). Tiljander2003’s methods are not well-described in the paper itself, but certain online PhD dissertations do provide the information. Prior to analysis, the Lake Korttajarvi cores were dehydrated by infusing them with a miscible organic solvent (acetone or alcohol IIRC), then infused with epoxy resin that was allowed to harden. (This is quite similar to how biological samples are prepared for classical electron microscopy.)
The cores were then cut to a prescribed depth (parallel to the axis of the cylinder), varves were counted, the height of each varve was measured, and, via calibrated analog (film-based) X-Ray photography, X-Ray density was determined. From height and XRD, lightsum (mineral content) and darksum (organic content) were calculated for each varve by a simple algebraic formula.
Key distinction: the water content of the core was reduced to zero prior to analysis. This does not address the compaction issue that Paul Dennis raises at 4:02pm.
amac78, your description of the core dewatering protocol led me to wonder whether a better approach to preserving the structure of high water-content cores would be to infuse acrylamide into them, with something like 2-5% bisacrylamide.
After infusion is complete, the core is exposed to a radical initiator and the acrylamide polymerizes and cross-links into a gel. With a good rigid gel (5% bisacrylamide), the sediment grains would be trapped in place.
A gel-reinforced core should keep its original water content and its original structure and dimensions. So long as it was prevented from drying out, it could be sectioned and examined in any way one likes.
The acrylamide infusion shouldn’t even disturb the original solute distribution, much.
You observers out there, whether you be a defender of climate scientists or a SteveM cheerleader or an informed interested party looking for evidence and clues to make your own judgments, might want to look closely at Paul Dennis responses on the topic of this thread versus what Nick Stokes has presented. What Nick has done is use a reference to a peer reviewed paper statement which in and of itself would appear without further evidence to be a conjecture. I have seen this done in other peer reviewed climate science papers (and I have no reason to believe that this is not a relatively common practice in other less hard sciences like I classify climate science) where by the time a reference is second to third hand it might have lost the conjecture status for the appearance of something more substantial.
I am most interested in hearing more of Paul Dennis observations and analysis no matter where it might lead.
“The intermediate geographical setting of Lake Igaliku, between the Greenland ice sheet and the Atlantic Ocean,
provides also a unique opportunity to link the lake-sediment record to ice core records, fjord shelf marine records
and deep Atlantic marine records in the wider context of oceanic and atmospheric circulation above the North
Atlantic region.”
http://adsabs.harvard.edu/cgi-bin/nph-data_query?bibcode=2010EGUGA..12.1199M&link_type=ARTICLE
Keith DeHavelle
+1
a lonely tree
in a sea of mud
picked up
by a climate scientist TM
heaved up and
a core was taken
of Mister Briffas hat
it proved to have
temperature information.
@amac78 & pat frank
Thank you for the details on core preparation above
Very interesting and pertinent to an issue I currently have in an ongoing project
I’ve observed over time that serendipity actually does happen occasionally 🙂
I’ve now looked at the age model used by Massa et al. They use this model to determine the sediment accumulation rate (SAR) which is involved in all the calculations of organic and pollen accumulation rates (MAR and PAR). I was interested in the very sharp rise in MAR posted by Steve above and had a hunch it was largely driven by the age model and did not reflect the real data.
Briefly the age model is a cubic spline fit to the raw data over the whole profile. It does not fit well the modern section of the profile where there are Pb-210 and Cs-137 dates available. The extent of the discrepancy can be seen at 14 cm depth where there is a Pb-210 date of 1835 (calendar years). The age model gives a date of 1770.
Figure 1. Igaliku age model.
Moreover the SAR’s are calculated on the basis of the model ages. In essence they are the local differential of the spline function. Thus near the surface the sedimentation rate (where the model is a good fit to the data) is about 1.8mm per year. Using the actual age data and using a linear fit over the first 5cm also gives 1.8mm per year. (R^2 = -0.998). However at 14 cm depth the age model gives a sedimentation rate of just 0.26mm per year. Using the raw data between 5 and 14 cm depth the age-depth relationship is again linear (R^2 = 0.994) with a sedimentation rate of 0.7mm per year, or nearly three times lower than the age model.
The smooth change in model sedimentation rate between 0.26 and 1.85mm per year (a factor of eight) over the last approximately 200 years accounts for the factor of eight increase in MAR and PAR in the plot Steve has shown. i.e. a part of the uptick is simply an artefact of the age model and is not borne out by the raw data.
Of more concern to me is that I suspect that the near surface data is pretty unusable because of disturbance to the sediment during coring etc.
Perhaps the moral of the story is caveat emptor. Willis Eschenbach has a favourite maxim which is to always go and look at the raw data. It’s always very instructive.
Nicely done Paul.
So much of climate science looks far different when the raw data is inspected.
Is a summary of Nick’s argument: Since the authors criteria doesn’t exclude contaminated proxies we should only critique their methods and be happy with there conclusions?”
I believe Mr. Stokes would reply:
It doesn’t really matter if it’s true
As long as the data passed peer review
No,
He takes a defensible position. These studies set out to do continental reconstructions. They adopted a methodology for proxy selection and used several methodologies for reconstruction. In this case the original authors documented the existence of non climate related effects on the data. They stated, but did not demonstrate, that the proxies, despite these issues, suggested changes in climate.
This “suggestive” relationship is enough justification, in Nick’s mind, to compute the numbers.
As a reader of this science I can see that argument. Nothing in the original text suggested they were un usable.
But, I’d have to be pretty stupid and incurious not to check the results with and without this proxy. While the suggestion that the climate signal may still be there is enough to get me to compute the number, the fact of overprinting makes me want to heck this in some manner.
I mean seriously, in my spare time I’ve done dozens of analyses of the temperature data and the question of
urban heat island contamination. In the presence of contamination one could argue that this contamination was merely “over printed” on the real climate signal and that the data, despite the contamination, still showed the change in climate– but screwed up the magnitude maybe.. So a curious person will check.. whats my data look like with and without these stations. An incurious person merely says “GHCN blessed this data, it is not my place to check, it is my choice to take their results and build upon it” The incurious get published. They build on what came before.. someday folks may find out that a lot of stuff is built on quicksand.. or not.
Another example: I see a rural station sticking out like a sore thumb from all other stations with a huge rise in temperature.. WTF? WTF? oh, look the temperature starts to change exactly during that period when a dam was built nearby ( Orland california) .. shit maybe I should control for that when I select stations. ( I’ve seen this effect in a couple places )
Finally, simply because I think Nick’s position is defensible does not mean I agree with it. I think it’s in curious and I suspend judgment about the paper until its done in a more rigorous manner.. who knows if they publish their code it might be fun to do a kind of cross validation where one drops proxies out to see the effect. Basic shit.
“Is a summary of Nick’s argument: Since the authors criteria doesn’t exclude contaminated proxies we should only critique their methods and be happy with there conclusions?””
No. The summary is that a decision process is needed. People can always think up objections. It can go on for ever. Pages2K rules are that the decision process sits with the original author, journal and peer review. They think about this stuff too, you know, and may know a little more than you.
Ah yes, the venerable ‘appeal to authority’, always a sure-fire winner.
Well, who do you think should decide?
Nick,
your “ex post” arguments are lawyerly and go beyond any specific policies recommended here.
I’ve argued in favor of identifying data that are ex ante believed to be proxies e.g. treeline white spruce, ice core d18O, .., and against ex post screening of such networks. The Briffa 1998 MXD network, the Antarctic networks of PAGES2K and Steig et al 2013 appear to be efforts in that direction. (Without necessarily endorsing everything.) I argue against the use of multivariate methods that can introduce flipping.
At the same time, I obviously argue against the use of contaminated data, such as the modern portion of the Korttajarvi sediments.
People have sometimes argued that being against ex post screening necessarily requires me to include the contaminated Korttajarvi sediments. Your argument in respect of Igaliku is a variation of this.
So how does one develop a policy that, on the one hand, prevents ex post screening of ice cores or tree ring chronologies within a network, and, on the other hand, has sensible results when confronted with data contaminated by non-climatic factors?
The PAGES2K Arctic policy attempted to deal with the Korttajarvi situation as follows:
For some reason, you didn’t include this. It is very clear that the original authors suggested that the top portion of the Igaliku sediments were compromised by human influence – with explicit discussion of diatoms, erosion etc. Your argument is that the original authors did not concede that pollen accumulation was compromised by human influence. If one is trying to do engineering-quality work, I think that you have to take the position that the authors have pointed out the sediments have been “compromised by human influence” and that there is then a very strong onus on anyone using these O-rings to directly show that the pollen accumulation rate has not been compromised – something that has not been done.
Another important distinction in the Igaliku case is that it is the only example of a pollen accumulation rate proxy in the PAGES2K network. Policies that make sense for networks of 20 or 50 like proxies can hardly be extrapolated to oddball singletons, as you argue.
Most of all, my policy against ex post screening does not commit me to Mannian garbage cans. Collating networks of like proxies is useful; garbage cans aren’t.
“Your argument is that the original authors did not concede that pollen accumulation was compromised by human influence.”
It isn’t that they “did not concede”. It’s that they explicitly expressed their view that it wasn’t compromised.
“Despite the possible influence of land use, pollen accumulation appears to document climatic changes of the last millennia nonetheless.”
There’s no way you can construe that to be a suggestion that the data needed to be modified, which is what their “Tiljander clause” would require.
Ex post is a lawyerly phrase, but I didn’t invent it. I’ll re-quote here what you said re Mt Logan a few days ago:
“Perhaps the greatest single difference between being a “real climate scientist” and policies recommended here is that “real climate scientists” do not hesitate in excluding data ex post because it goes the “wrong” way, a practice that is unequivocally condemned at Climate Audit and other critical blogs which take the position that criteria have to be established ex ante: if you believe that treeline spruce ring widths or Arctic d18O ice core data is a climate proxy, then you can’t exclude (or downweight) data because it goes the “wrong” way.”
Your complaint, expressed in Fig 1, is basically that it goes “the wrong way”.
Steve: my issue with Igaliku is contamination of the recent portion of the core by land use – the same issue as Kprttajarvi. As I said above, Mt Logan was only one of numerous Arctic d18O ice cores. I objected to its exclusion because of armwaving attribution to “regional” changes, while the issue with Igaliku, as Korttajarvi, is contamination by human land use. As I also said above, objecting to ex post correlation screening does not commit one to accept contaminated data, as you argue here. I discussed ex post screening in the context of a population of like proxies, not in the context of a Mannian garbage can. I’m obviously aware of Korttajarvi. I haven’t specifically tried to formulate a policy that would protect climate scientists from all forms of stupidity: as an explicit policy against ex post screening of like proxies, while rejecting contaminated data.
We know that the top portion of Igaliku is contaminated by human activity. There are plausible reasons within peer reviewed literature for believing that the admitted form of contamination would extend to pollen accumulation rate, though, as you point out, the authors “suggest” otherwise, but without providing any evidence to support their suggestion and without any argument to show why their site would be immune from the effect.
There is a big difference between rejecting data because there are reasonable grounds for believing it to be contaminated and ex post correlation screening. Refusing to concede this is the sort of wilful obtusesness that we saw with real climate scientists purporting not to understand the problem with Mann’s use of upside down Tiljander.
No, Nick, Steve is not saying that “it goes the ‘wrong way'”.
The complaint is clearly that the magnitude of the change is not consistent in any way either with the earlier behavior of the proxy nor with any of the other proxies shown throughout their entire time span. The relative magnitude of this single proxy would have an inordinately large effect on the end result. Combining this with the admission of contamination of that portion and the lack of any scientific evidence justifying the “suggestion” that this can be ignored in the paper which originally discussed that proxy, you would think that a scientist such as Kaufman would either omit the proxy or remove the offending section.
What ever happened to common sense?
Nick, do you have an opinion on accounting (or not) for compaction?
Nick
The original authors say that “pollen accumulation appears to document climate change” which is a pretty weak statement. Why is this any better than another recent case where the data shown in the paper but was “not robust”?
“I discussed ex post screening in the context of a population of like proxies, not in the context of a Mannian garbage can.”
So it is equivocally condemned?
But I actually asked a question that you responded to. One can always find something to worry about in a proxy. That can go on for ever. Pages2k need to have a policy on when and how a in/out decision is to be made. And they have in their rules delegated that to the original authors, their journal and reviewers, whose job it is to make that decision for publication. Do you think they should follow some other decision policy? If so, what?
What about evaluating things on a basis more dispassionate than that of an author who has invested a great deal of time and effort gathering the proxy materials, doing the physical and mathematical analysis, and writing the paper up? I would be surprised if such an author would seriously admit to such failings in their work. And yes, of course, this work was peer reviewed, a virtual guarantee that it is spotless.
A decision policy should be set up to prevent bad decisions (including confirmation bias), not to force one into accepting faulty proxies simply because the proxy satisfies some simplistic set of rules. If the reasons for re-evaluating proxies and deciding to alter or not use some of them were properly detailed, do you not think that this might be a proper modification to your suggestion of a mindless adherence to such rules?
TerryMN,
“Nick, do you have an opinion on accounting (or not) for compaction?”
This is usually spoken of in terms of varve thickness, which is not the measure here. Paul Dennis has raised issues about whether the top layer SAR is measured accurately. I don’t want to butt into his discussion with Richard Telford there. But the numbers do imply a lot of recent pollen, on any reasonable reading of the age sequence.
Nick –
“Despite the possible influence of land use, pollen accumulation appears to document climatic changes of the last millennia nonetheless.” I read the sentence with an emphasis on the “millennia”; that is, the recent centuries’ records are influenced by land use, but [before that] the pollen concentration reflects climatic effects.
More generally, I’d like to know why a statement that “pollen accumulation appears to document climatic changes” can be interpreted mathematically as “pollen accumulation is linearly related to temperature, plus a noise component”. For example, before 5000 BP the pollen count is dead flat: does that imply that the temperature was constant? It seems more plausible that the flora was just very limited at that time.
HaroldW,
“but [before that] the pollen concentration reflects climatic effects. “
They go on in that para to spell out some recent dates, including:
“The sharp increase of Salix/ Betula pollen accumulation rate after 1920 AD (Fig. 6) suggests a rapid warming, which reversed the Neoglacial cooling trend similar to other locations in the Arctic (Kaufman et al. 2009).”
“…is linearly related…”
They use several ways of aggregating, including the pairwise method. I don’t think they all assume linearity. In any case, no paleo proxy gives guaranteed linearity.
Romanm,
“The relative magnitude of this single proxy would have an inordinately large effect on the end result. Combining this with the admission of contamination of that portion and the lack of any scientific evidence justifying the “suggestion” that this can be ignored in the paper which originally discussed that proxy, you would think that a scientist such as Kaufman would either omit the proxy or remove the offending section.”
Remember what Tingley and Huybers said re Mt Logan, which exclusion earnt “unequivocal condemnation”?
“We exclude the Mount Logan series that is included in [35] because the original reference [36] indicates it is a proxy for precipitation source region and is out of phase with paleotemperature series. “
They at least did have explicit support from the original authors for exclusion, saying it was due to precipitation. And the temperature dived by at least 6°C, which would have an inordinately large effect, and was indeed out of line with other proxies. But … unequivovally condemned.
Steve: there is no evidence that Mt Logan is contaminated by land use impacts. The issue is climatic. How do you know that Austfonna didn’t go up extra because of regional changes?
Romanm,
I’ve tried to respond, but it’s awaiting moderation.
“So it is equivocally condemned?
But I actually asked a question that you responded to. One can always find something to worry about in a proxy. That can go on for ever. Pages2k need to have a policy on when and how a in/out decision is to be made. And they have in their rules delegated that to the original authors, their journal and reviewers, whose job it is to make that decision for publication. Do you think they should follow some other decision policy? If so, what?”
One approach which I recommended a few is not not make ex ante decisions ( each having uncertainty) about what data to use and what data to exclude, but rather to include all data, process all data and report results of all data.
( or half the data if you like)
And then test for sensitivity to factors that are known or suspected to change results in a meaningful way.
I will use temperature stations as an example. Rather than setting out ex ante criteria such as
a station with 30 years of data, a station with 90% of its data, a station in rural areas, thusly defined
I think its far more instructive to look at all the data ( or half if you like ) and then condunct a sensitivity test on “years of data” “suspicion of contamination”
In the present case one would simply look at the answer with and without proxys that have evidence of contamination/ no evidence of contamination.
If one found that inclusion of this series had a material impact then one simple reports both results and then makes an argument about whether or not this “over printing” is material. But clearly since there is evidence increased human activity ( co linear prhaps with temperature increase ), it is a variable you want to test.
A finding of no difference with and without would lend strength to the conclusion , just as a finding of with and without rural or with and without airports lends crendence to the temperature record. In fact, it is just this kind of testing that has made me confident that the issue of “contamination” of temperature stations, WHILE REASONABLE ON THEIR FACE, don’t hold up upon rigorous examination.
Put another way. Every time I read a paper where they set out ex ante decisions about inclusion/ex clusion of data, my first response is ” I want to see the effect of those decisions” And if they left out obvious ex ante conditions ( we only use proxies that have no evidence of contamination) then I will want to see the effects of FAILING to make sound ex ante decisions. As I read the papers the modern period response is going to a function of climate and human activity ( which are no unrelated ) so one wants to see what happens if you limit your sample to those with just a climate signal in them
Roman,
I’ve tried twice to respond, but stuck in moderation. I’ll try a different tack.
You say:
“The complaint is clearly that the magnitude of the change is not consistent in any way either with the earlier behavior of the proxy nor with any of the other proxies shown throughout their entire time span. The relative magnitude of this single proxy would have an inordinately large effect on the end result. Combining this with the admission of contamination of that portion and the lack of any scientific evidence justifying the “suggestion” that this can be ignored in the paper which originally discussed that proxy, you would think that a scientist such as Kaufman would either omit the proxy or remove the offending section.”
Well, compare with Tingsley/Huybers and Mt Logan. They had a very large magnitude change (6°C), not consistent with any other proxies through their span. There was admission of a cause – precipitation dependence, and in this case the original authors said that ” In this part of North America d(18O) is not a measure of past temperature but a “source-meter,” indicating the relative connectedness of these Northern sites to either tropical or North Pacific water sources.” A very explicit statement from the original authors that it is not a temperature proxy. So T/H said:
“We exclude the Mount Logan series that is included in [35] because the original reference [36] indicates it is a proxy for precipitation source region and is out of phase with paleotemperature series. “
And for this they were, in the phrasing I quoted above, “unequivocally condemned”.
So what’s your point? The fact that someone does indeed make such a decision regarding a proxy does not mean that it must be beyond reproach. The reasons for justifying it can be evaluated and possibly criticized. This is how science is done.
IMHO, much of the problem with the field of paleo reconstructions is rooted not just in the various rules of proxy selection but in the simple fact that the methodology does not include diagnostic procedures to evaluate the proxies and their individual effect on the reconstruction. E.g., when a statistician does a regression, there is a list of evaluations which they can use to determine the quality of the fit and how each of the points impacts on the overall result. Nothing like this is part of the procedures used by the climate scientists. A blind adherence to selection rules means that a possibly inappropriate proxy such as the one under discussion cannot be dealt with – once a proxy is in, there is no methodology for its removal. But that is a somewhat different issue.
There’s another Pollen.SUm series in the Kaufman JOPL 2012 collection http://www.ncdc.noaa.gov/paleo/pubs/jopl2012arctic/jopl2012arctic.html from Unit Lake, Manitoba ftp://ftp.ncdc.noaa.gov/pub/data/paleo/paleolimnology/northamerica/canada/mb/unit2012.xls. The pollen sum is in column BU of the 7th worksheet “Pollen”. Needless to say, it doesn’t have the Igaliku hockeystick. The preceding columns appear to be components of the Pollen Sum, but they don’t add up to the total. Explanations welcomed.
Steven,
I’ll respond briefly, because I have now three attempted responses to Roman in moderation, and I don’t know where this one will go. I certainly don’t recommend incuriosity; I’m quite curious myself. I believe the Pages2K folk may have done what you suggest. In their FAQ:
“In addition, each of the records used in the continental temperature reconstructions were analyzed separately at the site level, and without assumptions about the relation with regional temperatures, to determine the extent to which some of the primary conclusions are robust. The results show that the long-term cooling trend and recent warming are predominant features of the site-level records; however, a sizable fraction of the records do not conform to the overall average, highlighting the importance of spatial variability at the continental scale.”
They have written a big report which they describe as a progress article – more may come.
Thanks Nick,
that sounds like what I would be after.
Nick – This is usually spoken of in terms of varve thickness, which is not the measure here.
Are you sure about that?
“The preceding columns appear to be components of the Pollen Sum, but they don’t add up to the total. Explanations welcomed.”
It might be a custom PollenSum, you show all the pollens in the DB but your pollenSum is handcrafted to only select certain pollentypes.
Re: Steven Mosher (May 1 19:251),
With respect to the current discussion of the Lake Igaliku sediments, the handling of the Lake Korttajarvi/Tiljander sediment record in other multiproxy paleoclimate reconstructions has been raised as a precedent.
It’s interesting to note that Mann and colleagues did perform a test akin to the one that Mosher suggests here — and that the result of excluding the contaminated Tiljander data was that the key “non-dendro” reconstructions failed the authors’ validation tests, even as lax as they were.
The original furiously-defended paper was Mann et al (PNAS, 2008), while the results of the test were buried in a graphic in the Supplemental Information of Mann et al (Science, 2009), and not discussed in the paper itself.
It was, I believe, Geoff Sherrington who, in the comments of a RealClimate post, got Gavin Schmidt to grudgingly concede this outcome (alas, I lack a cite for that exchange).
Given that history, it was curious to revisit “Tree Rings and Climate: Some Recent Developments,” the 8 July 2012 RealClimate post that Steve McIntyre links in the body of this post. Those bloggers made a silly argument that requires the inclusion of Tiljander in the non-dendro reconstruction, referred to as “the blue curve” —
All scientists are tempted by analyses that tell an interesting tale, and few outcomes are more boring than “it failed to validate.”
One reason to bring this up is to help Nick Stokes refine his position on Igaliku. The story reminds us of the merits of ex ante rules, and of the continuing need for common sense, and of the virtues of Mosher-style tests. And, as well, of the importance of reporting tests, however unwelcome their results may be.
“The preceding columns appear to be components of the Pollen Sum, but they don’t add up to the total. Explanations welcomed.”
All the data in the preceding columns are percentages.
It’s revealed by the other Pollen Sum in column AR containing only 100s. Columns K-AQ sum to 100 (except for an error in row 25).
The percentages in D-H and BO-BT can all be calculated from different column ranges of the data. eg % aquatics is BB-BF.
Steven Mosher,
“… just as a finding of with and without rural or with and without airports lends crendence to the temperature record. In fact, it is just this kind of testing that has made me confident that the issue of “contamination” of temperature stations, WHILE REASONABLE ON THEIR FACE, don’t hold up upon rigorous examination.”
Indeed you have a robust measure. Unfortunately, you do not know what you are measuring. Changes in regional temperatures? Unlikely, your measurements diverge systematically with the best proxies related to regional temperature as snow and melting anomalies of glaciers.
As Steve has noted in the past…. comments from Korhola and Saaisto on misuses of Tiljander et al. data are rather scathing, considering the excessively “gentle” dialogue of much scientific disagreement, especially where the “Team” is concerned:
For anyone wanting to review the circus act of Mann-Schmidt posturing re Mann (2008) this thread has a lot of helpful info:
Nick,
Please consider for a moment the other 8 proxy data sets shown in Steve’s post (“last 9 of 22” from the paper). Do you see that the other 8 don’t show the same kind of recent rapid change? The thing that is most wrong with the paper Nick is that the authors choose to not do a consistently critical analysis when looking at proxies; they throw out O18 data which indicates cooling, due to an assumed ‘regional’ effect, but choose to cling to data that on its face looks wildly out of line, even in the face of well known large changes in lake sediment due to 20th century farming. As is altogether too common in climate science, it comes down to placing an all-too-obvious thumb on the scale to generate a result consistent with dramatic 20th century warming. You have every right to try to defend such practices, but considering how bright you are, I think you do yourself a terrible disservice. People are not going to ignore the obvious problems with the paper, even if you choose to.
SteveF,
No, it was Tingsley and Huybers who discarded D18O data (with excellent justification) and were heavily criticised here for not following ex ante criteria. PAGES2K did establish ex ante criteria, and are being criticised for following them.
I’m not a fan of heavy-handed ex ante criteria myself, but I am a fan of consistency. And when they have been so emphatically demanded a few days ago as CA policies, it is odd to see them so soon forgotten.
The rule seems to be, if it doesn’t look right to them, science requires that they keep it; if it looks wrong to us, science requires that they discard it.
Steve,
I wrote a response, but it’s awaiting moderation.
Re: Nick Stokes (May 2 18:53),
Nick, just checking to ensure your comments are no longer stuck? I looked and I don’t see any problems… just want to be sure!
MrPete
MrPete,
Thanks for checking. It seems to depend on length; short comments always get through, but more than about 8 lines get stuck. There’s nothing stuck at the moment.
Nick,
Please take a peek at: http://i44.tinypic.com/2muip.png which shows the consolidated instrumental temperature record for south Greenland since 1880. Do you think that the instrumental record is in any way consistent with the last four data points in Steve Mc’s Figure 2 above? (Not to mention inconsistency with the other proxy records). Really Nick, this is a case where the proxy is grossly in conflict with much more credible thermometer data, yet the authors choose to use it. Wanna bet if the reconstruction would show lots less warming in the 20th century without the pollen record from Iqaliku? As I said before, it is another case where the thumb rests firmly on the scale, even if it is invisible to some.
SteveF,
I don’t think it is a requirement that proxy records have to be consistent with instrumental. On that score, many would fail. Of course, it a separate issue if they are being calibrated from instrumental.
However, I think you may have the wrong idea. Unlike so many here, I am not expert in palynology, and do not claim personal wisdom to back this proxy. I just observe that the original authors (some of whom are indeed experts) have said in a respected journal that it is a climate proxy, and that Kaufman et al, in accordance with their ex ante rules, have accordingly used it. I think that is reasonable, and in the light of CA demands for ex ante criteria, should be applauded here.
Steve: to do proper analysis, I have criticized ex post screening of like proxies and argued for (sensible) ex ante rules. However, I have not blindly endorsed any old ex ante rules. I do not agree with Mannian garbage cans where you grab every series in the ITRDB data base and hope that you can sort things out with multivariate methods. The sort of ex ante rule proposed here has been high-altitude white spruce or Arctic O18 i.e. a class of proxy believed to have a relationship to temperature for physical reasons and with statistical support. I do not encourage the use of ad hoc methods or oddball proxies. To do engineering quality work designed for assessment reports, “pollen sum” would need to be qualified through numerous studies. That seemed obvious in the context of my remarks. Ex ante does not mandate stupidity. If this is too hard for the climate community to understand, no wonder people think so poorly.
Temperatures in Greenland:
http://www.dmi.dk/dmi/index/klima/klimaet_indtil_nu/temperaturen_i_groenland.htm
Narsarsuaq is about 15 miles from Igaliku.
Nick,
We clearly come at this sort of issue from very different perspectives. Independent of ex-ante rules, the obligation of anyone doing data analysis is to exclude data which is either known or suspected to be wrong (and explain why). In this case the authors have included a proxy which fairly well screams that it is wrong, and arm-waved an excuse for using it, which seems to boil down to “Yes it looks like rubbish, but gee, it comes from a respected journal and meets our rules, so we include it.” At an absolute minimum they should have performed the analysis without the doubtful proxy and reported those results as well. Ex-ante rules provide no protection from data snooping or GIGO results… nor do they keep thumbs off scales.
I believe that Racehorse Haynes still has an active legal practice. He represented one of my relatives in a minor skirmish about 2 years ago.
First StMc mentions a “donkey” (April 30 7:25 AM first line).
Then StMo a “dim-witted-horse” (April 30 12:45 PM).
The conversation gets heated.
Meta-comment: I think it used to be common folk wisdom in experimental sciences that an investigator who never threw out bad data would never discover anything, but an investigator who threw out too much data would end up deceiving himself and possibly others (at the extreme constituting fraud). So good judgment and a strong conscience were required to be a good investigator. These traits were to be acquired partly by apprenticeship to a good investigator. (The ultimate scientific check on overly aggressive data selection was of course supposed to be replication by interested researchers trying to build upon one’s work.)
No universally useful algorithm for ruling particular data in or out has been developed and I doubt that such ever will be. Different circumstances and different perceived loss functions will dictate different practices. It is common practice when working with large-sample data sets in economics, for example, to delete observations that are “obviously” spurious outliers, such as firms with the industry code “not elsewhere classified” that have no assets and an infinite rate of return on investment. Some sort of accounting distortion is rightly suspected in such cases. On the other hand, I would imagine that in an array of petri dishes with different levels of a treatment variable, a 10X outlier response in one dish might either be an artifact or contain all the interesting information from the experiment.
Here we have a proxy of a different type from all the others that diverges from all the others and from the temperature record (where available) and that has known a priori contamination issues. Common sense says that any results dependent on the presence of this proxy should be taken as unproven. Or at the least we would want a thorough explanation of why all the other proxies are wrong and this one is right, which would be edifying for future research where we could forget everything but pollen counts.
In my field of exploration geochemistry, our chief was not at all in favour of short cuts. In the hot tropics, he refused to approve air conditioning in field vehicles because field professionals derived information while outside the vehicle breaking rocks, not inside the vehicle reading maps over and over. He was right, of course. Success increases in proportion to intimacy of knowledge.
Now, in relation to this Igaliku debate, there is too much sitting around in offices and not enough intimacy with the location. From photos from Anthony Watts, I could hypothesise that the area shown covered in hay bales had been graded by machinery; and that the logical time to do this would be when the lake was lowest and the ground the least boggy. I could say that machinery would likely have been used after 1920, less likely before, and that the machinery graded the slope down to below the waterline shown in the photos, representing a rather severe recent agricultural disturbance. But these postulates are like sitting in the vehicle reading maps.
What is needed to assist in data intimacy is a communication with local people, asking them what really happened down on the farm.
It is so simple a task. It seems that this has not been done, but instead we have pages of hypothetical discussion (mea culpa). It has generated useless unverifiable comments like “Despite the possible influence of land use, pollen accumulation appears to document climatic changes of the last millennia nonetheless.”
Would someone who speaks the language please write a letter to discover what disturbance, if any, is likely to have occurred?
Surely such direct action is more important, in the case of outliers especially, than theoretical arguments about a priori, ex ante formulations and so on.
It would be so easy, to go back and re-sample using a strategy to minimise soft-sediment deformation. A freezer lance, for example, to solidify the liquid fraction, then core.
Alas, fieldwork, ground truthing etc. are so last century. It’s far more constructive to pick over the minutiae of statistics from the office. A follow-up field trip to fill in the experimental holes won’t look good on the CV.
Three cheers for that. So much of what passes for debate in this area is mere scholasticism and is made so by the extremely tenuous use to which the field work is put. Nick Stokes may twist and turn but the relationship between pollen counts at a particular location and regional temperature (as opposed to the myriad other factors affecting such counts) is as close to science as deriving the age of the earth from Abrahamic regnal lists.
This core is vastly useful for exploring vegetation, and more recently, land-use changes over several millennia. Both have a relationship to climate. But to temperature as a functional proxy? The most that can be said, it seems to me, is that these data support the existence of the Mediaeval warm period and subsequent mini ice age through the evidence of intermittent human activity. Farmers don’t readily abandon their land.
http://www.dmi.dk/dmi/index/klima/klimaet_indtil_nu/temperaturen_i_groenland.htm
Narsarsuaq is close to Igaliku.
AMac, I think Gavin’s comment about non-validation was at another blog, perhaps Keith Kloor.
The chronology of these events was quite interesting. The news about non-validation came as a bolt from the blue in an online comment from Schmidt at RC after a lengthy controversy at numerous blogs in which Schmidt, Vermeer and others had vociferously stated that upside down didn’t matter.
I thought that I’d done a blog article setting out the chronology of events: I did, but, for some reason, I never published it. I’ll take a quick review and publish it, as I don’t think that the events are otherwise diarized.
Nick Stokes Posted May 1, 2013 at 8:57 PM | Permalink
“Well, compare with Tingsley/Huybers and Mt Logan. They had a very large magnitude change (6°C), not consistent with any other proxies through their span. There was admission of a cause – precipitation dependence, and in this case the original authors said that ” In this part of North America d(18O) is not a measure of past temperature but a “source-meter,” indicating the relative connectedness of these Northern sites to either tropical or North Pacific water sources.” A very explicit statement from the original authors that it is not a temperature proxy. So T/H said:
“We exclude the Mount Logan series that is included in [35] because the original reference [36] indicates it is a proxy for precipitation source region and is out of phase with paleotemperature series. “
And for this they were, in the phrasing I quoted above, “unequivocally condemned”.”
Nick, I think you do not see the problems here where a hand wave appears to include or exclude a proxy after the fact. It is rather simple to conjecture why a proxy does not give an expected response to temperature once the proxy has been measured. With Mt Logan I believe the reason given was that the prevailing circulation changed and the O18 that precipitated came from a different (cooler?) location. I would think O18 is a temperature proxy but that the puzzle can be where did that precipitated water containing that O18 come from.
The problem is that most O18 proxies then must have the same potential problem and that for an O18 to be considered a priori as a temperature proxy one must have knowledge of whence that water containing O18 came and for how stable the location of that source must be. I think that in your haste to defend you appear to not provide sufficient details to put these comments on a level higher than conjecture. More to the point though is that when the selection criteria are not based on credible physical reasons for selecting proxies and then subsequently using all selected proxies, the process is going to post facto accept and reject on less than well thought out reasons.
The so called averaging out of the proxy noise in order to provide a temperature signal would have to include all of the a prior selected proxies otherwise you are going to obtain a biased signal based on the expectations of the modern warming period.
Kenneth,
Put it the other way around. What would CA be saying about T&H if they used a proxy which had been said by its authors to be “not a measure of past temperature”? Many pages of Tiljander fuss will testify.
Re: Nick Stokes (May 2 18:59),
> Many pages of Tiljander fuss will testify.
Irony.
did Nick ever concede that there was anything wrong with Mann’s use of contaminated Korttajarvi? If so, where.
Steve,
“did Nick ever concede that there was anything wrong with Mann’s use of contaminated Korttajarvi? If so, where.”
Yes, many times. You could start here. My consistent view was that they should not have been used, and that Mann’s treatment of the issue, via a recalc in the SI, was substantial, if not ideal. and should be ackinowledged.
Opps, link to earlier Tiljander comment here.
Stokes: “Mann’s treatment of the issue, via a recalc in the SI, was substantial, if not ideal. and should be ackinowledged.”
You are a comedian. “via recalc in the SI”. LOL.
Re: Nick Stokes (May 2 11:09 PM & 11:24 PM),
> Yes, many times [I conceded that there was something wrong with Mann’s use of contaminated Korttajarvi]. You could start here. My consistent view was that they should not have been used, and that Mann’s treatment of the issue, via a recalc in the SI, was substantial, if not ideal. and should be ackinowledged.
> Opps, link to earlier Tiljander comment here.
.
More irony, or plain-vanilla comedy?
Nick, there’s a risk that people might click. Your fifty-two contributions to that thread are unimpressive. But if you insist on sending readers there, this is probably what best supports your “yes, many times” claim.
As Co-Chair (with Gavin Schmidt) of the Obfuscation Panel of the Tiljander Club, I don’t think you have standing to testify about “many pages of Tiljander fuss.” But we can check the by-laws.
Sorry, Nick, you are not getting off so easily. Just saying that the proxy “should not have been used” is wholly insufficient. Simple question, Nick: did Mann use the series upside down from the physical meaning (as posited by Tiljander)? Yes, or no? Come on Nick, you can do it. Yes or no?
nevilb,
We’ve been through all this before. I’ll quote myself from the same thread:
“As I’ve been saying, consistently, I think it was just a bad proxy, and whether it was upside down or not is irrelevant. You can’t fix it by inversion – it just isn’t varying with temperature, so getting the sign of the slope right doesn’t get the value right. It should have been omitted.”
Nick,
you’re being less than candid about your position. Your position has been that Mann did not need to issue a corrigendum or retraction of any results of Mann et al 2008, because he had properly informed readers of the impact of Tiljander data in the SI of Mann et al 2008. YOu argued this position at length at CLimate Audit in October 2009 (just before Climategate) here https://climateaudit.org/2009/10/14/upside-side-down-mann-and-the-peerreviewedliterature/#comment-361644. In this thread, it was repeatedly pointed out to you that the Tiljander sediments impacted the no-dendro reconstruction (which had been loudly bruited as a key accomplishment of Mann et al 2008 including the then recent RC post Hey Ya-mal), but you, like the rest of the climate community, were wilfully obtuse to an issue that was immediately obvious to anyone other than a climate scientist.
You returned to the issue in blog comments at Lucia’s in Feb 2010 http://rankexploits.com/musings/2010/no-statistically-significant-warming-since-1995-maybe-or-not/ again, to which you link as your supposed concession. In these comments, you defend Mann again, stating:
and later challenge the idea of Mann issuing a corrigendum, as there was, in your opinion, nothing to put in a corrigendum that was not already on the record in the 2008 SI.
So to be precise: you have conceded that Korttajarvi was contaminated and should not have been used. But you have also stated that Mann et al 2008 more than adequately dealt with the problem and that no corrigendum or retraction was required.
It was and is my position that (1) the no-dendro reconstruction of Mann et al 2008 was a key finding; (2) the contaminated Tiljander sediment had a material impact on the no-dendro reconstruction of Mann et al 2008; (3) the no-dendro reconstruction of Mann et al 2008 should have been retracted, or, less satsifactorily, Mann should have published a Corrigendum at PNAS.
You, on the contrary, have consistently taken the position that Mann had nothing to correct. Is this still your position?
” there was, in your opinion, nothing to put in a corrigendum that was not already on the record in the 2008 SI.”
As to candidness, I have simply pointed to what I actually said, which does exactly answer your question “did Nick ever concede that there was anything wrong with Mann’s use of contaminated Korttajarvi?”.
And yes, I think that renders a corrigendum unnecessary. In fact, I don’t even see how it could be worded – Mann would basically say “what I said in the SI is true”.
Steve: without the use of contaminated data, key results reported in Mann et al 2008 are false. Mann’s statements in the SI were incomplete and misleading. That you and members of the “community” don’t get this is one of the things that discredits both.
Nick Stokes:
How lawyerly. The point is that the no-dendro reconstruction should have been retracted. No pain, no gain.
“As I’ve been saying, consistently, I think it was just a bad proxy, and whether it was upside down or not is irrelevant. You can’t fix it by inversion – it just isn’t varying with temperature, so getting the sign of the slope right doesn’t get the value right. It should have been omitted.”
Hang on. The Igaliku pollen proxy doesn’t vary with temperature – showing as it does a massive spike that does not appear on the temperature record, preceded by a fall in temperature that also does not appear in the temperature record.
So if you are being consistent, should it not be omitted?
Racehorse,
You duck the question again, claiming it is “irrelevant”. Whether or not it’s irrelevant (which no-one other than you seems to claim. Mann certainly doesn’t based on his bizarre PNAS response), you can still answer it. Again, it’s a really simple question. I’ll ask it one more time: did Mann use the series upside down from the physical meaning (as posited by Tiljander)? Yes, or no?
Mooloo,
“The Igaliku pollen proxy doesn’t vary with temperature”
That’s your assertion. The scientists who analyzed it say otherwise, which is what is relevant to the PAGES2K criteria.
So, Nick, is your view then that according to the PAGES2K criteria that Tiljander can be included? After all, Tiljander did claim that the series “is chronologically comparable with the well-known ‘Medieval Warm Period’”
“The Igaliku pollen proxy doesn’t vary with temperature”
That’s your assertion. The scientists who analyzed it say otherwise, which is what is relevant to the PAGES2K criteria.
No, it’s not my assertion.
I quote Massa et al: “Anthropogenic influences, which began with the Norse colonization around 1000 AD, preclude paleo-climatic interpretation during the last millennium.” and “Despite the difficulty in interpreting Lake Igaliku sediments solely in terms of climate change,” and “Since 1 cal ka BP the climatic-driven changes were overprinted by the human influence of Norse and recent agriculture.”
The study seems to me to be quite clear in its attempt to determine the Holocene Thermal Maximum. It pretends no more than that and indicates time and again that recent values are affected badly by agriculture.
That the authors think the lake tells us about the long distant past cannot be read as confirmation that it tells us about the recent past. Stop reaching.
Mooloo,
Well, I’ve given my quotes, which are quite explicit on the pollen proxy, and in particular the period since 1920. Yours seem to relate to the multi-proxy aspect. I’d remind you of how the paper ends:
“As in other locations in south Greenland, a more signicant cooling is recorded ~3 ka BP, with a decreasing pollen accumulation culminating with the end of Little Ice Age. This long-term cooling trend was reversed during the 1920s by recent warming”
Sounds like they think they are learning about recent temperatures.
Enlighten me Mr. Stokes. How does one “document” a “temperature signal” in a proxy without a comparison to temperature?
Will JR
You’ll have to read the papers for that enlightenment.
This long-term cooling trend was reversed during the 1920s by recent warming”
But we knew this without any need to core the lake.
What Massa et al did not say was that the pollen was a proxy for that rising temperature.
Your [quote]s seem to relate to the multi-proxy aspect.
You mean the multi-proxy aspect of a multi-proxy study? Of course that’s what the quotes relate to. That’s what it was. (If I picked a quote relating to only part of the study you would doubtless complain I wasn’t taking the study as a whole.)
You appear to be saying that the fact that the authors say that the multi-proxy aspect is no good at determining recent temperatures in no way affects your belief that one of those proxies is good for temperature! That beggars belief, to put it mildly. You think that they write a paper on the multi-proxy study to determine paleo-temperature, where they could just have used the pollen alone? Do they say that pollen is the best proxy?
I might add your selected quote above about the long term cooling trend being reversed is also not related to pollen, but to the whole (multi-proxy) study. The paragraphs in question are led in by “The multiproxy approach used in this study highlights … “. Nothing at all about pollen.
Mooloo,
“What Massa et al did not say was that the pollen was a proxy for that rising temperature.”
Yes they did. It is a shorter version of part of my original quote, now in the head post:
“The sharp increase of Salix/ Betula pollen accumulation rate after 1920 AD (Fig. 6) suggests a rapid warming, which reversed the Neoglacial cooling trend similar to other locations in the Arctic (Kaufman et al. 2009).”
“The sharp increase of Salix/ Betula pollen accumulation rate after 1920 AD (Fig. 6) suggests a rapid warming
a) “suggests”? “suggests”??!!eleventy!! You are prepeared to defend a critical PAGES proxy on “suggests”? That’s weak, even by your standards.
2) a link between an increase in pollen and warming doesn’t make it a proxy. You know that, since you aren’t simple. Show where they say pollen is a proxy into this century!
3) I can’t find that sentence in the paper. A search of the paper does not turn up any of the key words. [Steve: see page 15 of Massa et al J Paleolimn 2012]
What I can find is what the paper is about: ‘The main objective of this study is to describe the major environmental changes that affected Lake Igaliku and its catchment since the last glacial retreat, with a special emphasis on the timing and nature of the Holocene thermal maximum and the onset and signature of Neoglacial cooling”. The paper doesn’t set out to be about anything other than the Holocene Maximum. It really is quite specific that it cannot be taken to be about recent periods. Really specific.
Nick Stokes, the point I am making has nothing to do with what anybody would say about the use of a proxy but rather why an a priori method is required and why we have conjectures on the use or non use of proxies selected after the fact.
The past objections to Tiljander, used upside down, in the larger context was that because you do not have a selection process before the fact those doing reconstructions use proxies willy nilly as fits their purposes. And you do those doing reconstructions no favors by pointing to their reasons which without providing any hard evidence come across as conjectures.
Kenneth,
“why an a priori method is required… “
I don’t see how that differs from my point re Pages2K. Strict a priori specifications aren’t my personal enthusiasm, but you like them; Pages2K adopted a clear ex ante rule and followed it. And are being criticised here for doing so.
Nick, I have excerpted the Arctic2k group proxy selection criteria as an example from all the groups contributing to Pages2k and provided a link that describes the others groups criteria for proxy selections.
Click to access ngeo1797-s1.pdf
“The proxy records selected by the Arctic2k group for the Arctic continental-scale
temperature reconstruction (Fig. S7) meet the following criteria: (1) situated north of
60°N, (2) extend back in time to at least 1500 CE, (3) have an average sample
resolution of no coarser than 50 years, (4) include at least one chronological reference
point every 500 years, (5) exhibit a documented temperature signal, and (6) are
published in peer-reviewed literature as a proxy for temperature, although not
necessarily calibrated to temperature (i.e., some records provide only a relative measure
of temperature with unknown transformations between the proxy measurement and
temperature).”
I have noted before that you appear to have the trait I find with some climate scientists in that they use peer reviewed literature with a very loose and non detailed approach.
The Pages2k groups did not use an a priori approach to proxy selection, but rather used the very standard climate science approach and statistically improper method of looking at how the proxies performed in the instrumental period and making selections based on that analysis. That insures that the proxies are biased and further that proxies with little or no temperature signal but with meandering trends throughout the series that happen by chance to end in an upward trend can be used.
To then put the proper interpretation on your comment that those doing the reconstructions used an a priori selection rules, merely says that they used rules which actually select proxies after the fact. In doing so they also show once again that they do not understand the consequences of what they are doing and by your defense of it showing that you do not either.
Kenneth,
“The Pages2k groups did not use an a priori approach to proxy selection, but rather used the very standard climate science approach and statistically improper method of looking at how the proxies performed in the instrumental period and making selections based on that analysis.”
Sorry, I just cannot see your basis for saying that. You’ve quoted the Arctic2k criteria, and it’s nothing like that.
Nick, I know you like to be obtuse when the purpose suits you but the part of the excerpt I have reposted below is very clear. The selection of the proxies are based on a documented temperature signal which means in light of the only know method of determining that signal would be to compare the proxy response during the instrumental period to the instrumental record. That is selection after the fact and that is what leads to a bias in the proxies showing an ending upward trend
“(5) exhibit a documented temperature signal”
Perhaps what I am saying about the consequences of selecting proxies after the fact would make more sense to you if I pointed to the fact that proxies obviously contain noise. Now it might well be that that noise is not sufficiently random to cancel out when a large number of proxies are used in a reconstruction (and thus making the proxies useless as reasonable historic thermometers) but that certainly is a theory that must be applied if the proxies are to have any meaning with reference to temperature response. Following that logic and without the strength of good physical reasons for validating proxies as thermometers, the second or perhaps third best approach would be to use all the proxies available regardless of their response in the instrumental period. You need that cancelling of random noise not just in the pre-instrumental period but also in the instrumental period or you will be biasing the reconstruction.
No Kenneth, I think the obtuseness is yours. You said that the PAGES2K group ” used the very standard climate science approach and statistically improper method of looking at how the proxies performed in the instrumental period and making selections based on that analysis.”
and that simply isn’t the truth. Nothing like it. You can’t expect to get the kind of answer you want by leading with such gross misstatements.
You now seem to object to their simple requirement that there be a “documented temperature signal”, ie that someone, somewhere things there is a temperature signal in there. Well, that’s just an elementary starting point requirement. What do you think they should start from?
“No Kenneth, I think the obtuseness is yours. You said that the PAGES2K group ” used the very standard climate science approach and statistically improper method of looking at how the proxies performed in the instrumental period and making selections based on that analysis.”
and that simply isn’t the truth. Nothing like it. You can’t expect to get the kind of answer you want by leading with such gross misstatements.
You now seem to object to their simple requirement that there be a “documented temperature signal”, ie that someone, somewhere things there is a temperature signal in there. Well, that’s just an elementary starting point requirement. What do you think they should start from?”
Nick, you still are unable to comprehend that by selecting proxies after looking at how the proxy series corresponds with the instrumental record (which could well be by chance without other evidence) you are going to bias the reconstruction – and for the reasons I explained above. The preferred method is to have substantial physical evidence for using a proxy as a temperature indicator and then use all the proxy data and here you avoid the problem of biasing by selecting after the fact. The Arctic2k group did select proxies based on evidence after the fact and that is what I said in my comment. That your tone has become more strident in incorrectly saying that I lead with a gross misstatement indicates to me that I have hit a nerve.
I think the PAGES2K authors relied on OTHER AUTHORS who “selected after the fact”. Or, rather, the other authors went through the data they had, and deemed various cores/varves/trees as worthy and others as unworthy, and subsequent authors simply defer to their work without having to review and redo them. In a way, the PAGES2K people (though perhaps knowing the errors/dangers/questions that exist) shouldn’t be as faulted in this arena as these original authors who have made it easy to just defer to their expertise in being the arbiter of proxies. If PAGES2K plainly states that it’s going around through the available data/literature for valid proxies as determined by their originators, then your beef should be more with these original authors rather than PAGES2K.
However, the funny business comes when a desired proxy has already been shown to be invalid but is used anyway. Then certainly there is more beef 🙂
“I think the PAGES2K authors relied on OTHER AUTHORS who “selected after the fact”. Or, rather, the other authors went through the data they had, and deemed various cores/varves/trees as worthy and others as unworthy, and subsequent authors simply defer to their work without having to review and redo them. In a way, the PAGES2K people (though perhaps knowing the errors/dangers/questions that exist) shouldn’t be as faulted in this arena as these original authors who have made it easy to just defer to their expertise in being the arbiter of proxies. If PAGES2K plainly states that it’s going around through the available data/literature for valid proxies as determined by their originators, then your beef should be more with these original authors rather than PAGES2K.”
Salamano, my point is that proxies are selected after the fact and by doing so it bias the reconstruction to end more or less agreeing with the instrumental record and eliminating proxies that well could contribute to the averaging of random noise by having series ending downward trends. I could care less who did the selection, although in this case I went back as far as I could with all the continental proxies in Pages2k and found that in some cases one has to go back to original authors to determine exactly how the selection after the fact was carried out. Interesting that the selection is usually and most directly performed by correlation with the instrumental record either through weighting the proxies by correlation and/or selecting based on correlation. Less direct selection but selection after the fact nonetheless (South America) was where the calibration optimization was related to which proxies were selected.
There is selection after the fact involved with all the continental reconstructions in Pages2k and it is well documented for those who care to read the SI that I linked above. In some cases it requires following the references back to the original authors. I could put the quotes here chapter and verse but I think it is better for the defenders to see it for themselves. In Nick’s case I think it is more the failure to comprehend the significance of selecting after the fact than realizing that selection after the fact has occurred.
Also of note is that some of the proxies in the Pages2k reconstructions are instrumental.
here is a plot of pollen accumulation vs mineral matter accumulation in the same interval for the 7 pollen measurements since 1750. The pollen intervals (1 cm) do not exactly overlap the mineral intervals (0.5 cm) and so weighted averages were taken. There is an obvious relationship between erosion (indicated by mineral matter accumulation) and pollen accumulation. Massa could just as easily “suggested” that erosion was a proxy for temperature.
Steve, thanks for posting this plot. That was the point I made several days ago when I stated that the MAR’s and PAR’s all increased by a factor of 8 or so and just reflected their putative increase in sediment accumulation rates.
Of course their age model, as I’ve posted looks odd, especially between 5 and 15cm, when compared to the Pb-210 ages so I have low confidence in the magnitude of the change in SAR. It looks more like a factor of three to me, with the samples at ca. 1750-1850 having much higher SAR than is given in the paper SI.
NPG journal club: How has Earth’s climate changed in the past 2,000 years? #NPGjclub
http://blogs.nature.com/ofschemesandmemes/2013/05/02/npg-journal-club-how-has-earths-climate-changed-in-the-past-2000-years-npgjclub/?WT.mc_id=FBK_NPG&buffer_share=627e6&utm_source=buffer&utm_medium=twitter&utm_campaign=Buffer%253A%252BNatureBlogs%252Bon%252Btwitter
RSVP:
https://plus.google.com/u/0/events/c0k6d8eprmit6irlk4hsomq0r9s
Amac78
“It was, I believe, Geoff Sherrington who, in the comments of a RealClimate post, got Gavin Schmidt to grudgingly concede this outcome (alas, I lack a cite for that exchange).”
No, can’t recall this episode. Like Richard Muller, there are some authors whose papers I now refuse to read and that includes all of the RC funny folk.
Self-flagellation is for the stupid or disturbed.
more info on Gavin Schmidt’s attempts to salvage something from Mann (2008) here:
Steve: yes. that is a good contemporary summary of Gavin’s surprising admission. Only two months earlier, Schmidt and others (including Martin Vermeer) had been vociferously stating at several blogs (Keith Kloor, Arthur Smith) that the presence/absence of the Tiljander series didn’t affect anything. However, other than this inline admission, they’ve continued to use the no-dendro reconstruction as though there was nothing wrong with it and have failed to retract or correct the original publication.
Arthur Smith thought he would followup his destruction of Stephen Mosher’s claim about Mike’s Nature Trick in an IPCC report with an evaluation of Mann and upside-down Tiljander. He proceeded to give a four part definition of fraud, to which I added one more and he concurred. I concluded that Mann met all the points Arthur Smith provided, and he ended his thread saying he didn’t have time to evaluate things right now and would get back to it later. Since then, he has not posted any followups, but has posted numerous reviews of reviews of Mann’s book at Amazon.
MikeN
A number of people who comment here might doubt the bona fides of Arthur Smith – cf Amac and Brandon Schollenberger for 2. Smith is so partisan that he makes Mann seem unbiased.
Diogenes, I consider Arthur Smith to be blatantly dis …. I tolerated his rampant partisanship when I posted on his blog (though perhaps not as well as I should have), but a year later, he posted on a thread at Curry’s bllog discussing the topics we had discussed. He had the audacity to claim nobody would ever provide evidence when challenged to support their claims about Mann. Not only had I done so in detail in response to his challenges, he basically ran away from the discussion, claiming he would look into what I said.
So a year later he came to a thread I was participating in and told complete untruths. Accepting it could have been a problem of memory, I (emphatically) explained what had happened in our previous exchange. He dodged the issue then ran away when I pressed him.
It was blatant dis…. He made sweeping accusations he should have known were false, and when challenged, he decided to try to let them stand. There is no excuse for his behavior.
To be fair, before that all happened, I defended Arthur Smith when he criticized Mosher. I thought the criticism was apt. And when McIntyre got involved, I spoke up and said I thought he was wrong. It actually led to a bit of hostility in the comments here, and ultimately, McIntyre closed the thread to stop the “food fight” (perhaps the only time a thread was closed on this site).
I may think Smith is dis…. and untru…, but that doesn’t mean everything he says is wrong. My recommendation is to verify anything you see him say, and of you disagree with him, don’t bother trying to explain yourseld (to him) unless you have a lot of time and patience.
(And not that it matters, but there is no ‘c’ in my name.)
Steve: enough of this.
Fair enough. I knew my comment would land in moderation. I figured you could approve/disapprove as you wanted.
MikeN,
did you mean this Arthur Smith?
Posted May 2, 2013 at 10:29 AM | Permalink
There’s another Pollen.SUm series in the Kaufman JOPL 2012 collection http://www.ncdc.noaa.gov/paleo/pubs/jopl2012arctic/jopl2012arctic.html from Unit Lake, Manitoba ftp://ftp.ncdc.noaa.gov/pub/data/paleo/paleolimnology/northamerica/canada/mb/unit2012.xls. The pollen sum is in column BU of the 7th worksheet “Pollen”. Needless to say, it doesn’t have the Igaliku hockeystick. The preceding columns appear to be components of the Pollen Sum, but they don’t add up to the total. Explanations welcomed.
———–
Column BU is a count. Columns K-AR are percent, with columns K to AQ totalling to 100% (column AR). Columns AS to
Steve: hmmm… I think I see now. COlumn AR showed a pct count to 100%. I had presumed that the entries to the right would then be counts, but I see that they are percentages as well, with column BO mathcing column D. Thanks for this.
here is a plot of pollen sum at Unit Lake, Manitoba, one of the data sets published in the Kaufman 2012 JOPL issue. As previously noted, it lacks the huge HS blade of the contaminated Igaliku series.
RE: MikeN
Posted May 3, 2013 at 3:06 PM | Permalink | Reply
“”Arthur Smith thought he would followup his destruction of Stephen Mosher’s claim about Mike’s Nature Trick in an IPCC report with an evaluation of Mann and upside-down Tiljander.””
What destruction?
Who is Arthur Smith?
At a blog, Steve Mosher went a step too far in describing Mike’s Nature Trick and its use in IPCC reports. Arthur Smith has a blog called Not Spaghetti.
All I saw was that Steve Mosher made a small error with respect to Briffa and CORRECTED it, unlike the “Team”. I see no “destruction” by Arthur Smith. Critiques of Mann’s trick are valid. It is a self glorifying site I see no need to return to.
Hummm.. looking over this thread, it is clear that Nick Stokes is given every opportunity to comment, even when the blog owner (and most commenters) think he is mistaken on matters of fact. Too bad people who disagree with the local consensus are not given equal liberty to comment on blogs like “Real (more or less) Climate”, “Open (AKA closed) Mind”, and the like. Want to know who’s position is honest and intellectually defensible? Just ask if explicit dissent is allowed in comments.
David Kauffman indolently,
Better than malevolently,
Selected varves delicately.
Nick Stokes the fires of zealotry.
=============
It must be confusing for the climate modellers when they look at the thermometer temperatures of Greenland in the last hundred years and the result as given in this paper.
No wonder the models don’t work.
2 Trackbacks
[…] since there was so much else in McIntyre’s at that point two – and by now at least four – posts on the PAGES2k paper that Betts could have commented […]
[…] Read Steve’s entire essay here: More Kaufman Contamination […]