Judy Curry recently noted that Phil Jones’ 2014 temperature index (recently the subject of major adjustments in methodology) might be a couple of hundredths of degree higher than a few years ago and alerted her readers to potential environmental NGO triumphalism. Unsurprisingly, it has also been observed in response that the hiatus continues in full force for the satellite records, with 1998 remaining the warmest satellite year by a considerable margin.
Equally noteworthy however – and of greater interest to CA readers where there has been more focus on model-observation discrepancy – is that the overheating discrepancy between models and surface temperatures in 2014 was the fourth highest in “recorded” history and that the 5 largest warm discrepancies have occurred in the past 6 years. The cumulative discrepancy between models and observations is far beyond any previous precedent. This is true for both surface and satellite comparisons.
In the figure below, I’ve compared CMIP4.5 RCP4.5 models to updated surface observations (updating a graphic used here perviously), adding a lower panel showing the discrepancy between observations and CMIP5 RCP4.5 model mean.
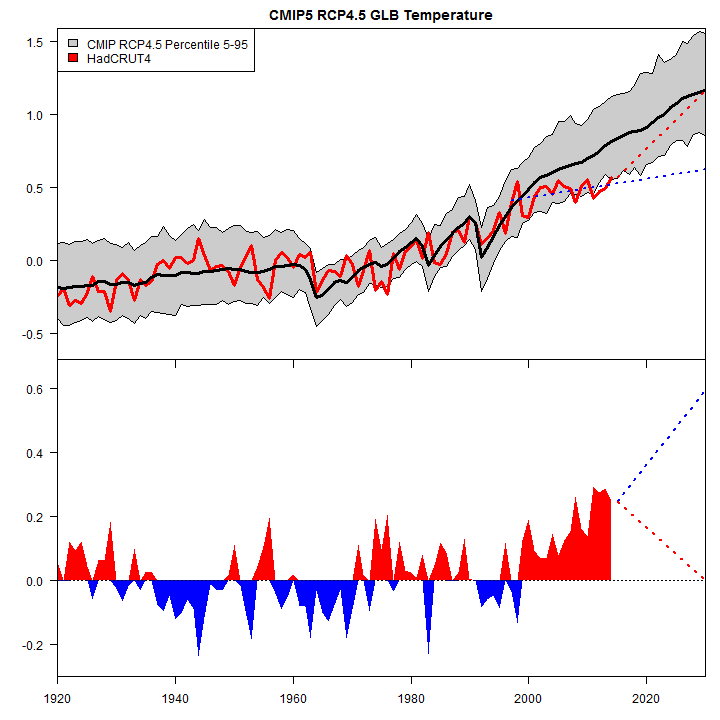
Figure 1. Top panel. CMIP RCP4.5 model mean (black) and 5-95% percentile envelope (grey) compared to HadCRUT4 (red). Dotted blue – the projection of the hiatus/slowdown (1997-2014) to 2030; dotted red – a projection in which observations catch up to CMIP5 RCP4.5 model mean by 2030. Bottom panel – discrepancy between CMIP5 RCP4.5 model mean and HadCRUT4 observations. All values basis 1961-1990.
During the hiatus/slowdown, HadCRU changed their methodology: the changes in methodology contribute more to the slight resulting trend in HadCRUT4 than the trend in common with the older methodology. But even stipulating the change in method, 2014 observed surface temperatures are somewhat up from 2013, but still only at the bottom edge of the confidence interval envelope for CMIP5 models. Because the CMIP5 model mean goes up relentlessly, the 2014 uptick in HadCRUT4 is far too little to catch up to the discrepancy, which remains at near-record levels. I’ve also shown two scenarios out to 2030. The dotted blue line continues the lower trend during the hiatus, while the dotted red line shows a catch-up to model mean by 2030. Reasonable people can disagree over which of the two scenarios is more likely. In either scenario, the cumulative discrepancy continues to build and reach unprecedented levels.
In the second graphic, I’ve done an identical plot for satellite temperature (RSS TLT), centering over 1979-1990 since satellite records did not start until 1979. The discrepancy between model TLT and observed TLT is increasingly dramatic.
 F IGURE 2. As above, but for TLT satellite records.
Reasonable people can disagree on why the satellite record differs from the surface record, but the discrepancy between models and observations ought not to be sloughed off because the 2014 value of Phil Jones’ temperature index is a couple of hundredths higher than a few years ago.
The “warmest year”, to its shame, neglected Toronto, which experienced a bitter winter and cool summer last year. For now, we can perhaps take some small comfort in the fact that human civilization has apparently continued to exist, perhaps even thrive, even in the face of the “warmest year”.
UPDATE Dec 12
Some readers wondered why I showed RSS, but not UAH. In past controversies, RSS has been preferred by people who dislike the analysis here, so I used it to be accommodating. Here is the same graphic using UAH.

Figure 3. As Figure 2, but with UAH.


387 Comments
Are global average temperatures differing by “a couple hundred degrees” really different?
Only if you need them to be different, so you can claim, in advance of the convention in Peru, that 2014 is the warmest year ever since the advent of instrumental measurement of temperatures. Which is all the more questionable because the data set has a margin of error of one tenth of a degree.
Uh, Bob … even a statistically (and graphically) challenged person such as I would have to acknowledge that your “a couple hundred degrees” difference in global average temperatures would be, well, alarming, to say the least! No doubt you intended to type (as Steve had actually had) “… a couple of hundredths …” 😉
And while I’m here … on the “unprecedented” front … I haven’t had a chance to verify or confirm this yet via word-count, but the view from here, so to speak, is that “unprecedented” (whatever it might have meant in advocacy-speak) is falling into dis-favour and being replaced by “transformative” whatevers along with “extreme” weather. IOW, perhaps “extreme” is in the process of being “transformed” into the new, improved “unprecedented”?!
To a jargon-watcher, such as I, it is an increasingly challenging task to make heads or tails of the word salads that continue to emanate from the engines known as the United Nations Environment Program (UNEP)’s and World Meteorological Organization (WMO)’s respective PR machines!
As for the omission of Toronto, which Steve had noted above – the veritable (but far from geographical) centre of the Canadian universe (according to some) … How could they possibly expect to retain any credibility, eh?!
Amazing. Simply amazing.
Reblogged this on JunkScience.com.
Saw that Gavin and co. have a new one: CMIP5 historical simulations (1850–2012) with GISS ModelE2
http://pubs.giss.nasa.gov/abs/mi08910y.html
Giss models temperatures from 1900 – 1940 now warmer than observed (figure 7).
I guess the next step will be tuning with volcanoes for that time period and for the last 20 years too.
Sorry but your up against the first rule of climate ‘science’
which is ‘when the models and reality differ in value , its reality which is in error ‘ so this difference has no affect to those who follow the ‘rules ‘ of climate ‘science’
But for hockey stick lovers, in figure 2, if you spliced the instrumental record on for the pre-satellite years and did some optimal smoothing, the lower pane would make a very robust hockey stick…
Ed Hawkins has done a provisional update of IPCC AR5 WG1 Figure 11.12, which uses the recent temperature record to constrain the model projections:
Thank you, Richard
Not scary
Richard – what does “constrain” mean in the context you are using it here. Is it a new modelling process or just some kind of arbitrary selection of particular runs?
It means fiddle the numbers to make the IPCC figures appear more realistic. After all, there is little point in ensuring that HadCRU 4 increases the trend if the IPCC models increases the trend further. The two will never meet.
Am I reading that graph correctly?
The MET 2014 projection had a spread of 0.35 deg and the 5-95% uncertainty spread for HadCRUT 4.3 is about 0.2 deg? By How much will the “record” be broken?
Confused also John 🙂
when was the MET 2014 projection/forecast made ?
can Richard, Ed or Steve clarify ?
“By how much will the record be broken”?
Well that depends not just on who you ask, but when you ask.
In a few years time it may be adjusted back down again in order to make a little bit of lebensraum for a new record.
Did Hawkins tweak the model or just reset the initialization parameters? Once your soapbox derby car has shown that it will veer off the track and into the weeds, I’m not sure that merely putting it back on the track and aiming it down hill is going to help you get to the finish line.
“constrain” seems like a euphemism?
It is an interesting exercise but doesn’t it imply a post hoc selection of only model runs which are not too far from observations? It doesn’t address the fact that so many model runs are not in the range of actual observations.
Richard, you say: “IPCC AR5 WG1 Figure 11.12, which uses the recent temperature record to constrain the model projections”.
However, my understanding is that this diagram is nothing more than a manual bodge. Is it your position that it is something other than a manual bodge?
It’s the basis for a new 2015 feature film — A Bodge Too Far.
I’ve seen prominent modelers explain that the parameter variations in their model allow for warming to be as low as 1C. Then they had these explicitly as input parameters to a model run, clouds, aerosols, and ocean sensitivity.
RealClimate’s post on the Keystone XL pipeline casually throws in use of a model ‘tuned to yield a 3C response.’
MikeN, in one of his responses to Steve McIntyre, Richard Betts notes that Ed Hawkins has done a provisional update of IPCC AR5 WG1 Figure 11.25, which uses the recent temperature record to constrain the model projections, and he has posted Hawkins’ revised version of the graph.
A comment has appeared over on Climate Etc. concerning that graph which makes an important point about the model scenario being used. It is from blog reader “PA” and appears under the Climate Etc. thread “Spinning the ‘warmest year’”
PA says, “Charts showing ‘All RCPs’ are an incorrect comparison. The emissions are above the RCP8.5 scenario so only the RCP8.5 scenario should be used.”
PA’s point here is that if RCP8.5 is used, the discrepancy between model predictions and recent observations becomes even larger than it is under RCP4.5.
Steve, well, it’s not based on new GCM runs if that’s what you mean by ‘manual’. But I certainly wouldn’t describe it as a ‘bodge’ – it’s improving the estimate in the light of new information. The CMIP5 GCMs were initialised in the 19th Century so by the time they get to the early 21st Century the natural internal variability in the models means that there is a spread of results for 2000-2010. As you know, nobody expects the internal variability in the models to match that in the observations on a year-by-year or decade-by-decade basis, because the internal variability is unpredictable that far ahead. However, in a decade in which the observations are at the extreme low end of the range from the models, it’s fair to say that the warmer end of projections for the next few decades is less likely if this relies on pathways which didn’t match the recent observations.
Dr. Betts, it might be reasonable to suggest that if the model were initialized using current information, the projections might be like ___. However, it’s not going to change Steve McIntyre’s point, which has to do with the failure of model validation. We now have a set of models that seem to have failed their first validation test. Now you want to restart them and try again, and wait ten or twenty more years to see if they are reliable? Why do that? If you need to validate new models, why not start with new models?
Richard says:
In the comparison shown here, I centered (“standardized”) the model runs and observations on 1961-1990 for the surface comparisons and 1979-1990 for satellite comparisons. So any buildup in variability prior to the reference periods is irrelevant. The divergence shown here is only the divergence since the reference periods so your invocation of the 19th century is not on point.
You say that “nobody expects the models to match that in the observations on a year-by-year or decade-by-decade basis”. I think that there is some expectation that models match observations on a decadal basis and that that expectation is a reasonable one.
In statistical work, one pays close attention to residuals. Some important tests are built on cumulative sums of residuals. One also pays close attention to out-of-sample performance – an issue that I’ve recently discussed in connection with proxies in the post on Sheep Mountain. The out-of-sample pattern of residuals is “unprecedented” compared to patterns of residuals in the fitted period. This is convincing evidence to me that one cannot simply invoke “internal variability” as a deus ex machina excuse. If you had similar patterns of residuals in the fitted period, I would accept this, but you don’t.
In other modeling programs e.g. if you were modeling performance of a copper smelter under operating conditions, if you had this sort of discrepancy, you would by now have re-tuned your model to lower sensitivity, rather than arguing about it. Indeed, if the whole issue were not so emotional, I suspect that the modeling community would have walked back their estimates of climate sensitivity already and that some of the apparent stubbornness comes from not wanting to give any “fodder to the skeptics”, to borrow Mann’s phrase.
Since you mention long-term performance, I draw your attention to my posts on Guy Callendar’s “model” (www.climateaudit.org/tag/callendar). When Callendar’s floruit is used as a reference period, Callendar’s model (using CMIP forcing) outperformed the GCMs.
Richard says:
I use “bodge” here in a sense familiar to CA readers from “Briffa’s bodge” and believe that the term applies exactly.
Ed Cook used the term to describe Briffa’s arbitrary adjustment of Tornetrask tree ring density (MXD) data to match observations. The observed values went down (the famous “decline”) whereas temperatures didn’t. So Briffa added the difference between trends since 1750 to the MXD values to remove the decline. Briffa would certainly have viewed himself as “improving the estimate in the light of new information”, but the manual and arbitrary adjustment remains a “bodge”, as recognized by Ed Cook. I see no relevant difference in technique in the IPCC adjustment and thus the term seems very apt to me.
For your reference, the Briffa bodge was a technique for “hiding the decline” in MXD data used prior to 1998 or so. Computer code for implementing various forms of the Briffa bodge attracted attention in Climategate due comments about “fudge factor”, “very artificial” etc. After 1999, the Briffa bodge fell out of use due to other techniques for hiding the decline: such as deleting post-1960 data as Mann did in the IPCC 2001 report or by replacing declining data with instrumental or infilled data, as in the WMO 1999 cover (discussed in the notorious email) or in Rutherford et al 2005 and Mann et al 2009.
I hope you are aware that knowing the lottery numbers a week ‘after ‘ the draw does not mean you can accurately predict the lottery or you have actual won anything .
From wiktionary;
From Urban Dictionary:
From Free Dictionary:
A friend of mine in the building trades used the term “farmitecture” to describe the same thing.
Richard, your sentence should have ended at the word ‘likely’. Are you arguing that the warm end of model runs is due to high GHG emission assumptions? As I understand it the RCP pathways all follow the same historical observations up to recent times and don’t diverge much as of the present, and if anything run below observed emissions. So the model high end for the past decade cannot be due to the spread of underlying GHG emission pathways, it is more likely due to different model sensitivities. Your sentence ought to have read:
So dropping the warmest models only lowers the range by .3C? Does this get bigger out to 2100?
Apart from the other comments I am curious about how one should update a group of model runs where internal variability can’t be predicted, but presumably long-term behavior can.
This suggest to me that the runs centered on the 1990s should give accurate multi-decade forecasts, for example they are consistently being used for 2050 – 2100 prognoses.
However we have had a period of inconsistent (but presumably only short-run) behavior. Under those circumstances any “constraining” of the models to the short-term variability record should show them back on track to the previous 2050+ target. If you see what I mean.
If instead we are saying that the short-term variability becomes a permanent feature of the future temperature record then the models cease to be much good for multi-decade forecasting (unpredictable short-term variation having a permanent impact on the further out forecasts).
I’d be also curious to know what the models do if the more recent period is used as part of their training. In practice one would have to suspect that they would show less dramatic 2100 temps – which would someone undermine the current view of their output.
Has this been done?
Ross,
No, I’m not arguing that the warm end is due to high GHG emissions. For the long-term trend, differences in climate sensitivity do of course (by definition) strongly influence the model spread, but for the short term (including periods of around a decade or two) internal variability can also make a large contribution.
Richard Betts write:
Dr. Betts
May I ask for a point of clarification? Is it your opinion that the current pause is simply a manifestation of internal variability in the climate and does not require an explanation beyond that or a change in the science modeled in the GCMs?
Steve, I disagree, the issue of variability is still important regardless of whether you’re looking relative to the 19th century start point or a baseline of 1961-1990. Firstly, the GCMs are not initialised with the observed climate state at that point (unlike seasonal or decadal forecast models) so are not necessarily going to start in the right point in natural cycles such as ENSO. Secondly, even if they were, the effects of this are lost after a few years anyway so comparing the models over a few years starting at some arbitrary point means that, again, the models may already be too warm or too cold just by chance by the time you start the period of comparison.
TAG
There’s been lots of studies on this in recent years, and it still seems that there’s a combination of internal variability and a cooling influence of external forcing in there short term (volcanos, the sun and aerosols). The relative importance of each is still not clear – IPCC AR5 suggested that they contributed about equally. In addition to this, the difference between observations and some models could be partly explained by some of the models being too responsive. There’s a good discussion on this in the IPCC AR5 WG1 Technical Summary – see box TS.3
Steve,
We’d only expect models to match observations on a decadal basis if the decadal variability is externally-forced (eg. due to major changes in aerosols for example). There is no way we can expect internal variability to be forecast decades in advance, that’s beyond the limits of predictability of a (semi)chaotic system.
It’s a bit like watching a ball bouncing down a rocky hillside. You can predict some aspects of it behaviour but not others. You can predict it will generally go downhill, and if you see a big rock in it’s path you can be reasonably confident that it will hit it and bounce off, but you can’t predict the size and direction of all the little bounces in between.
(Cue barrage of responses taking apart the analogy! Yes I’m sure this analogy is not perfect, but my point is, in a complex system like the atmosphere which has its own complex internal behaviour but is also subject to external influences, there are some aspects which have some level of predictability and others which do not).
Richard Betts @ Dec 12, 2014 at 6:15 PM
The problem is of course whether the average global temp rate of change is one of the properties that is able to be forecast using climate models in the long-term (and in particular they are sufficient robust to respond accurately to different forcings). The moment you say “it can” you are also able to make statements about future behavior of internal variability. It is constrained.
Richard,
You say: “nobody expects the internal variability in the models to match that in the observations on a year-by-year or decade-by-decade basis, because the internal variability is unpredictable that far ahead.”
You are aware, I hope, that polar bear scientists are using these climate models to predict a very specific response of polar bear population numbers into the future: they need to show at least a >30% decline in bear numbers within the next 30-36 years (3 generations).
This time/number constraint is demanded by the IUCN Red Book of Threatened Species – if polar bear projections cannot meet these criteria, they will not be considered “vulnerable” to extinction based on future threats due to global warming.
My question to you: Are the climate models (which drive the sea ice models) really going to be accurate enough over that 30-36 year interval (as required by polar bear biologists) to be valid?
In other words, is it possible for those models to be precise within the next 36 years?
Susan Crockford, PolarBearScience
Excellent question! I too would like to hear the answer.
From personal observation, I would hazard that about 80 to 90 percent of current climate science papers use these models as the basis for predicting catastrophic results for all sorts of scenarios. If there is no guarantee of the model prognostications, why should any of these papers even see the publication light of day?
Mr. Betts, I’m glad you’re here and commenting.
I would like your opinion on if the current plateau in temperatures is qualitatively different from the prior two in the temperature record. Vulcanism seems nearly the same. We don’t really know much about black soot or aerosols from the earlier periods.
Do you think each ‘pause’ (for lack of a better word) is sui generis or do they have significant features in common?
The bodge does not take into account that AR4 indicated that 0.2C was the highest amount of natural variable uncertainty, excluding volcanoes, that could occur by 2030. AR5, especially wrt this figure, ignore this with the stated approach. One or the other is wrong. If 0.2C is wrong such as it has to be too low, it invalidates the structure of the differencing method for assigning anthropogenic influence, resulting in the conclusion that the models are running high. Thus the bodge is incorrect and truly a “”To do a clumsy or inelegant job, usually as a temporary repair; patch up; repair, mend””.
Of course if the natural variable uncertainty is larger, the claims of usefulness of the models is more suspect. i.e., As Dr. Curry writes, it was inconceivable for AR5 to go up with the certainty.
Dr. Betts: Forgive me for being blunt, but the “estimates” being “improved”, were they put to any use when first published? Such as raising alarms by “projecting” the “estimates” out for decades, (which nobody expected to happen) and demanding governments act on the projections to suffer higher energy costs today to avoid the “projected” future? As you “improve” the models in light of new info, any chance you can pass that info to governments, which might just “improve” energy policies to reduce this unnecessary sacrifice?
I have read that there are multiple explanations for the current pause/hiatus and that there are numerous published papers describing many of these hypotheses. The question that springs to my mind is to what extent these explanations are found in the model runs. The updated diagram shown above has been described as not being created with new GCM runs. if the older runs used for the diagram do not contain models of the causes of the hiatus then what is the point of showing the diagram,.
So my real questions are:
a) If the current GCMS do not model the effect causing the current pause then what is the point of showing that they are in error compared to observations? That is a given since they are unable to model the hiatus. is the comparison given in this posting merely a rhetorical device emphasizing that inadequacy.
b) if the current GCMs are unable to model the hiatus then what is the point of trying to constrain them with current observations. Their predictions are incorrect since they do not include the hiatus-causing effects and so simply stating that they followed different pathways then the actual climate misses the point of their inadequacy completely.
Sorry, typo there, I mean Fig 11.25
I live near Toronto. Based on last years winter my ‘equal billing’ cost for heat increased 30% year over year. I’m hoping that the price of gas will in fact drop to offset another colder than normal fall. (When I closed my parents summer property in October, I blew a fuse for the water pump because it was frozen, other years I could pull the water out in my bathing suit)
What is the significance of the baseline period chosen and why is the rest of the data left unplotted?
Steve: 1961-90 is a longstanding baseline for HadCRU and leaves enough time to see whether divergence has occurred since 1990. There were no satellites in the 1930s, thus no satellite data. Satellite records start in 1979. I centered satellite data on 1979-1990 to be reasonably comparable to surface data using a simple calculation. I suppose that I could add in a small delta to estimate equivalent 1961-90 centering for satellites , but it won’t matter appreciably to the appearance of the result
Sorry Steve. I was referring to the graph reposted by Betts.
If you watch the original Al Gore video, you will note that the phrases ³we were amazed² and ³they were amazed² occurred more than a dozen times. The implication was that climate scientists were amazed that things were much worse than they predicted. Lately, the climate scientists seem amazed that things are much better than they predicted. Altogether, it leads one to conclude that climate scientists are continually amazed because their models aren¹t any good.
The Cowtan and Way data do not belong on these plots.
The plots should contain only measured data apart from the CMIPs.
Much of the general differences can be expained by use of estimated data instead of measured data, including that in the major surface temperature sets.
There is a need for a version using only measured, unadjusted temperatures.
One might infer that its current absence reflects suppression of awkward outcomes, like the distate for satellite data that some are now expressing.
Also, the confidence limits are a grand fiction that neglect, for example, that the mean global absolute temperatures of those main data sets are spread over a couple of degrees; and that bias as well as precision estimates would be stated in a quality statistical discourse.
Have we been bombarded by kindergarten stats and methods for so long that we have found a new norm for acceptance?
Geoff,
“There is a need for a version using only measured, unadjusted temperatures.
One might infer that its current absence reflects suppression of awkward outcomes”
No awkward outcome. I’ve been using a version based on GHCN unadjusted temperatures for about three years. It tracks NOAA, in particular, very well. And it shows no major deviation in historic measures.
Nick,
I am talking about errors.
You refer me to a home made model of temperatures, with an illustration a few months long, a picture bereft of error bars or confidence limits.
Even on your example, there are anomaly points spread over nearly a half a degree. Your final error must be greater than this spread unless you have robust reasons to reject some series.
A more meaningful test of CMIP might be in absolute temperatures, not anomalies, don’t you think?
“There is a need for a version using only measured, unadjusted temperatures.”
huh.
1. CRU is an ESTIMATE based on adjusted data.
2. GISS is an estimate based on adjusted data.
3. Every “unadjusted” pile of station data is a estimate.
4. every data point in every series of unadjusted station data is an estimate.
5. Every measurement of temperature is an estimate.
People keep trying to make false distinctions about the various series.
All you have are estimates. its estimates all the way down.
get over it.
Not all estimates are equal, Steven.
Mosher
You seem to be very fond of spreading strawman arguments by using over-simplistic reasoning of the meaning single words rather than descriptive phrases.
You frequently use the ubiquitous word ‘model’, with no qualification as if all ‘models’ are equally respectable whether bad or good, validated or unvalidated, to attempt to discredit the validated satellite data post-processing code by comparing it with absolutely crap GCM output.
You have often used the word ‘proven’ as in science is not proven so GCM’s should be used for policy if nothing else is available. In fact scientific facts can be compared with observations and that can constitute a very good proof. Models rely on observations, they do not replace them and models that do not agree with obs are just plain wrong. If then used for policy they will lead to wrong policy.
You now conflate the word ‘estimate’, knowing full well that thermometer estimates are calibrated and accurate and that other ‘estimates’ – such as ‘positive feedback’ or ‘climate sensitivity’, are not only discredited, they have zero foundation.
Most folk in this debate have learnt to qualify single words with a more full description in order to avoid misunderstanding but you seem to want to foment such misunderstanding. Is your strawman argumentation deliberate or accidental? If accidental then your English qualifications seem to be failing you as well as your basic logic.
snip – foodfight
equivocation, I believe, is the term of art.
OK, so less nice…
What an incredibly specious argument, Mosher. Of COURSE everything is an estimate. That is why everything, including an observation has an associated error. The difference is the level of abstraction, or rather, the distance from observation from which the estimate was derived. This distinction has huge implications that your hair-splitting/wordsmithing comments indicate you do not understand.
Mark
Jo Nova looks at Phil Jone’s warming periods and finds little impact from higher co2 levels compared to the earlier record. Here is her quote——
“More mysteries for “science minds” to explain: the world warmed just as fast in the 1870s as it did in the 1980s without all the CO2 (see the graph). Why are some people 95% certain that CO2 caused the latter, when they don’t know what caused the former? They also don’t know why the world started cooling 700 years ago, and started warming 300 years ago, long before our emissions increased”
The rate of warming from those different periods over the last 150 years look very similar.
Sorry here is that graph from Jo Nova’s quote above.
Taking this graph at face value, the warming periods are getting longer and the cooling periods shorter. This is what you’d expect if you had a ~60 year oscillation with a trend that is increasing in time.
Here is the best fit for a quadratic trend + a 60-year AMO to the HadCRUT4 data:
As you can see, this pattern of ” warming periods are getting longer and the cooling periods shorter” is replicated with that data too.
[Note I am not advocating that a 60-year AMO is a real feature of the data. I think there is not enough data and too little theoretical motivation currently to accept this seeming periodic structure in the data as unequivocally a real feature of climate.]
Err should have said “replicated with that model too”.
Carrick, except your fit is to speciously adjusted data.
Neville, I did something similar. I used the HADCRU4 global monthly data to compare the most recent 45 years (45*12 points) with the bast record, in a monthly step-wise manner.

The present period recaptures the past and is most like the time 63-67 years ago. This suggests that some cycle with a peridicity of about 65 years warms and cool our planet.
The difference between the past and present, where we see a high correlation is about 0.4 degrees, which gives a ECS of about 1 for 2x[CO2].
It’s not just Toronto. Brutal winter weather all over the Eastern US and cool summer weather for 2013/2014 also has not apparently been included. This past summer here in Eastern Virginia we barely broke 90 degrees with a highest temp of 96. Contrast with temperatures of thirty years ago when we regularly broke 100 degrees in July & August. And less humidity too these days. Must be global warming.
Winter 2011 was warmer than average due to the La Nina. One of the temperature clues we use is ice formation in the creek. None so far this year. Must be global warming again – or maybe the lack of a La Nina?
Hi Steve, I’m all in favor of presenting the model-data discrepancies, as you’ve presented in this post. I added them last month to my monthly surface temperature and TLT data updates at my website and at WUWT:

Post is here:
Happy holidays to you and yours, if I don’t stop back between then and now.
Steve: 🙂
Reblogged this on Centinel2012 and commented:
This is basic stuff that should be enough to discredit any theory!
Speaking of Toronto in 2014 (as reported “uncorrected” by EC for the Greater Toronto Airport):
January 2014 was the coldest since 2009
February 2014 was coldest since 2007
March 2014 was the coldest since 1984
April 2014 was the coldest since 2013
May 2014 was the coldest since 2009
June 2014 was the coldest since 2013
July 2014 was the coldest since 2009
August 2014 was the coldest since 2008
September 2014 was the coldest since 2013
October 2014 was the coldest since 2012
November 2014 was the coldest since 1996
2014 is trending towards being the coldest year at the GTA since 1996 (despite the massive development in and around the airport, and the increase in surface and air traffic since then).
Yes, and yesterday when our first snowstorm hit, Pearson had the predicted 17 cm of snow. Downtown, though, there was up to 24 cm in spots.
So its hard to understand sometimes how an airport, which isn’t even located in Toronto (its in another city called Mississauga), counts for “Toronto”…
Is there a discussion anywhere on the change in Phil Jones temperature index methodology ? And for the purposes of apples-to-apples comparison, is possible to see the results of the previous methodology with up to date data ?
Divergences are clear against the models but are there any growing divergences developing between the satellite records UAH/RSS and terrestrial measurements Hadcrut4/Gisstemp as time passes?
Please explain where the confidence interval comes from. I know how to calculate confidence intervals in regression, but I don’t know how the modelers come up with the one shown.
Calculating the mean and variance among the 100 or so models is plainly bogus, but it appears the plotted c.i. is done for only one model
“The cumulative discrepancy between models and observations is far beyond any previous precedent.”
To what is this referring?
“the overheating discrepancy between models and surface temperatures in 2014 was the fourth highest in “recorded” history and that the 5 largest warm discrepancies have occurred in the past 6 years. The cumulative discrepancy between models and observations is far beyond any previous precedent.”
Steve M at his best. 🙂
Steve, what year did CMIP5 RCP4.5 start to make true future projections?
Model discrepancy is more than just the differential between a single point outside of the CI. Models are an energy balance. Slight imbalance adds up in the system over time. The difference in imbalance between observations and models should be minimal. Therefore, when verifying the success of a model, it is critically important to compare model trends to observed trends when assessing the effects of CO2 energy imbalance on climate rather than absolute temperature anomaly differential. On that basis, they are performing worse than even these plots intimate.
Steve, Ed Hawkins told me earlier today that he’d submitted a couple of comments but they were stuck in moderation. They still seem to be stuck after several hours – can you check and release them please? Thanks!
Steve: there’s nothing stuck in moderation. I moderate after the fact usually.
So far, nothing from Hawkins.
Curious.
This post is weaker than most of the technical posts found here. What you’ve presented is apples to oranges.
First – comparing surface observations to models did you mask for coverage?
Second – there are two global datasets without low-biases (CW2014 and BERK) that should be included. The CW2014 dataset provides a series of different reconstructions using different inputs and methods to guide interpolation (on the website) which provide consistent answers. It has also been shown to be reasonable for the Arctic (e.g. Simmons and Poli, 2014; Dodd et al., 2014).
Third – Why pick only RSS for the TLT product? There are still substantial differences between the various TLT datasets so selecting one (the one with the lower recent temperatures as well) just seems to be cherry picking. Ironically enough there is of course this paper just out…
http://journals.ametsoc.org/doi/abs/10.1175/JCLI-D-13-00767.1
“Using our homogenized TMT dataset, the ratio of tropical tropospheric temperature trends relative to surface temperature trends is in accord with the ratio from GCMs. It is shown that bias corrections for diurnal drift based on a GCM produce tropical trends very similar to those from the observationally-based correction, with a trend differences smaller than 0.02 K decade-1. Differences among various TMT datasets are explored further. Large differences in tropical TMT trends between this work and the University of Alabama in Huntsville (UAH) are attributed to differences in the treatment of the NOAA-9 target factor and the diurnal cycle correction.”
Fourth – your model ensemble is not based on adjusted forcings from a new observationally-based dataset which show more volcanism than previously thought over the past decade. Simply accounting for coverage, updated forcings and the IPO pattern is enough to reconcile most of the discrepancy. This post attempts neither.
Some readers wondered why I showed RSS, but not UAH. In past controversies, RSS has been preferred by people who dislike the analysis here, so I used it to be accommodating. I only look at this data sporadically and haven’t been following recent RSS vs UAH differences, but, for the purposes of this post, did not expect them to matter and they dont.
Here is the same graphic using UAH.

Robert says:
For the satellite comparison, coverage shouldn’t be an issue.
I haven’t parsed the IPO pattern issue, but I am reluctant to accept such internal pattern variations as “explanations”. I know that some people are very enthusiastic about them, but they just seem like the sort of variability that are within the model rather than extrinsic to it.
It doesn’t seem to me that there was anything particularly “unusual” about forcing in the past 10 years, other than, perhaps, more CO2 emissions than one would have expected. I’ve parsed forcing datasets from time to time and they seem to be very disorganized. Also forcing estimates for (say) the 20th century seem to be developed with an eye on the temperature performance and not truly independent. Which dsets do you recommend?
The part about new volcanoes, the paper doesn’t establish that weren’t these unobserved additional small volcanic eruptions in the past, so quite unpersuasive to change things based on that.
Volcanism as an explanation for the discrepancy is far-fetched and this explanation will no doubt slide off the wall for lack is support. I find it as another climate science curiosity.
Robert, do you realize how much of a stock market “prognosticator” you sound. Trying to explain at the end of the day why the market moved up or down. If up then investors found bullish reasons on the economy, if down then it was profit taking or fear of OPEC or some such bogey man. It is accurate predictions on out of sample data that lead people to believe that the prognosticator has any understanding of what’s going on.
My understanding is that the dataset they used (AERONET) only starts at around the same time as the pause therefore whilst they can infer that there is more
volcanismSO2 than they thought they can not infer that it is unusually high or more than in the previous decades for which they have no data. This means that any increase in forcings due to higher levels of SO2 needs to be applied over the entire model run not just the last part.All the usual observational evidence of increased volcanic activity (earth tremors, eruptions, death and destruction etc) appear to be missing.
Some thoughts on Bodging, or as I like to call it “culling the herd”
One problem is that there are too many models. It’s a problem for a couple of reasons: First, it draws one into the notion that you can somehow combine all models into a model of models. That’s typically done by averaging all the models. Of course one can do this calculation, but it’s unclear what it means.For example, if you include a really bad model in your mix you can of course drag the mean in the wrong direction and more importantly bad models give you a wider envelope. It also tempts people into the silly notion that “models” are falsified when the mean of the models diverges from observations.
If it’s suspect to combine models into a model of models by averaging them, then its equally suspect to say “the models” are falsified when observations diverge from this model of models.
Models need to face observations on their own. Mano v Mano .And yes, the herd needs to be culled. Hawkins method of culling is one approach and it’s testable.
One could, for example, look at runs from 1850 to 1900, and cull the herd.
And then look at the performance of the wheat versus the chaff at 1940.
Does culling work? Dunno. But it appears to be testable.
The other approach to culling is setting standards prior to test.
For example: To be included in an assessment a model should be able to
1. Get the land/ocean contrast correct to with x%
2. Get arctic amplification correct to within x%
3. Get the absolute temperature correct within 1K ( for example)
4. Get cloud cover during X Period correct within x%
Note matching the historical time series is left out of these standards.
Also, these are just illustrations of an approach.
For a bunch of years folks have been talking about the democracy of models.
Thats code for “your model sucks, but we dont want to hurt your feelings so you get 1 vote in the ensemble”
Obviously arguing about what the standards are would be a bloodbath. I look at this like an engineer. There is no point for people to continue to put resources in 20, 30 or more models. The folks involved are too smart, the resources (wall time) are too valuable and the problem is potentially too important. It’s long past time to begin the process of culling the herd, moving some bodies, merging some efforts, sharing more code and stop forking around.
??? Bodging – as in the Briffa bodge – is entirely different from “culling the herd”. I think that it makes sense to discard some models, but that’s different from adjusting data after the fact to make it look more realistic.
I didnt see it as adjusting the data, maybe I need to read harder.
Steven Mosher, yes, I don’t understand why Steve thinks this is ‘adjusting data after the fact’ either.
To continue with my ‘ball bouncing down the slope’ analogy above, the CMIP5 models are like a bunch of people tried to predict where the ball will land when we let it go at the top. Some made predictions over to the left, some over to the right. The group of all predictions was quite wide. Then we let the ball go, and let it go half way down the hill. It starts heading towards the left, and eventually it becomes obvious than there’s no way it’s going to match the predictions over to the very right. Someone catches the ball, and we all make new predictions. There’s still a spread, but less so because we’re now closer to the bottom of the hill so less room for random effects to make a big difference.
So it’s not ‘adjusting data after the fact’, it’s just taking a reflective approach, learning from experience and refining things based on what we see happening.
Of course it still may all turn out wrong! There might be a hidden dip in the slope which turns the ball way back off to the right again, and in the climate system there might be something unexpected in the system that makes reality go outside the range of projections (either above or below). In fact I wouldn’t be at all surprised if there was, as we’re in a situation outside of past experience. Steve talks of things ‘looking more realistic’ – well we won’t know what really was realistic until it’s happened….!
Richard says:
Or maybe the CMIP5 models are like a bunch of stock go-karts going down a hill, with people trying to predict their times at various milestones. You won’t necessarily predict the times for each gokart, but if you know the properties of the gokarts and the properties of the hill, you should be able to estimate the times to reach various milestones. If your estimates are wrong, then you have to consider that the possibility that you’ve incorrectly estimated the properties of the gokarts.
Or if you have a copper smelting process and you try to predict the output under prescribed inputs. Yes, there’s randomness but only to a degree. If your results consistently come up 30% above or 30% below, then you have to re-examine the model. No sane process engineer would talk about bouncing balls.
Too many commenters are editorializing about models or otherwise complaining. Please don’t do that here. Blog policy discourages editorializing and complaining. The policy is unevenly enforced because of time constraints. I find that too much complaining makes threads unreadable. There are many other venues where such complaining is tolerated or even valued, so anyone wanting to register complaints have forums where they can do so. Please keep comments technical here.
I’ve snipped a few comments to show my concern over this issue, but will start zamboni-ing.
Richard Betts wrote, “To continue with my ‘ball bouncing down the slope’ analogy above, the CMIP5 models are like a bunch of people tried to predict where the ball will land when we let it go at the top.”
Pachinko.

GCMs are supposed to have predictive (out of sample) value. What evidence says that the GCMs have predictive value?
Richard,
My sense was that the ensemble members where selected by ed based on how well they went through the knot hole ( jeez another metaphor ) that is, the simulations are started in 1850 and we know that they wont get the wiggles right.. but at the end of the hindcast (present day) you basically set up a knot hole and those that make it through ( are constrained by observation) are those you use going forward.
I would think that its metaphorically like data assimilation.
Steven Mosher mentions data assimilation — a term new to me but important to this discussion.
Data assimilation is the process by which observations are incorporated into a computer model of a real system.
Wikipedia
Microsoft Academic Search
Steven Mosher
Thanks for the ‘knot hole’ analogy!
The method for constraining the projections is described by Stott et al (2014)‘The upper end of climate model temperature projections is inconsistent with past warming.
It’s also worth reading IPCC AR5 WG1 Chapter 11, section 11.3.6.3, which describes the original IPCC version of the figure that Ed provisionally updated in the tweet I linked above.
Richard Betts,
Except your “learning from experience” is NOT able to better forecast climate. It is only able to get a little closer to the temperature. In other words you are NOT learning anything new about the physics or processes making up the climate. You are only applying bandaids.
Bouncing balls and climate balls. What else can you expect?
Data assimilation is the primary failure of the GCM’s, which rely too much on theory and disregard observations which contradict theory. But in fact, it is not theory but hypothesis that is the fundamental construct of the GCM’s, i.e., climate sensitivity derivations.
david Palmer has talked about adding data assimilation to the models
I see Hawkins as doing a quick and dirty form of Palmers dream
This is interesting (Gavin and Sherwood, 2014)
Discusses lots of modelling philosophical issues.
Click to access Schmidt_Sherwood_1.pdf
“One problem is that there are too many models. It’s a problem for a couple of reasons: First, it draws one into the notion that you can somehow combine all models into a model of models.”
Um speak for yourself, Mosh. It doesn’t draw in engineers or scientists in any field other than climates science.
I just had a beer with a software engineer friend this evening. He was explaining that the company with the best optical character recognition (OCR) software on the market had licensed the top 5 OCR packages and then implemented a voting algorithm on top of them.
ya I had a couple of other examples, but you cant correct everyone.
But a voting algorithm is much better at ignoring the bad models than averaging is. Just using a median rather than average would be an improvement.
“Just using a median rather than average would be an improvement.”
While I agree with you in principle, there’s very little difference between the median of the CMIP5 runs and their mean. At least for the RCP6.0 runs.
Machine learning types can correct me on this but I was of the opinion that this is exactly what happened in that field in the 90s. The quest to develop an all purpose learning system was given up and instead systems were created in which multiple relatively simple learning technologies were combined. I was at an AIII meeting in the early 90s when a professor from MIT was explaining this in a keynote session. In the Q&A, she was confronted by an irate professor who claimed that this would never work and that she would lose all credibility if she continued with this idea. The current generation of autonomous cars relies on this sort of technology so I don’t think she lost credibility
Again, machine learning types may want to chime in and show where I am completely mistaken about this. however the idea of combining multiple models instead of attempting to create a perfect universal model appears to be a well established engineering technique now.
Sorry AAAI meeting not AIII meeting — too many conferences and too many acronyms
TAG,
I assume you are referring to ensemble models that appeared in the 90s, such as Adaboost, Random Forests, and Random Subspace methods more generally. They do combine multiple models, often by simple averaging, but by models we are talking in the Statistical sense, a fit to the data, and not an attempt to reproduce approximately a physical process. The averaging of statistical models has an understood effect in terms of bias/variance trade-off, and they do tend to outperform other machine learning techniques, though not always. The averaging of physically different process models, however, does not make much sense and is not used in autonomous vehicles, at least for the ones I am aware of or have worked on. They have a single physical model for how the vehicle behaves under internal (control signals) and external (environmental) forcings, which is tuned to the specific vehicle and validated using, well, out-of-sample data. I am sure there is someone somewhere who has thought of using multiple, physically quite different models and averaging them to predict robot motion, but that person is probably playing around in simulation and has never made a working robot. Given that much of research is simply a random walk in algorithm space, you may be able to find a citation for such a nutty project. Don’t confuse a statistical model with a model for a physical process. And particularly don’t confuse ensemble models with what they are doing averaging climate models.
There are other points of comparison between autonomous vehicle research and what climatologists do. For example, the former also engage in time series reconstruction using proxies: estimating the trajectory of a robot from noisy sensor data. Of course, to be taken seriously, one’s method does need to be validated on out-of-sample data. And the idea that one can validate a reconstruction with a tiny fraction of the data located exclusively at the tail end of the time series is just silly.
Mr Happold
As a real question, how do autonomous vehicles determine their surroundings in order to choose the appropriate current goal that they wish to accomplish. How do they learn that the vehicle ahead of them is stopping in and do this in varying weather conditions. I am bot thinking of how they directly control the vehicle but how they decide what the vehicle should do.
So as not to hijack this thread, you should check out the free papers on the Urban Challenge vehicles at http://www.journalfieldrobotics.org/Archive_2008.html
Bloodbath for sure!
Who would do the culling, the setting of the standards?
It would be an interesting process if one of the really ‘prestigious’ organizations was sent packing!
Still needs to be done.
Well I imagine one could start with a simple list of variables
that are tied to risks.
1. Sea Level.
2. Absolute temperature ( heat waves and crop failure)
3. Total precipitation.
And then add in some basic spatial characteristics
3. land ocean contrast
4. arctic amplification.
You could of course start with “lax” standards, and tighten them over time.
Then you add standards over time.
5. Matching variability etc
As various people are implying, a significant change in the size of the residuals when moving from the “training period” to the “verification period” is the classic give away sign of over fitting in the model.
They aren’t fitted models.
That’s right – no parameter estimation used at anywhere.
Nick is correct.
Saying a model is “fit” implies that the residual between a model and data have been minimized in some manner. That isn’t done.
Probably people mean “tuning climate models.” This is admittedly done:
http://onlinelibrary.wiley.com/doi/10.1029/2012MS000154/abstract
Mauritsen
Tuning the climate of a global model
Journal of Advances in Modeling Earth Systems, Vol 4 Issue 3 2012
[1] During a development stage global climate models have their properties adjusted or tuned in various ways to best match the known state of the Earth’s climate system. These desired properties are observables, such as the radiation balance at the top of the atmosphere, the global mean temperature, sea ice, clouds and wind fields. The tuning is typically performed by adjusting uncertain, or even non-observable, parameters related to processes not explicitly represented at the model grid resolution. The practice of climate model tuning has seen an increasing level of attention because key model properties, such as climate sensitivity, have been shown to depend on frequently used tuning parameters. Here we provide insights into how climate model tuning is practically done in the case of closing the radiation balance and adjusting the global mean temperature for the Max Planck Institute Earth System Model (MPI-ESM). We demonstrate that considerable ambiguity exists in the choice of parameters, and present and compare three alternatively tuned, yet plausible configurations of the climate model. The impacts of parameter tuning on climate sensitivity was less than anticipated.
Carrick, in looking at some dispute on “fit”, while I agree that a useful distinction can be drawn between what you call “tuning” and minimizing residuals, I think that some commenters used the term “fit” to include what you mean by “tuning” and that such usage is not necessarily “wrong”, though I believe that agreeing on definitions of terms is very important in avoiding merely semantic disputes.
It seems to me that Nick attributed a meaning to the term that was not necessarily in the comment being criticized and then proceeded to criticize a straw man – as he so often does. To the extent that he was right, I do not believe that the point was in dispute.
I linked to this below. Multiscale modelling like climate modelling typically involves parameter estimations and fitting between the scales. Tuning is related but different.
Carrick, that seems like a straw man you constructed. Define “fitted” a certain way and then say since the models do not so that they are not fitted. While they are fitted but perhaps not to a minimization of errors of traditional models. Fitted they are.
Steve: I thought that Carrick’s distinction between “tuned” and “fitted” was a good one and recognizes an actual difference. It’s more important to determine whether there is a substantive difference in understand as opposed to whether it is a difference in semantics.
Steve McIntyre:
I’ll point out that Jonathan does use the word “residuals” above, which does seem to suggest selection of parameters to minimize the difference between model and data temperature series.
That of course isn’t done with the global modeling.
I think the language of many climate science critics suggests some confusion on this point.
It’s probably worth raising the counter point to what Richard Betts commented on below about not fitting the full GCM to temperature series as being “simply be too difficult and too computationally expensive”. You can use simplified energy balance models to estimate the response of the full model to different parametric choices (e.g., which aerosol history to use), in order to keep your full GCM consistent with the historical temperature record.
Mauristen’s take is:
I should note I use a similar hierarchy of models in my own research and I suspect this is very common. Less accurate but computationally efficient models are used to solve the inverse problem and to “improve” the observationally based data sets for (e.g.,) atmospheric temperature and wind velocity fields. These “improved” models are then used in more exact but computationally expensive numerical models.
I’d suspect some of this happens with climate modeling too. “No we aren’t solving the inverse problem using a GCM. But yes we are running the GCM on what amounts to an inverse problem solution.”
Word correction:
These “improved” datasets are then used in more exact but computationally expensive numerical models.
Using an energy balance model to tune the aerosol history to fit the measured temperature record would be a similar methodology to what I described.
Fitting just means tuning by an established algorithm of some sort to achieve the lowest residuals. The tuning that is done is “manual” in that experience and judgment are used. That does precious little to lessen the arbitrariness of the tuning – a point that Lindzen has made for decades.
I should have perhaps added /sarc after my comment @Dec 12, 2014 at 6:07 PM
The point of course is that it doesn’t matter whether you are estimating parameters by minimizing residues derived from observations (fitting), or selecting parameter values to better model observations (tuning), the effect is the same.
The observations used become part of the information embedded in the model.
As Mauristen notes “… as parameterizations and grid configurations are usually selected based on their ability to improve the representation of some aspect of the climate system… Only seldom do we implement model changes that degrade the performance of a climate model; …”
We should therefore not be surprised that the models are surprisingly (and increasingly) skillful at reproducing temperatures over their base periods, but perhaps a little surprised that the ways they need to use to achieve that necessitates using inputs and subsystems that are quite different.
Now no harm in all that. However it does mean that the proof of the pudding is in the eating. If one wishes to use the model for out of sample inference the performance out of sample is what counts. That matters regardless of whether the observations come in via fitting or tuning (or both as in this case).
Tom C—still I think the word choice is important here. If critics of climate science insist on using “over-fitting”, they’ll find almost nobody in the climate community agreeing with them. If instead, they choose “tuning”, as you can see, you can find literature from within the field that discussing the ramifications of this.
HAS—good points as always. Over-tuning a common problem when you are looking at the data you are trying to replicate with a model. Because the data are observational in nature, some of the tools available to us in experimental sciences, like multiple replications is of course not available here.
It is to me a bit of a conundrum how you go about validating the models in this case. They don’t do a good job with natural variability and anyway, you’d have to start the models from an initial state (which I understand is not a solved problem for GCMs), if you wanted the variability in the model to have anything to do with the natural variability we actually observe.
It is also problematic IMO to go “fishing” for effects like volcanic aerosols to explain unaccounted for natural variability (if you missed it here, you’ve probably missed it before when the satellite instrumentation wasn’t good enough to detect it and that makes your seeming prior agreement with historical data is even more problematic).
Yup. I also tried to express this point earlier today. It’s impossible to understand how climate scientists could have nailed aerosols so exactly in the 1950s if forcing estimates in 2007 for the period 2000-2013 were so supposedly flawed.
Carrick –
If the choice of words – fit vs. tuning – is so crucial to understanding the problem then these guys don’t understand the concepts as well as they should. Either that or they re being willfully obtuse.
Carrick @Dec 13, 2014 at 2:51 PM
“It is to me a bit of a conundrum how you go about validating the models in this case.’
Now here’s the thing. Validation (aka the use to which you are going to put it) isn’t intrinsic in the model, it is an artifact of the meta-model. It is perhaps trivial to observe a model might be valid for one purpose, but not another, but regrettably when all you have is a hammer …. .
This leads into the debate (being had elsewhere on this thread) about if you are trying to do short-term forecasts of global temps what is the best model to use. It is also being used as an argument to defend GCMs against the criticism that they aren’t performing well in the short-run, but just wait til next century.
Anyway back to the point in hand.
You need to start with a purpose – in this case a desire to do inferences about global temps. Validation involves demonstrating the model’s ability to infer under the conditions that will be used for the forecast. I note that while I’ve been writing Beta Blocker has made a similar point.
Under normal circumstances the validation method and the criteria to be used are set in advance having regard to the purpose. The lowest level of validation is the ability to beat chance (or chance taking into account what we know about past behavior e.g. to beating a simple Callendar relationship). Higher standards are quite reasonable.
Unfortunately in this case we don’t typically see the validation method set in advance and explicitly applied as part of the presentation of the models and their various results. As Mauristen shows these matters are not addressed in advance and are more often than not buried.
The GCMs started life as mechanisms to forecast short-term weather and to understand systems relationships within the atmosphere. The validation techniques are different from a move to forecasting multi-decade performance of the “climate”.
If one adopts a formal view of the problem at hand then a model that isn’t part of a meta-theory that has an integrated prior validation system has limited value. The question is not just which GCM (or other model) one is going to use, but how the model validates against the stated criteria.
Even if the environmental circumstances are unique there are ways to handle this (and if there aren’t then any inference based on the modelling system becomes unreliable). Obvious examples involve using small subsets of the data to build the model, and then to test on the balance.
End of rave.
They haven’t nailed estimates of aerosols. Different models have their own estimates.
The suspicion is that they adjust this number to get better hindcasts. More aerosols allows for higher sensitivity. But of course we are told they have no way of knowing this in advance.
Steve: several years ago, Kiehl analysed the relationship between aerosol history in models and climate sensitivity and found that high-sensitivity models had less aerosol variability in their history and vice versa. A pretty convincing indication of tuning.
Jonathan,
GCMs are not ‘fitted’ to the observed temperature record – that would simply be too difficult and too computationally expensive. It takes several weeks to months to run a century-scale simulation so you just can’t make adjustments and re-do it. The parametrizations are optimised to improve the agreement with observations at the present-day state, but even then it’s a tricky job because there’s so many parameters and so many variables to compare against – global energy fluxes, rainfall climatology, SSTs, and so on. Things like climate sensitivity are an emergent property and for a new model version we don’t even know what the CS is until we’ve done long and expensive simulations with increasing GHGs. Once the model has been finalised you’re pretty much stuck with it for the next few years.
snip – please don’t editorialize. If you want to comment, fine, but no editorials.
Like I said, and several others here, GCMs are not fitted to the changes in climate over time, that is simply too difficult and expensive.
snip – editorializing
Green Sand, I don’t at all appeal to be above scrutiny. In fact I’m an advocate for openness. In IPCC AR5, I was one of those pushing for immediate release of chapters at the same time as the SPM (which never previously happened).
“snip – editorializing”
Yes Steve, quite right, mea culpa, should know better
Your statement is not correct. All GCMs are necessarily parametrized (tuned) to give acceptable hindcasts. In the formal publicly available CMIP5 protocols, hindcast submissions to the period roughly from 1975 to 2005. Now, how many fiddles it took before those submissions were made, nobody knows. But given the IPCC lead time, could have been several.
To claim no tuned parameterization is necessary when computationally infeasible grid scales absolutely require same…Dr. Betts, you need to up your game. Some of us are not as illiterate as you appear to presume. For details with references, see essays Models all the way Down, Humidity is still Wet, and Cloudy Clouds in ebook Blowing Smoke.
Surely you know about Hawkins fn2 mea culpa on his bodge posted on his website? (upthread). And one is entitled to presume an imminent scientist such as yourself knows about the multiple AR5 bodges to the original AR4 projection figures at the root of this issue about divergence between IPCC model projections and subsequent observations.
And it is fair to assume that as a devote defender of the faith, you are aware of the falsification stakes Ben Santer set out years ago. If not, read essay An Awkward Pause.
In my poor ignorant Midwest farmer vernacular, putting lipstick on a pig does not change the pig. But wastes lipstick.
I agree with Rud. I thought hindcasting to match the past was an integral part of model tuning. The “logic” being that models simulate the past so well that clearly the inputs and assumptions must be correct and hence accurately predict the future climate.
“I agree with Rud. I thought hindcasting to match the past was an integral part of model tuning. The “logic” being that models simulate the past so well that clearly the inputs and assumptions must be correct and hence accurately predict the future climate.”
Nope. different teams use different methodologies. we discussed this on Judith’s blog.
where is ruds evidence?
“Now, how many fiddles it took before those submissions were made, nobody knows. But given the IPCC lead time, could have been several.”
Nowhere. that;s where his evidence is
Mosher, do you claim that no hind casting is by “tuning”? This is news to me.
Mpainter
There are dozens of teams working on gcms.
List them.
List their approach to tuning.
Otherwise don’t speak in generalities.
Then let’s speak in specifics. Specifically, in what manner do you disagree with Dr.Roger Pielke (see his comment below), assuming that you do indeed disagree.
Jonathan,
as Richard says they are not “tuned” in the way that you are probably using the term. not only would it take too much time, but they would also match better if they were tuned.
also, different teams use different methods. so you need to be specific
There is a useful paper describing how one team go about it at http://www.mpimet.mpg.de/fileadmin/staff/klockedaniel/Mauritsen_tuning_6.pdf – I seem to recall it was discussed at Judith Curry’s.
HAS
Thanks for linking to that paper. Interesting to see what they say:
(lines 635-638)
and
(lines 654-656)
Thanks for backing up what I said!
No problem, although others might still like to read the paper to understand what gets done.
On the question bias they go on to note the obvious (line 669):
“That is not to say that climate models can be readily adapted to fit any dataset, but once aware of the data we will compare with model output and invariably make decisions in the model development on the basis of the results.”
This is of course why out of range verification is so important. (As they also note they were building on the back of earlier versions that had increasingly done well).
Thanks HAS, I was looking for that.
here is the remarkable thing.
As a group skeptics tend to be STICKLERS for details. getting dates right on proxies, siting issues with stations, which AR model to use etc ect.
But when it comes to models they tend to blow smoke and speak in gross generalities rather than specifics.
As if all models were the same, as if all teams used the same methodologies for “tuning”, as if we all meant the same thing by “tuning”.
I’ll shut up for a minute
@MikeN: In answer to your Q, this, from the opening post:
“…Equally noteworthy however – and of greater interest to CA readers where there has been more focus on model-observation discrepancy – is that the overheating discrepancy between models and surface temperatures in 2014 was the fourth highest in “recorded” history and that the 5 largest warm discrepancies have occurred in the past 6 years. The cumulative discrepancy between models and observations is far beyond any previous precedent. This is true for both surface and satellite comparisons. …”
Richard Betts, a question about your ball bouncing down the hill analogy:
What if the endless hill you assumed was there flattens out or doesn’t exist?
Political Junkie
Well obviously the ball doesn’t go downhill if there’s no hill! So what’s your point….?
He is pointing out a direct example from your analogy. In your analogy you say you are modeling a ball rolling downhill. This means you have a mathematical model of a hill. You model the behavior of a ball on that hill and note that there will be behavior too granular to predict, or too internal, or too chaotic, or some other TOO…reason.
Observations of the real ball you are modeling then show that the ball has stopped rolling down the hill. What about your model then?
That is Political Junkie’s question.
Many commenters here believe the ball has stopped rolling down the hill, and defenders of the models are raising the hill with hydraulics while keeping the ball in place so it looks like it’s still moving downhill. Then they say something like “So it’s not ‘adjusting data after the fact’, it’s just taking a reflective approach, learning from experience and refining things based on what we see happening.”
snip -editorialzing
snip- editorializing
Richard Betts,
Do modellers engage in
or do they simply keep stumbling on blindly, or do they proceed solely from absolute first principles, so that no judgement of any kind is needed or used?
Lets us consider what ‘success’ means when it comes to climate models.
snip -editorializing
Jonathan and Steve McI make very important points about model tuning here and they are really never adequately addressed. (although I understand that technical term confusion has probably caused most of the discussion to this point).
Steve has often provided good examples from economics of the consequences of data snooping, ex post method selection etc. Economics is a pretty good fit as well. I think there are lessons that can be learned from medical science here as well.
A tiny bias can have an enormous impact in your results, especially if your test has very few degrees of freedom. Mann’s RE is a good example of this, and unfortunately the comparison of model outcomes to global mean temperature falls into the same category.
Bias (and tuning bias is an example of this, as are post hoc adjustments of the type Richard is applying) is particularly difficult to remove from a study and climate science just doesn’t seem to meet standards from other fields.
A good example from medical science is the need for studies to be double-blinded. Surely single blinded should be enough? The patient reports symptoms, not the doctor, so why is single blinded tests not sufficient? The simple answer is that the doctor, even trying to be objective, rarely succeeds in a way that imparts zero bias. This effect is so strong, no modern medical study would be taken seriously if it were not double blinded.
Yet in climate modelling, the model development is completely unblinded. The modellers know full well what the global temperature history is “supposed” to look like. Coupled with the tiny numbers of degrees of freedom of hindcast, tests have no meaningful statistical power and no protection against subconscious bias on the part of model development.
If models cannot achieve degrees of freedom in other ways (e.g. smaller scale detail, either spatially or temporally) then out-of-sample data is the only way to go. But we have to wait the best part of 20-30 years to get one sample. And then we need adjustments to fit that (less than) one degree of freedom?
I’ll close now, before snark sets in, with a statement from Demetris, who speaks English as a second language but captures a wonderful turn of phrase: the models are irrelevant with reality.
Jonathan,
As you know, it’s not possible to model the global atmosphere entirely from first principles as many of the important processes operate at scales which are not resolvable with current computing power. Hence the need for parametrizations, which as I said above are indeed tuned to optimise the performance in comparison with the current climate state. (However, again as I said above, and backed up by the paper linked by HAS, the models are not tuned against past climate change.)
I’m not sure what the phrase “not tuned against any climate change” means in this context.
Weather observations are used to build the model and parameters are adjusted to ensure a realistic fit. To the extent that the set of weather observations (or subsets of them) in the periods used constitute a distinct climate the models are based on that climate/those climates, and if the climate changed during that period (however defined) the model will have been tuned against that.
But I don’t think that is what you are saying, and I don’t think that is what the models are designed to do. I suspect when the chips are down when these models are used for forecasting they are designed to forecast/project likely weather on a set of assumptions, and then by looking at those forecasts/projections making prognostications about whether the climate has changed.
HAS is getting warmer:
But I don’t think that is what you are saying, and I don’t think that is what the models are designed to do. I suspect when the chips are down when these models are used for forecasting they are designed to forecast/project likely weather on a set of assumptions, and then by looking at those forecasts/projections making prognostications about whether the climate has changed.
The models are used to set policy. . . validating models is science. Policy is consensus.
Mosher jumps in and complains:
As a group skeptics tend to be STICKLERS for details, getting dates right on proxies, siting issues with stations, which AR model to use etc.
But when it comes to models they tend to blow smoke and speak in gross generalities rather than specifics.
As if all models were the same, as if all teams used the same methodologies for “tuning”, as if we all meant the same thing by “tuning”.
Mosh, there’s no comparison there. Skeptics are STICKLERS for details, getting dates right on proxies, siting issues with stations, which AR model to use etc in an attempt to validate the results.
To point out that skeptics are unaware of the many teams, methodologies and different tunings being used for modeling only makes it clear the work can’t be validated. We’re talking about at least two decades of different teams applying different methodologies, tunings, etc without producing a model that can compare with observed data. After 20 years of modeling, you’ve come up empty handed.
And you’re making these skeptics unaware comments on Steve Mc blog . . . as if there’s no one here qualified to validate these models. You seem to be implying that only modelers can validate their own work. And that might be true because no one outside their charmed circle has a grasp on their methods, tuning and all the endless variables that may very well make the models impossible to validate.
If this weren’t govt funded it would have been shut down years ago. But as long as results are alarmist, the gravy train will keep flowing. It’s not about science, it’s about setting policy.
george
“HAS is getting warmer:
But I don’t think that is what you are saying, and I don’t think that is what the models are designed to do. I suspect when the chips are down when these models are used for forecasting they are designed to forecast/project likely weather on a set of assumptions, and then by looking at those forecasts/projections making prognostications about whether the climate has changed.
The models are used to set policy. . . validating models is science. Policy is consensus.
#########################################################################
1. the models were not designed nor specified to be used for policy. Nonetheless, people
can choose to use them to inform policy.
2. validating models is NOT A SCIENCE. It is a pragmatic excerise. The DOD directive 5000.61
spells it out more clearly than anything I know
“validation. The process of determining the degree to which a model or simulation and its
associated data are an accurate representation of the real world from the perspective of the
intended uses of the model. ”
there are half a dozen ways to validate a model. Some models only have FACE VALIDITY.
Face validity means experts judge them to be valid.
##########################
Mosher jumps in and complains:
As a group skeptics tend to be STICKLERS for details, getting dates right on proxies, siting issues with stations, which AR model to use etc.
But when it comes to models they tend to blow smoke and speak in gross generalities rather than specifics.
As if all models were the same, as if all teams used the same methodologies for “tuning”, as if we all meant the same thing by “tuning”.
Mosh, there’s no comparison there. Skeptics are STICKLERS for details, getting dates right on proxies, siting issues with stations, which AR model to use etc in an attempt to validate the results.
To point out that skeptics are unaware of the many teams, methodologies and different tunings being used for modeling only makes it clear the work can’t be validated. We’re talking about at least two decades of different teams applying different methodologies, tunings, etc without producing a model that can compare with observed data. After 20 years of modeling, you’ve come up empty handed.
####################
wrong. All the models can COMPARE with observed data. The issue is very simple.
Validation is the process of measuring how close a model is to the real world FROM THE PERSPECTIVE OF ITS
INTENDED USE. That is, judging the correctness of a model CANNOT be done in a vaccum. You have
to define a USE. Now,
1. who defines the USE.. the user
2. If the use is making policy, who is the user? the policy maker. NOT YOU, not me, not the
science team.
3. Can a policy maker decide that GCMS are “good enough” to make policy? yes.
The bottom line is that not a single one of you understands VALID FOR INTENDED USE.. A use can decide
that a model only needs to get the 100 year trend correct. Or that it should be within 50%
of reality. the end user decides. Not you. not me. not the science teams.
##################
And you’re making these skeptics unaware comments on Steve Mc blog . . . as if there’s no one here qualified to validate these models. You seem to be implying that only modelers can validate their own work. And that might be true because no one outside their charmed circle has a grasp on their methods, tuning and all the endless variables that may very well make the models impossible to validate.
If this weren’t govt funded it would have been shut down years ago. But as long as results are alarmist, the gravy train will keep flowing. It’s not about science, it’s about setting policy.
wrong Dan Hughes and I have been talking about IV & V for many years on this blog and other places
Skeptics dont get it. they fundamentally misunderstand the problem. they dont know the process.
they dont know the the first thing about it. They think that a simple comparison with observations
is the answer. It is not. The comparisons must be done WITHIN the perspective of the intended USE.
Again, none of you are users. If the use is informing policy then policy makers are the users.
THEY not you, decide how much accuracy is required. No model is perfectly accurate, that is WHY
accuracy is defined within the perspective of intended USE.
I’m a user, and I’m saying that the validation of the GCMSs isn’t good enough for me to rely on them for making decisions in this area. Also as I’ve noted I doubt that the information being given by the models is really a priority to improve right now. The priority is to sort out what’s going on on shorter time frames.
I should add that for the very reason that beauty lies in the eye of the beholder requires the (professional) modeller to be explicit about who the intended beholder is, what is meant to beautiful and how it is to be beholden.
Mosh, you’re disagreeing with yourself in the same post:
the models were not designed nor specified to be used for policy.
and then:
The comparisons must be done WITHIN the perspective of the intended USE. Again, none of you are users. If the use is informing policy then policy makers are the users. If the use is informing policy then policy makers are the users. THEY [blah blah] within the perspective of intended USE
You’re saying they weren’t designed or specified for their intended use. That seems kinda silly.
What’s with all the capslock btw – cruise control for cool?
Mosher, please. I hope real scientists are working somewhere to create a legitimate model, with the “intended use” of projecting future climate. It could be rudimentary, could even run a bit hot or cold, we’d understand if the team showed a spark of integrity. “Course, if it said some fairly benign warming of 1C by 2100, it would not get reported in my local AP newspaper, or any other US media outlet, and might even get attacked by some unreal scientists. You may have hit on something here, however-if the intended use of hockey stick models was to bring down big oil, it all fits-without fitting or tuning!
What a statement, Mosher. And what if the policy makers and users decide that they need an outside opinion? Who decides who or where they should seek this?
HAS has it right here IMO.
Mosher lost me in his reply, but it seems to all go back to USE 😦
If USE was only related to an academic field of interest to only themselves, then no problem.
but this USE is being rolled out in the public/policy realm, that changes the whole USE argument.
George – in the context of the real world impact of the semantics around fitting vs. tuning.
“It’s all fun and games until someone creates policies that send gas to $20/gallon.”
Mosher says: (re models)
And…
Surely here Mosher summarises the very problem many complain about re the current crop of GCMs?
That they are more instruments of policy than instruments of science?
I see two different issues in the observations discussed in the post:
1) What do the observations tell about the correctness of the GCMs and their skill in predicting future warming assuming that the emission scenario is correct?
2) What’s the best model based temperature projection, when the present understanding of models and recent observations are taken into account?
If the answer to (1) were that the models are proven to lack significant skill for temperature projection, then little can be said on (2) before better models have been developed. I think that the discrepancy is not yet that large. Thus the observation weaken the case for considering the models skillful, but do not prove that the models have skill. Thus it makes sense to figure out the answer for (2) based on the present models.
One way of doing that is that the set of available model runs is used searching for realizations that agree best with the recent history, i.e. realizations where the model variability has led to a hiatus. Then those model runs could be used for making the projection for the next few decades.
Another possibility is to study the autocorrelations in the model realizations and use the autocorrelations as basis for correcting the ensemble of the model results.
I have not tried to find out, what exactly has been done for AR5 or what Ed Hawkins has done. It could be something like my two alternatives or something else, which is not likely to be very dissimilar from those proposals.
Somewhat related discussion has gone on at SoD, where I wrote this comment. That comment is more about the principles than about telling, what my own judgment is.
Pekka,
“realizations where the model variability has led to a hiatus. Then those model runs could be used for making the projection for the next few decades.”
I don’t think that is at all a good idea. As Richard Betts says, normal GCM runs are not initialised to present state. In fact, they do rather the opposite; they start from a considerable time ago and run to present with known forcings. A reason for going back is that the starting state is inadequately known, even if recent; initial conditions have to be fully specified, and will probably have unphysical aspects. By winding back, they give time for this to dissipate, and for forcings to have their desired effect. So the idea is to start with right climate (from forcings) but randomised weather.
For this purpose, weather could be on a decadal scale. So you would be choosing models on the basis of predicting weather that you have deliberately sought to randomise.
Nick,
If we wish to have best projection for the next few decades, it makes sense to select realizations that are most likely to be in a state similar to the present one. It’s not possible to initialize the models to that state, because we do not know the present values of all the variables that are essential, but selecting from a set of realizations is possible.
Long term climate is not an initial value problem, but determining the climatic variables of the next few decades is, in part, an initial value problem for periods not long relative to the autocorrelations of the models.
When the models are not capable of predicting absolute temperatures, we have to decide, how to choose the zero point. When we are uncertain about the correctness of the climate sensitivity of the model, it’s better to fixed the temperature level based on rather recent past. That can be done better for realizations that have a recent trend not too different from that observed.
Pekka, in a post last year, I calculated “skill scores” for CMIP5 GCMs relative to the simple loagrithmic relationship of Callendar (1938) using 1921-1940 as a reference period and inputting RCP4.5 forcing into the Callendar formula. For “skill score”, I used the RE statistic of proxy reconstructions (which, in turn, had been previously used in econometric models under a different name e.g. Theil). None of the GCMs outperformed the simple Callendar relationship and most did much worse.
Figure 2. Skill Scores of CMIP5 RCP4.5 models relative to Callendar 1938.
While I presented the information in an ironic fashion, there’s a pretty fundamental point: why aren’t the GCMs outperforming a simple Callendar relationship?
Steve,
Your observation is related to the first point, and what I wrote in my first comment: the observation weaken the case for considering the models skillful. It’s clear that what has taken place deviates from all or most models in the same direction. The models have not made correct predictions for the temperatures of recent years, but that’s only one case, and the models are supposed to represent the same theory. Therefore this is only a weakening of the case, not a proof of lacking skill on the level the models are supposed to have best skill, i.e. in projecting trend over a longer periods of several decades.
Pekka,
one of the points that Mosher and I have discussed over the years is that, for whatever reason, the modeling community has failed to fully canvass low-sensitivity models (of say Lindzen sensitivity). it seems to me (based on, for example, the Mauritsen article cited by Carrick and others) that there are enough tuning parameters available to GCM designers that it ought to be possible to construct models at least somewhat below the lower boundary of present IPCC models that would preserve the characteristics of GCMs that appeal to the modeling community. Mosher’s phrase is that they’ve failed to “map the parameter space”.
IPCC AR5 somewhat conceded this lack of organization and failure to map the parameter space by observing (as I recall) that available GCM runs were, so to speak, data from opportunity (sort of like, and this is my comparison, SST measurements in the early 20th century.)
This failure permits the flourishing of controversies and speculations, many of which might have been reduced, with a more organized and more thorough investigation by the modeling community.
One can have an interesting discussion as to why this has happened, but I think that it’s correct to say that low sensitivity models remain largely terra incognita. Precisely how far one can “remain in ore” (if that analogy is informative to you) is an open question. Could one construct a climate model along the lines of present GCMs but with a sensitivity of 1.5 or 1.2? Seems entirely possible to me. While IPCC and supporters point to the “success” of higher-sensitivity GCMs as support for higher sensitivity, this success is not so overwhelming as to preclude models with Lindzen sensitivity.
It’s dead, Richard. Pekka, it was doomed, an overly sensitive critter.
===========
I’ve worked with more simplified models, and certainly 1C was possible there. The parameter space is part of the issue. I suspect that certain variable are being taken out of the ‘input option’ category and being built deeper into the structure of the model. If cloud activity is modeled as a positive feedback, when negative feedback is possible, then you have blocked off a large part of the parameter space.
One group at MIT claimed to do such a parameter space exploration, and the result was this
http://www.popsci.com/sites/popsci.com/files/styles/medium_1x_/public/import/2013/images/2009/05/prinn-roulette-4.jpg?itok=ItBKquBU
I wonder what’s on the flip side of that disc.
==========
Steve,
Reading my comment at SoD that I linked in the first message, you should find out that my basic attitude is not very different from what you write. The active modelers have not discussed the weaknesses and strengths of their work as much in open as I would have liked. We can find articles, where the limitations of the modelling work have been discussed on general level, but what that tells quantitatively about the “size of the ore” or what they think an their ability of figuring out that size remains too secretive to my taste. What’s written in IPCC reports does not tell as much as open discussion, where could see both on what the scientists agree and on what they disagree would be welcome.
One argument is that it is very difficult to get models to have a low climate sensitivity and otherwise agree with observations as well the present models do, but I really cannot tell, how strong that argument is or where the lower limit is.
Steve: I should have recalled that Finns would understand “ore” body images.
Since the lowest sensitivity IPCC models are not only “in ore”, but outperforming higher sensitivity models, the argument seems very weak.
Hans von Storch once gave the following purported justification for the failure of the modeling community to explore low sensitivity models. He said that he was convinced by existing models and that the onus was on “skeptics” to do this. I think that this was a ludicrous suggestion from a usually sensible observer. It’s entirely possible and reasonable to have caveats about the lack of exploration of low sensitivity areas without having either the time, interest, resources to spend years doing what a very large community is already employed to do.
On this point, I think that there’s a difference between the requirements of policy-makers and the self-directed interests of the academic community. Policy-makers arguably require more of an engineering approach – i.e. where the science is assumed, but where there is patient exploration of the parameter space, even if some of the variations don’t necessarily make “sense”. Long ago, Pielke Jr very acutely criticized the “out-sourcing” of policy work by policy-makers to academics and universities and the above failure is surely in part due to this.
Having spent thirty-five years as an engineer designing and building various odd contraptions of substantial physical size, and also designing and building the structures needed to house those contraptions, I have a stack of technical books on my shelf which, as a total body of related knowledge, tell me how to go about doing that for any particular combination of contraption plus enclosing structure that I might want to think about.
Does a similar body of knowledge exist for how best to go about designing and constructing a General Circulation Model (GCM) according to some previously well-defined set of functional design criteria?
Steve
re: setting up GCMs to explore low sensitivity. I can understand your point here, but it’s actually quite hard to deliberately influence emergent properties such as climate sensitivity in a particular way. There have been a few studies which aimed to explore uncertainties more systematically than the ‘ensemble of opportunity’ that happens in the CMIP / IPCC process – I’m thinking of the perturbed parameter ensembles of the Met Office Hadley Centre ‘QUMP’ ensemble (which feed into UKCP09) and ClimatePrediction.Net . These both produced quite a wide range of sensitivities, emerging from the ranges of values for the perturbed parameters, but as far as I’m aware my colleagues did not specifically set out to create parameter sets which gave specific climate sensitivities (either low or high).
Richard, it bothers me that the climate scientists aren’t even prepared to test alternatives. Running experiments designed to prove other alternatives are not better is pretty much a fundamental precept of modern science. It makes it look an awful lot like they are avoiding an inconvenient result.
Many sceptics allege that the real issue is not the greenhouse effect directly, but the amplifying effect of water vapour. I presume that water feedback effect is directly placed in the model. Turn it down, and what happens? Climate sensitivity would fall, obviously, but would we get a better fit to observations as well?
Richard
You say that “There have been a few studies which aimed to explore uncertainties more systematically than the ‘ensemble of opportunity’ that happens in the CMIP / IPCC process – I’m thinking of the perturbed parameter ensembles of the Met Office Hadley Centre ‘QUMP’ ensemble (which feed into UKCP09) and ClimatePrediction.Net . These both produced quite a wide range of sensitivities.”
I don’t think either of these PPE studies – both based on the Met Office HadCM3 model – produced model variants with climate sensitivities much if anything below 2 C. UKCP09 used an emulator to extrapolate the QUMP ensemble to a sensitivity of 1 C. But this doesn’t help. HadCM3 has a very strong correlation between climate sensitivity and aerosil forcing – even at a 2 C sensitivity aerosol forcing is so strongly negative that historical warming is unrealistically low. This relationship appears to be structural – altering the many key atmospheric parameters selected in QUMP, and aerosol module parameters, does not enable a low sensitivity, only modestly negative aerosol forcing, variant – which would be most consistent with the historical temperature record – to be selected.
More generally, it is apparently difficult to produce a GCM with a sensitivity of less than 2 C, I think primiarily because of strong tropical water vapour feedback and a shortage of processes that produce negative cloud feedbacks.
Nick Stokes @Dec 13, 2014 at 6:23 AM
“… the idea is to start with right climate … but randomised weather.”
It seems to me that if indeed this is so the short-term forecast problem is little different from the multi-decadal one. We have the climate (and the way in which it evolves) and we have random weather to add in to give the range of forecasts, whether for next year or 2100.
I actually suspect the real problem is that the division between weather and climate ain’t that simple.
HAS,
“I actually suspect the real problem is that the division between weather and climate ain’t that simple.”
It’s not. But there is one distinction that matters. Weather goes away – climate doesn’t.
Lost in these discussions is that GCMs are intended as climate models, and should be assessed on how well they do with that. But testing that is difficult. Scientists rely mainly on getting the physics right. It seems to me that folks here want to instead assess them as weather predictors, because that is an aspect that can be tested. Like the chap looking for his keys under the lamp.
That’s why I think selecting models that do best with the pause is a bad idea. It’s testing conformance with weather. If the weather (pause) is unusual for the climate, you’ll end up with an eccentric collection of climate models.
Nick as too often is unresponsive to the original point.
Nick asserts but provides no support for his assertion that the recent discrepancy between models and observations is unprecedented in “recorded” history is “weather” while statements that 2014 temperature is high within the instrumental record is “climate”.
Replay to Nick Stokes
“Weather goes away – climate doesn’t”
Good to know the little ice age and medieval warm periods are both still with us.
“If the weather (pause)”
Also good to know that the pause, which is 17 years according to RSS, is a 17 year weather pattern.
It’s also interesting to compare that statement with Santer at al’s paper published in 2011 which declared “Our results show that temperature records of at least 17 years in length are required for identifying human effects on global-mean tropospheric temperature.”
scf,
“Also good to know that the pause, which is 17 years according to RSS, is a 17 year weather pattern.”
What Santer actually said was:
“Because of the pronounced effect of interannual noise on decadal trends, a multi-model ensemble of anthropogenically-forced simulations displays many 10-year periods with little warming. A single decade of observational TLT data is therefore inadequate for identifying a slowly evolving anthropogenic warming signal. Our results show that temperature records of at least 17 years in length are required for identifying human effects on global-mean tropospheric temperature.”
“at least”. He’s not saying that having one record, in great contrast to the others, holding on to a pause for just 17 years is a test for anything.
HAS,
“I made the point elsewhere that applied models have no utility unless they include the basis on which they are to be verified”
The fact is that climate change is obscured by weather, and verification will take a long time. That doesn’t mean that you should test weather forecasting instead.
Since it seems we’ve agreed we can’t a priori separate weather from climate and we have but one earth, in the end all you have to test is weather – which was my point in saying there are problems for verification of climate models because of the difficulty in separating the two. There isn’t a discontinuity in the time scales that can be used, you are reduced to using arbitrary divisions.
I’m quite happy to verify climate models against any criteria the modellers want to provide as part of their model, but if we don’t have the data to do the verification until (say) 2030, then up until then they should come with a health warning. I also suspect any verification will draw attention to the narrow domain over which the model is designed to be valid.
Having said that I do think there are likely tests that could be applied to GCMs to validate them in some limited shape or form right now. The trouble is I don’t think you can do it with them as currently constructed.
The attorney presenting the defense for The Cause utters the stunning revelation that Santer actually said “at least” 17 years. Which, according to the mouthpiece for The Cause, means that just one pause of just 17 years means squat. Meanwhile, in the real world: The Pause is killing The Cause.
Richard Betts points out:
“We’d only expect models to match observations on a decadal basis if the decadal variability is externally-forced (eg. due to major changes in aerosols for example). There is no way we can expect internal variability to be forecast decades in advance, that’s beyond the limits of predictability of a (semi)chaotic system.”
Let me reflect that back so I’m sure we’re not misunderstanding each other.
IF there is an anthropogenic (external to nature) “force” affecting climate, AND IF the computer-based general climate models GCMs correctly mimic that force, THEN the GCM forecasts are expected to match the actual climate as measured. Is that right?
If so, then what follows IF (as it seems, and stipulating for the moment as a given truth that) the climate as measured routinely diverges from the forecasts as modeled by GCMs?
Would you, Mr Betts, agree with Mr McIntyre that the Callendar model matches expectations more closely than GCMs?
Is it the case that (A) The expectations for GCMs were incorrect, even if models correctly describe the forces that exist? (That is, researchers may have developed GCMs for other purposes, not including or at least not primarily intended as forecasting?) (B) The expectation of forecasting is correct but the models are incorrectly mimicking the response to the correctly described external force? (GCM programming is inadequate to this purpose, without regard to how well it fulfills other requirements?) (C) The assumptions regarding or measurements describing the external and anthropogenic force is incorrect? (We have bad — incomplete, mis-measured, misunderstood, miscalculated — forcing data?) (D) Some combination or error involving the assumed force, the mimicking model, or the expectations? (The whole field is screwed!?)
How can a researcher distinguish among a bad assumption, a bad model, and a simple unrealistic expectation about the power of modeling (for use in, say, political policy making, financial risk planning, or electrical grid management)?
Steve, isn’t ‘Lindzen sensitivity’ much lower than 1.5 K or even 1.2K? If I am not mistaken his assessment is that sensitivity is likely about 0.5 K or so…
Pouncer,
“THEN the GCM forecasts are expected to match the actual climate as measured. Is that right?”,/i>
That’s not how I read it. He’s just saying what models can be expected to respond to. They can’t predict natural variation – it seems generally conceded that chaos prevents that. But they should respond commensurately to forced change. Whether that response can be distinguished from the overlay of natural variation is another question, to which the answer generally is, it takes time.
Nick Stokes writes:
Scientific theories are not true or false but useful or not useful. So the question naturally arises in this discussion as to what utility do GCMs have? if they cannot distinguish between natural and forced variation then of what use are they for policy decisions? If the answer is that “it takes time” then how long will it take before it can be determined that GCM outputs are not usefully describing the parameters of teh real climate.
Richard, your ball bouncing down the slope analogy assumes that the ball inevitably and inexorably reaches the bottom of the hill without any noticeable bounces up.
What would you say is the corresponding analogue in GCM terms?
In Richard Betts’s analogy, I think “downhill” is merely the direction of time, which is inexorably forward. Let’s say the hill slopes down in the eastward direction. Looking at the path from overhead, a bounce to the path’s left (North) is a warmer temperature excursion, while a bounce to the right (South) is cooling.
Occasionally a rock in the path will deflect the ball a little north [El Nino] or south [La Nina]. But if there’s a prevailing wind blowing from South to North [greenhouse gas forcing], one expects the path to show a northerly bias [warming tendency].
If I can stretch the analogy (probably to its breaking point), the effect of wind on a ball has been established by experiments with a ball rolling on a smooth concrete pavement. [This would correspond to the well-known radiative properties of CO2 and other GHGs.] It is then applied to the ball rolling down the hill. But the terrain of the hill, the grass and other vegetation, also affect the ball’s path; there’s more than just random deviations going on. The problem is that we have no firm knowledge of those other effects. Many bright folks make their best guesses [GCMs], but they don’t all agree, and the average of their best guesses may or may not be right. The actual path of the ball [observed temperature] hasn’t followed the average prediction. Does this mean that the terrain just covered is tipped slightly south [Long-term (systematic) variability, e.g. AMO/PDO]? The ball may have just hit a patch of pebbles causing southward bounces [random short-term variability]. Perhaps the prevailing wind has lessened a bit [increased volcanic forcing]. Or it may be that the resistance of the ball+terrain+vegetation to the wind is more than imagined [reduced sensitivity].
HaroldW,
Consider for a moment that the surface topography of the hill in your analogy is being generated by a Mandelbrot set generator, which I think may be the case. What do you think that does for the chances of success in predicting climate?
HaroldW,
Thanks for this. Actually I had in mind gravity being the radiative forcing (i.e.: influence of increasing GHGs), my point being that the models can (broadly) predict the response this forcing (ball going downhill) but not the (smaller) randomness along the way. So similar to your version I guess, but with gravity instead of wind.
Steve McIntyre Posted Dec 13, 2014 at 10:28 AM
“While I presented the information in an ironic fashion, there’s a pretty fundamental point: why aren’t the GCMs outperforming a simple Callendar relationship?”
From my own experience with multivariate regression models (in econometric settings) I think the answer is that the additional independent variables bring with them a lot of currently unexplainable variance (noise), and they probably dont explain all that much more variance than calendar’s single variable model does.
complexity isn’t a good thing, in and of itself…
sorry if you find this banal.
Steve: not at all. that would be my guess as well. But my point is really addressed at more fervent supporters of GCMs than you.
you are a very kind “blog runner”, as it were.
Both Richard Betts and Robert Way observed (in line with a number of recent academic articles) that underestimates of actual forcing in recent years, rather than incorrect model sensitivity, could be contributing to the divergence. This is a fair enough comment and I don’t know how one could prove it one way or another right now.
However, if this is the case, surely it opens up even more questions.
The pattern of residuals during the hiatus is “unprecedented” in the model. That’s simply a fact. Reasonable people can disagree on the explanation, but it remains so.
If, as Betts and Way propose, this pattern is due (at least in considerable part) to incorrect estimates of non-CO2 forcings during the period 2000-2014, it implies that our estimates of non-CO2 forcings in this period were worse than our knowledge of non-CO2 forcings in (say) 1950-1960. This is far from obvious.
Particularly for (say) the 2000-2007 period which was in hand at the time that CMIP5 runs were being specified. Is it really true that our knowledge in 2008 of non-CO2 forcing in 2000-2007 was less accurate than our knowledge of 1950-1957? If so, it would be nice to see a more detailed explanation.
Agreed. Here is the paper on volcanic forcing, allegedly responsible for up to .12C of cooling.
http://onlinelibrary.wiley.com/doi/10.1002/2014GL061541/abstract?campaign=wlytk-41855.5282060185
Steve,
I don’t really have any major disagreement with that comment. I think that there are certainly gaps in our understanding of the historical evolution of natural and anthropogenic forcings through time. The anthropogenic aerosol component being a key forcing with large error bounds on the estimate.
I think that there is certainly reason to further re-evaluate whether volcanism has had more of an impact throughout the last century then previously thought based on the study mentioned above. Direct attribution of course relies on the forcings therefore it is a priority to provide the best available bounds on external contributors through time.
The point I was trying to make is that using the best available climate forcing and updating for coverage of observational datasets would make the instrumental record within the CIs on the graph above.
I still think that there’s a fairly reasonable chance that the multi-model mean wouldn’t match the observations because I do think that natural variability has played a role in the differences between models and observations over the past decade. Model initialization studies using prescribed SSTs seem to support this interpretation.
Robert, won’t correcting the forcings for the models due to persistent understated vulcanim put them out of whack in the early periods, in an attempt to line them up in the present? How will that help?
Is, in fact, trying to get the present data “within the CIs” a useful goal? To me it seems to miss the wood for the trees.
The problem is not though that the models are presently too “hot” for the observations, but that they are consistently running too hot and so are increasingly out of line. Steve’s “unprecedented” discrepancy is getting only bigger. Any step change looks like a bodge to make the models look good on a graph vs observations.
If you believe that the recent slow down is due to “natural variability” only, and the models are basically correct, then temporary fixes are out of bounds. Natural variability will swing back soon to cancel out the slow current period. That’s what variability is. It is only if you don’t actually believe that natural variability explains the difference that short term corrections are needed.
If corrections are needed to the models, obviously then they should be made. However pretending that they are only correcting for “natural variability” seems to me to be a way of saving face without admitting that the models are trending too hot by some margin. Getting back within the 95% bounds will only save them if observed temperature starts to increase faster than the models sometime soon.
The whole point of having a confidence interval is to account for the possible discrepancies in the anticipated versus the actual forcings you describe, as well as any other uncertainties at the time that the model runs were done. By stating that you need to update some of the data to move within the confidence interval, that eliminates the point of having a confidence interval at all. The whole point of having a confidence interval is to account for the possible variations in volcanic activity, other forcings and other uncertainties.
Looking at it another way, by admitting that you need to update the data to move within the existing confidence interval, that would mean that the confidence interval, which should have already accounted for that range of data, you are stating that it should have been wider, which means the models are even less predictive than already thought.
It might also run the risk of placing the the lower confidence interval below the 0.2C per decade line. And that might give fodder to skeptics.
why you you place any significance on the multi model mean is beyond me…it is simply indefensible to use a multi model mean, as if the models outputs were independent from one another…I can understand averaging multiple runs of the same model, but averaging a bunch of failed, no, I mean not yet validated models, in the hopes that somehow all of the shortcomings and inaccuracies of the assorted stabs at successfully emulating climate would cancel each other out is a questionable enterprise.
To clarify the dramatis personae, are you this Robert Way?
http://artsites.uottawa.ca/robert-way/en/background/
TIA, Pete Tillman
Professional geologist, amateur climatologist
It is worth pointing out I think how weak the single output quantity being used here is, namely global temperature anomaly, which is an integrated quantity. Such quantities can be derived from much simpler models with far fewer parameters. One would expect GCM’s to be skillful for many of the details of the distributions of temperature, rainfall, etc. Certainly in engineering, to be useful and to replace testing, complex simulations must be really quite good at predicting the distributions of relevant quantities, not just their integrals.
Carrick,
My use of the word “residuals” was meant purely to refer to Steve’s comparison graphs, and not to imply that the models were “fitted” by anything like minimising sums of squares. That does not mean that the models are not tuned/fitted/whatever you want to call it. Tuning happens in a host of ways, the simplest being that models which give “silly” results are less likely to be explored and pursued than those which give more “natural” results.
Ah yes, the models that only made the ‘cutting-room floor’. One of the motivations of practical openness of GCMs – open source and executable in a reasonable time on an affordable machine – would be to take a look at what’s being ‘thrown away’. Such a thought experiment runs into the ‘problem’ that current models take nine months to run on a fabulously expensive supercomputer. Yet Callendar’s model didn’t. And outperforms all these efforts. Strange appears to be an understatement.
Jonathan Jones, see my comment here:
Re: Carrick (Dec 13 15:12), sensible points, and I will use “tuning” from now on.
Jonathan
Which models do you think this has happened with? Or are you just speculating? Just because it could happen doesn’t mean that it actually does.
Commentary by Roy Spencer on Miskolczi’s previous work.
http://www.drroyspencer.com/2010/08/comments-on-miskolczi’s-2010-controversial-greenhouse-theory/
I’m guessing any further discussion of this topic does not abide by the moderation rules for this blog, but bad science is never a “must read.”
Steve: you’re right about blog rules.
I think there is another problem here with what Nick suggested. The idea that we have a stable climate attractor on top of which is superimposed random “weather” is a linear analogy which is likely wrong for nonlinear systems except for very small perturbations about some steady state. Weather “noise” could put you on a different dimension or lobe of the attractor.
The real problem here is what Gerry Browning pointed out here I believe in about 2007. Unphysical numerical dissipation especially if it is large, which it clearly is (all sub grid models must add dissipation), a “stable” climate ascertained in models could be an artifact. I don’t see how to rule that out.
There is a simple example of this in Navier-Stokes modeling. A massively separated flow will have a steady state solution with Reynolds’ averaged modeling and a turbulence model as we have shown recently. It is wrong though and more importantly, this “solution” is NOT the time average of the “real” solution. The turbulence model adds dissipation that is non physical for these flows.
Clearly the data needs more upwards adjustments to match the science, which is unassailable.
You are being sarcastic, but that is considered a valid argument, that observations and models are just equally likely to be in error.
Steve:
Can the establishment of modeled sensitivity be as simple as assigning a 1.5 or 1.2? Or does the sensitivity result from a combination of other parameters? Sensitivity seems unlikely to be a constant, maybe more likely to vary over a range due to other factors.
I think he actually meant model run with certain parameters.
Sensitivity is technically the output of a model run. You are right that it would vary with model runs and parameters, but the allegation is that the modelers can push things in one direction or another by fiddling with the parameters.
I have been wondering about this for a long time; maybe people here can clarify. If GCMs have done a good job for the past century, but then the out-of-sample residuals are clearly much bigger than those for the past century – doesn’t that amount to a proof that the models are over-fitted? Data snooping doesn’t have to be intentional, it’s something that happens to modellers a lot if they aren’t careful enough.
In Richard Betts’ analogy, it’s quite understandable if modellers can’t predict if the ball will bounce left or right. But if they point to the skill of their models because, look, they predict the last five bounces perfectly! That would be evidence that they made mistakes in their modelling by attempting to follow the bounces.
As one example, there seems to be a strong suggestion now that a lot of the “pause” may be explained by heat disappearing into the deep ocean. But we don’t even have deep ocean data for more than five years! How could the models have predicted surface temperatures for the previous century? Something is wrong if they did too good a job.
For more comparisons models vs. observations ( 1900…1999) see this: http://www.bishop-hill.net/blog/2014/11/24/best-bad-worse.html . The post links a website from “BEST” where they made the best approach I’ve seen so far: They validatet single models…and the winner is: inmcm4 which calculates a TCR of 1.3 and a ECS of 2.08. Guess why it won? 🙂 Anyway… under the blind the one eyed is king because „Many models still struggle with overall warming; none replicate regional warming well.”
miker,
I agree with you completely. Critics of this post are mostly not distinguishing between the issue presented by the “unprecedented” cumulative residuals and Moncktonian arguments about trends and the hiatus and responding with talking points about trends.
As you observe, if the present hiatus is within natural variability, then there should have been similar patterns in the residuals in the past. This seems baby-food obvious to me.
That last paragraph is only true if temperature is entirely a result of deterministic, periodic processes. It seems that more and more of the climate science community acknowledges that such is not the case, at least, not wholly the case.
Note that a lack of periodicity/determinism does not mean chaos, just that there are other influences that simply do not follow a periodic pattern. There are plenty of naturally occurring random distributions that exhibit both periodic and a-periodic behavior (compound-K, used to describe sea surface behavior, comes to mind).
Mark
I guess it would be good to ask if there is a similar comparison of residuals for the last century (“back-casting” – obviously not for satellite data) to forecasting for this century.
If I understand right, no one ever expects out-of-sample to be just as good as in-sample. But there are rules on how bad it’s supposed to get: http://en.wikipedia.org/wiki/Vapnik%E2%80%93Chervonenkis_theory
Has someone tested this case to see if the residuals are beyond what is allowable? That might be a clear test.
Define “allowable.”
It’s not that I disagree with anything you’ve said, I’m just trying to get a better understanding of what “natural variability” is. My argument is that the phrase is not only unknown, but likely unknowable, at least, not for a long period of time (from now). Even then, only assuming that the static periodicities that apparently drive our climate remain relatively unchanged CAN we know. Lots of dependencies there.
For such a short period of time that we have even remotely decent data, I would not expect any statistical testing to yield much information when comparing such relatively long periods of time.
Mark
‘Define “allowable.”’ Here you’re asking the wrong guy. I took an introductory course in Machine Learning, just enough to have heard about V-C bounds. But it does seem like a question that could have an answer from someone who knows better.
OK.
Nark
miker613, the models don’t predict the last five bounces correctly, they only correctly predict the fact that the ball generally goes downhill (i.e.: they don’t – and can’t – predict internal climate variability*, but they can predict the that climate warms in response to an external forcing)
*unless they are initialised forecast models, but we’re not talking about those here, as Steve’s figure is for the CMIP5 centennial models which are not initialised forecast models. And even then, skill is forecasting internal climate variability is limited, as everybody here will no doubt be aware…..!
but they can predict the that climate warms in response to an external forcing
Can, perhaps, but haven’t. Then again, predictions are just that, no matter how elegant the model, or wordy the peer-reviewed paper.
“miker613, the models don’t predict the last five bounces correctly” But Dr. Betts, they do. Everyone shows the graph of how well the models do for the last century on global surface temperatures. It’s not just that they kinda go up, not at all. They bounce around, but stay within a nice band that goes up when it should, flattens out when it should for two spans in the century, and generally tracks the measured temperatures. The ensemble mean does even better.
Those are the “left” or “right” bounces in your analogy, true? How is it understandable that they do that for a century – and then all together continue upward when surface temperatures flatten out, as soon as they are out of sample?
Or maybe I’m wrong; maybe the out-of-sample error isn’t appreciably bigger than in-sample error. That seems like a question that someone should be able to answer easily.
People are happy to point out this graph of the twentieth century as proof of the efficacy of the models. If I’m saying this correctly, shouldn’t someone tell them that it is actually a big problem?
MikeR,
“Or maybe I’m wrong; maybe the out-of-sample error isn’t appreciably bigger than in-sample error.”
Again, this is not sampling. It isn’t a fitted model.
But in Fig 1, it isn’t even clear that the errors on the right are bigger than those on the left. There is a dip from 1961-90 during the anomaly base period. That’s arithmetic. Subtracting the mean minimises the sum of squares. That was covered here.
More wordsmithing nonsense. Do you not understand the terms “in sample” and “out of sample” as applied to modelling? They have nothing in common with the sampling of a population in the usual sense. It also seems that in your limited world models are fitted only when your data has been selected in that fashion.
For the record, in-sample data refers to information which is available to the modeller and is used in any way when the model is being created and out-of-sample data is either information which is not available at that time or which has been withheld from the fitting process for the specific purpose of testing the model.
“But in Fig 1, it isn’t even clear that the errors on the right are bigger than those on the left.”
“Or maybe I’m wrong; maybe the out-of-sample error isn’t appreciably bigger than in-sample error.”
“That seems like a question that someone should be able to answer easily.”
Miker, OK, I can see my analogy isn’t working very well! The ups and downs in the 20th Century global temperature record which are reproduced by the models are those arising from forced variability – the big bounces caused by hitting big rocks in my analogy. It’s the random little bounces (internal variability) that are unpredictable.
I can see I’m going to have to think of a better way of trying to explain the difference between forced trends/variability and internal variability….!
Richard: Based on your above comments, it sounds like you’re saying that the major moves in global temperature in the past 100 years, closely matched by GCMs, have been from strong external forcings. However, the past 15 years have been dominated by internal variability, which the GCMs have failed to closely match.
If the above accurately describes your views, my question is then: How do you know the difference between external and internally forced variability? Doesn’t the impact of external forcing on temperature depend on sensitivity, and isn’t sensitivity the major output of a GCM in the first place? From my view, it appears to be a bit of circular reasoning; I do not believe that you’ve ruled out an overfitting of feedbacks parameters with this line of reasoning.
A follow-up question would be, even if you were entirely correct about internal vs. external variability, what theory or hunch do you believe can explain the sudden increase in internal volatility since 2000? Others have asked this same question, phrased more or less similarly, elsewhere in this thread.
Dr Betts:
dont you find it somewhat ironic, and troubling that Callendar’s one variable model,,, computed with “analog computers” like slide rules outperforms most CGMs?
GCMs (General Circulation Models) aren’t just simulating global mean temperature – they simulate the global patterns of climate, like the general circulation of the atmosphere (i.e.: large scale wind patterns), rainfall, and so on.
thanks for not answering the question i posed.
Since they dont emulate temperature, or regional rainfall patterns, or any other facet of our weather, particulartly well, how can you be sanguine about the application of their “projections” to the development of governmental policies.
I also note yourv relentless use of equivocation in your responses.
Richard Betts 2014:
“GCMs (General Circulation Models) aren’t just simulating global mean temperature – they simulate the global patterns of climate, like the general circulation of the atmosphere (i.e.: large scale wind patterns), rainfall, and so on.”
Demetris Koutsoyiannis et al 2008:
Abstract “Geographically distributed predictions of future climate, obtained through climate models, are widely used in hydrology and many other disciplines, typically without assessing their reliability. Here we compare the output of various models to temperature and precipitation observations from eight stations with long (over 100 years) records from around the globe. The results show that models perform poorly, even at a climatic (30-year) scale. Thus local model projections cannot be credible, whereas a common argument that models can perform better at larger spatial scales is unsupported.”
Click to access 2008EGU_ClimatePredictionPrSm_.pdf
http://www.oxforddictionaries.com/definition/english/simulate
Richard Betts – Has there been an intervening paper which overturns DK’s findings? Bony and.Stevens 2013 article agrees.
“dont you find it somewhat ironic, and troubling that Callendar’s one variable model,,, computed with “analog computers” like slide rules outperforms most CGMs?”
1. ironic? No. It’s quite common for first order simple models of low dimensional metrics to outperform complex models that aim at getting higher dimensional metrics correct. Not ironic at all. Been there done that.
2. Callendars model only outperforms the complex model in ONE metric space.
If the ONLY goal of a simulation is to get the average global temperature index correct, then a simple model that takes in all forcings ( solar, ghg, volcanoes, aerosols, land use ) will outperform callendar and the GCMS.
See Lucia’s “lumpty”.
However if the goal of a model is to simulate the CLIMATE then you have to output more than a global average.
The models are only comparable if you limit the scope of the comparison. If you compare them on a toy problem.
The question from the user’s POV (h/t earlier exchange)is whether a verifiable more limited forecast/projection is more useful than a complex one with limited verification.
It is also worthwhile pondering whether from the user’s POV enough about future climates can be inferred from the global temperature index.
I take it from you response that you concede the fact that GCMs do not emulate global temperature behavior.
So…a few questions for you Steve, and you know I value the time you spend with us, and I personally appreciate your contribution to my mastery (of sorts) of R.
Do you think that policy makers are creating policies based on GCM’s (lack of) predictive skill over the wider range of climatic phenomena that they fail to emulate, or do you think that the urge to create policies is based more on their projections of increased temperature?
For example…do you think the downward trend in tornado activity in the northern hemisphere is one of those phenomena that GCMs project upon which policy makers depend?
The noticeable lull in hurricanes making landfall in the US, perhaps?
Please, identify any particular model included in the ensemble average which exhibits particular skill in projecting any of the myriad of facets of climate well…for example rainfall patterns in say, England, or the eastern United States?
It is a travesty that we are reduced to looking at an ensemble mean of a group of failed models. The very concept of an “ensemble mean”in this context is without any validity in a statistical sense.
Thank, BTW for your kind response
Steve – please can you check moderation? I have a comment to Richard B with three links in showing as awaiting moderation. Thanks. It was Posted Dec 15, 2014 at 8:39 PM
Miker613:
That is a remarkably subtle observation.
Hi Steve – I would like to further clarify how parameterizations are created.
They are indeed tuned based on a small subset of real world conditions (often what we call “golden days” of observations) and/or a subset of very high resolution model runs (which themselves have tuned parameterizations).
The parameterizations for the climate models are also typically developed separately for different physics (e.g. long- wave radiative flux divergences, short- wave radiative flux divergences, subgrid scale flux divergence, etc), as I discuss in depth in my book
Pielke Sr, R.A., 2013: Mesoscale meteorological modeling. 3rd Edition, Academic Press, 760 pp. http://store.elsevier.com/Mesoscale-Meteorological-Modeling/Roger-A-Pielke-Sr/isbn-9780123852373/
These tuned parameterizations, with their adjusted constants, functions and parameters based on a small subset of actual real world conditions are than applied everywhere in the simulated climate.
The climate models (and weather models too), also have only a portion which is basic physics (e.g. the pressure gradient force, advection, gravity). The remainder of the models are tuned parameterizations.
Weather (short-term) models do so well because they are repeatedly initialized by real world observed data. Multi-decadal climate models have no such constraint and can drift off into predictions that significantly differ from the real world, as you have discussed effectively in your post.
That the multi-decadal climate model predictions (projections) are doing so poorly can be shown when they are run in hindcast; i.e. see the several examples in our articles
Pielke Sr., R.A., R. Wilby, D. Niyogi, F. Hossain, K. Dairaku, J. Adegoke, G. Kallos, T. Seastedt, and K. Suding, 2012: Dealing with complexity and extreme events using a bottom-up, resource-based vulnerability perspective. Extreme Events and Natural Hazards: The Complexity Perspective Geophysical Monograph Series 196 © 2012. American Geophysical Union. All Rights Reserved. 10.1029/2011GM001086. http://pielkeclimatesci.files.wordpress.com/2012/10/r-3651.pdf
Click to access b-18preface.pdf
Thus, that the IPCC model projections are deviating so far from reality should come as no surprise.
Best Regards
Roger Sr.
Roger,
Thanks for this illuminating and worthwhile contribution.
Thanks Dr. Pielke – It seems to me that using GMT as the measure of a model’s skill is problematic. What would you recommend as key metrics to determine skill?
“Blog policy discourages editorializing and complaining.”
I’m going to break the rules because it seems appropriate: I suggest you lead by example. I respect your work and standards a lot, but it seems occassionaly your break down. Why was the following part of your blog entry:
“The “warmest year”, to its shame, neglected Toronto, which experienced a bitter winter and cool summer last year. For now, we can perhaps take some small comfort in the fact that human civilization has apparently continued to exist, perhaps even thrive, even in the face of the “warmest year”.”
Did you seriously make an editorial remark about *local* weather in a post about *climate*? Did you see all the editorial comments it spawned? There are blogs where I expect that kind of commentary from authors. This isn’t one of them.
Hi Tom C – I agree. Even for global warming, the global average temperature anomaly is a very inadequate metric. I discussed this, for example, in my paper
Pielke Sr., R.A., 2003: Heat storage within the Earth system. Bull. Amer. Meteor. Soc., 84, 331-335. http://pielkeclimatesci.wordpress.com/files/2009/10/r-247.pdf
For assessing the larger issue of “climate change”; i.e. changes in local, regional and global climate statistics, we need more metrics than measures of global warming and cooling. For global assessments, for example, the use of monitoring long term changes in key atmospheric and ocean circulation features (e.g. ENSO, PDO; NAO etc) are essential.
With respect to the global averaged temperature anomaly, if the models are doing such a poor job on that metric, their use for more detailed projections is clearly scientifically flawed.
The continued use of non-skillful multi-decadal regional climate projections by the policy and impacts communities, with claims that they have any skill, is not justified.
Roger Sr.
It’s clear to me. How does it become so to decision makers? Post-Lima there’s surely an opportunity.
Richard Betts, you haven’t addressed the questions asked earlier about using the output of these models in subsequent studies such as the ones which would show that the polar bears are doomed in the future or that the prognosticated climate changes will cause everything to go to hell in a hand basket by some month in 2043.
Are they sufficiently robust to be used that way? Is using these models scientifically valid given their inabilities to predict the proximate future?
Richard Betts: “re: setting up GCMs to explore low sensitivity. I can understand your point here, but it’s actually quite hard to deliberately influence emergent properties such as climate sensitivity in a particular way.”
At RealClimate, they put up this in a post
…is based on simulations with the U. of Victoria climate/carbon model tuned to yield the mid-range IPCC climate sensitivity.
http://www.realclimate.org/index.php/archives/2011/11/keystone-xl-game-over/
They didn’t have a problem tuning to get the result they wanted.
MikeN
“U. of Victoria climate/carbon model tuned to yield the mid-range IPCC climate sensitivity”
IIRC the UVIC cliamte/carbon model is an intermediate complexity model, not a 3D general circulation model. Intermediate complexity models are often designed to have adjustable parameters that affect specific emergent properties, such as climate sensitivity, in a predicatable and calibrated fashion, but which don’t necessarily represent known physical processes. E.g., in the original MIT 2D GCM, the calculated cloud amount was adjusted by a global surface temprature dependent factor.
Yes. Now how likely is it that the more complex GCMs produce divergent behavior when adjusting parameters? They have a pretty good idea what results will come from which parameter choices, from both previous runs and runs of simpler models.
I don’t know. Note that many parameters (perhaps the majority) are, I understand, hard-coded in as numbers in code lines, and may not be recognised as potentially-adjustable parameters.
Yes, I hypothesized that above, that they are putting parameter adjustments deeper into the code. They know what is adjustable, no matter where they put it.
I’m with Nic on the “I don’t know.” My hunch is that in code of this complexity some effective parameterisation through mutable state isn’t even understood as such. But that’s no show-stopper, with the number of degrees of freedom available and tacitly understood as such!
from a birdseye view, present IPCC climate models have a considerable span of climate sensitivity – so it’s obviously possible to get different sensitivities with paramaterizations that seem plausible to the modeling group. The lowest sensitivity models are still in “ore” so the lower bound has not been established. Actually, they are not only in ore, but outperforming high sensitivity models.
In any other walk of life, people would experiment to explore the lower boundary. But instead climate scientists seem to avoid such exploration and offer excuses for not doing it. Strange.
However, those are different models, with different designs, so not necessarily different parameterizations.
Steve –
In your blue-below-the-line, red-above-the-line graphs, there seems to be a small plotting glitch, in that the red & blue areas overlap along the x-axis. [Not that I’m a big fan of that presentation style anyway.]
I assume that GCM parameters are determined just as in turbulence modeling. You fit to the data you have for the quantity being modeled. So you look at boundary layer velocity profiles. However, people are aware of the bigger picture of how these choices affect global integrals and do tend to make tweaks based on these global results.
I would question the intelligence of climate modeled if they weren’t aware of how their choices influenced temperature anomalies. How this knowledge is used I don’t know.😉
Richard says:
‘Yep, this is exactly why we are so keen to get bigger computers…..’
I realize that was tongue in cheek but have you ever considered that it is not the models that need tweeking but perhaps the initial data entered into the models. I know you have answered this many times but refresh my memory. If the models consistantly run too hot maybe the forcing affect of CO2 is less than scientist think. Does tweeking the forcing affect improve the predictive efficacy of the models or does it even matter?
RomanM points out:
“Richard Betts, you haven’t addressed the questions asked earlier about using the output of these models in subsequent studies such as the ones which would show that the polar bears are doomed in the future or that the prognosticated climate changes will cause everything to go to hell in a hand basket by some month in 2043.”
SteveM points out: “But instead climate scientists seem to avoid such exploration and offer excuses for not doing it. Strange.”
No, not strange at all.
Josh has his take on following the bouncing ball at Bishop Hill. 🙂
The bouncing ball analogy is fine, bouncing left and right, but always travelling down the slope.
How does Richard Betts ‘know’ the slope is downwards overall?
If he/we/the ball had NO knowledge of the terrain, then each second, we could only guess (not estimate) but guess, overall, which direction the ball would travel.
A bit like global temperatures.
I posted this at Bishop Hill but want to post it here also because I find it very amusing 🙂
The point of the analogy is NOT that the slope is necessarily downward.
That’s why the knot hole analogy is better.
On exploring the parameter space.
Tamsin has done some work. I wish she would do a blog on this
Click to access 20101207110011401-152643.pdf
This video is a must view
https://www.newton.ac.uk/seminar/20101207110011401
1. Note the number of switches and parameters.
2. Note the size of the parameter space.
3. Full exploration is precluded.
If anyone thinks people are wiggling 32 knobs to tune the model to surface
temps, then need to rethink their position and demonstrate that folks are
actually doing this.
Mosh, you’re creating a straw man, at least in respect to my position which is mainly based on the following observations:
(1) there is enough play in parameterizations to permit models with considerable variation in climate sensitivity between the lowest and highest IPCC models;
(2) the lowest sensitivity IPCC models are still “in ore” when tested against global temperature.
Even if “full exploration” of the parameter space is impossible, I think that it is entirely reasonable to posit that there are parameterizations that would yield a plausible GCM with even lower sensitivity than the lowest IPCC model. BY “plausible”, I mean a GCm that is satisfactory on other counts. If one can develop plausible GCMs with sensitivity from over 3 to 1.8 (or whatever), I have seen no evidence that 1.8 (or whatever) is a boundary that is written in stone. I also suspect that specialists would have a pretty good idea which parameterizations could be tweaked towards lower sensitivity – my guess is that tropical clouds would be one. For what it’s worth, Lindzen also believes that it ought to be possible to construct a low sensitivity model; I’ve talked to him about this at considerable length.
Merely asserting this possibility doesn’t demonstrate it. It would take a dedicated program to demonstrate it and it would not be a small job either.
In an engineering situation, I think that there would have been a much more concerted effort to see if a lower sensitivity model was precluded. It might turn out that it was “impossible” to construct a lower sensitivity model also meeting other attributes, but right now, you don’t know this.
+1
BTW, “full exploration” is eminently possible, and doesn’t require bigger computers, just a different platform. (Lots of small commodity servers, but way cheaper than what NASA, the Met Office, etc. are buying). Compare the analysis that Google, Twitter, Facebook, LinkedIn, Ebay, Amazon, etc. do with that of any of the climate models. Their amount of data is (at least) an order of magnitude larger, and the job runs are (at least) an order of magnitude quicker and the cost is about an order of magnitude less.
And it isn’t a matter of learning a new language. R can run on Hadoop. Matlab can run on Hadoop. And if they want to really make it sing, Scala on Spark screams on Hadoop. This does nothing to mitigate tweaking parameters to hindcast, but the days of saying “we can’t afford the compute, send money!” are well past us – at least those of us in the commercial world, anyway.
Steve: much as I like R for statistical analyses, I accept climate modeler statements that they need to use compiled programs like Fortran. The sort of speculation that you’re making here will just seem silly to actual modelers.
Steve,
R and Matlab were just two examples familiar to most in this space, that port fairly effortlessly to Hadoop. Regardless, anything they do in Fortran can be done a lot faster and cheaper with Scala/Java on Spark on top of a Hadoop cluster. NASA is already experimenting with it, albeit using an older (MapReduce) execution framework:
http://www.slideshare.net/mobile/Hadoop_Summit/hadoop-for-highperformance-climate-analytics-use-cases-and-lessons-learned
So, to the extent that it seems “silly to actual modelers” — they’re not keeping up.
I’d prefer that commenters not digress into discussion of programming methods, something that programmers like to do on fairly slight pretext.
The model-observation discrepancy is a large enough topic without being diverted/
Understandable that it’s a tangent, and apologies for the diversion even though you’re commenting on things you don’t really know much about [modelers/silly, not the main post]. I haven’t been considered a “programmer” for about 20 years btw, but will leave that alone too. Cheers, and a very sincere happy holidays to you and yours.
Just catching up on this thread, and as a programmer I take exception to Steve’s assertion that discussing programming methods is “something that programmers like to do on fairly slight pretext” – we’re more than capable of discussing without any kind of pretext.
But further up thread, Richard states that “Yep, this is exactly why we are so keen to get bigger computers”
If we regard hardware, programming methods, model construction and empirical observations as a sort of predictive ecosystem, is there any reason to believe that spending more money on one or more of these factors will lead to any useful reduction in model discrepancy or further constrain the ranges of likely values in a way that’s of any practical use?
“bender, bender, bender”?
Thanks Steve. while I appreciate Mosh’s contributions to this blog, i am exasperated by his willful obtuseness in regard to the whole tuning morass. I think we all know what is going on with the variety of models utilized in this field, and with the equivocation and the hiding behind unreleased code .How can a thinking person be anything but skeptical about the skill of the models in question? Tuning…parameterization…who knows just what is being done?
If there are only five parameters to tune instead of 32 is that really germane?
The way you articulated this point is priceless…
After 20 years or so of modeling, we dont have any better idea of what ECS of CO2 doubling is…and no one seem all that interested in finding out….why?
Instead we have this endless diversion over what GCMs are designed to do…as it turns out according to Dr Betts…estimating the response in temperature to increased CO2 is only one thing that current GCMs fail to do so well.
what other measures of climate do they fail to emulate?
regional rainfall?
hurricanes?
cyclones?
sea level rise?
polar ice cap levels?
exactly what climatic patterns do these models purport to simulate?
how well do they simulate them?
I do know that ex post selection of data…selecting proxies based on how well they mimic 20th century temperature data and the arbitrary exclusion and inclusion of time series is the worst type of statistical malfeasance. its simply indefensible.
Ignoring the heteroskedasticity inherent in paleoproxies, and then splicing these (noisy) proxies onto instrumental records is simply indefensible. yet it continues…and people like Drs Robert Way and Richard Betts feel comfortable with the state of their field.
Can I also just express my exasperation over the use of PCA to create an emulation of a century of climate data?
if all the principal components were truly independent of each other (orthogonal) then how could all of them act as proxies for some imaginary global climate?
what we have instead is people using existing paleoproxy time series as colors in their palette, and weighting them so that the resulting sum of them looks something like the 20th century… no that the proxies are reliable indicators of past climatic conditions..not that there is any rational reason for the weighting of those proxies…not that those individual proxies actually have anything to do with climate…they are jutst patterns to be weighed and summed until the modelers get what they want.
whether the proxies individually have any relationship to climate is at best uncertain…they exist merely to give the creators of the models patterns of variance with which to work.
thanks for letting me vent.
David –
This:
what we have instead is people using existing paleoproxy time series as colors in their palette, and weighting them so that the resulting sum of them looks something like the 20th century… no that the proxies are reliable indicators of past climatic conditions..not that there is any rational reason for the weighting of those proxies…not that those individual proxies actually have anything to do with climate…they are jutst patterns to be weighed and summed until the modelers get what they want.
…was nicely put.
@ Tom C: Yes, good call-out. +2!
David E, some para-breaks & a bit of formatting would help your posts comprehensibility s lot!
TIA, Pete Tillman
Should have kept the curtain drawn on this one, Mosher. At 9:38: “The fact is that HadCM3, for all its many wonderful properties, is a very poor representation of actual climate.” Yet it was included in TAR. I am curious how it was represented back then. People are going to jump on that little admission.
Yes, they are not simply twiddling knobs. They are taking an extremely small sample of the vast parameter space and trying to make inferences from that sample about the rest of the space. Quite daunting, especially given the strong sensitivity to initial conditions (7:19).
As a non-scientist, I have to say that I am appalled at what I have read here.
This from Richard Betts:
“Posted Dec 12, 2014 at 6:39 PM | Permalink
Steven Mosher, yes, I don’t understand why Steve thinks this is ‘adjusting data after the fact’ either.
To continue with my ‘ball bouncing down the slope’ analogy above, the CMIP5 models are like a bunch of people tried to predict where the ball will land when we let it go at the top. Some made predictions over to the left, some over to th
In fact I’m an advocate for openness. In IPCC AR5, I was one of those pushing for immediate release of chapters at the same time as the SPM (which never previously happened).
e right. The group of all predictions was quite wide. Then we let the ball go, and let it go half way down the hill. It starts heading towards the left, and eventually it becomes obvious than there’s no way it’s going to match the predictions over to the very right. Someone catches the ball, and we all make new predictions. There’s still a spread, but less so because we’re now closer to the bottom of the hill so less room for random effects to make a big difference.
So it’s not ‘adjusting data after the fact’, it’s just taking a reflective approach, learning from experience and refining things based on what we see happening.
Of course it still may all turn out wrong! There might be a hidden dip in the slope which turns the ball way back off to the right again, and in the climate system there might be something unexpected in the system that makes reality go outside the range of projections (either above or below). In fact I wouldn’t be at all surprised if there was, as we’re in a situation outside of past experience. Steve talks of things ‘looking more realistic’ – well we won’t know what really was realistic until it’s happened….!
…when we all know that the stitch-up with the SPM coming out first is worse, not better.
Then this complete tosh from Mosher:
“1. who defines the USE.. the user
2. If the use is making policy, who is the user? the policy maker. NOT YOU, not me, not the
science team.
3. Can a policy maker decide that GCMS are “good enough” to make policy? yes.
The bottom line is that not a single one of you understands VALID FOR INTENDED USE.. A use can decide
that a model only needs to get the 100 year trend correct. Or that it should be within 50%
of reality. the end user decides. Not you. not me. not the science teams.”
Then this from Betts:
“Richard Betts
Posted Dec 14, 2014 at 6:44 PM | Permalink
Steve
re: setting up GCMs to explore low sensitivity. I can understand your point here, but it’s actually quite hard to deliberately influence emergent properties such as climate sensitivity in a particular way. There have been a few studies which aimed to explore uncertainties more systematically than the ‘ensemble of opportunity’ that happens in the CMIP / IPCC process – I’m thinking of the perturbed parameter ensembles of the Met Office Hadley Centre ‘QUMP’ ensemble (which feed into UKCP09) and ClimatePrediction.Net . These both produced quite a wide range of sensitivities, emerging from the ranges of values for the perturbed parameters, but as far as I’m aware my colleagues did not specifically set out to create parameter sets which gave specific climate sensitivities (either low or high).”
And again:
“Richard Betts
Posted Dec 15, 2014 at 5:46 PM | Permalink | Reply
HaroldW,
Thanks for this. Actually I had in mind gravity being the radiative forcing (i.e.: influence of increasing GHGs), my point being that the models can (broadly) predict the response this forcing (ball going downhill) but not the (smaller) randomness along the way. So similar to your version I guess, but with gravity instead of wind.”
And then this exchange:
” Craig Loehle
Posted Dec 13, 2014 at 8:25 PM | Permalink | Reply
Unfortunately the result of “as we know them” is that actual cloudiness and modeled cloudiness at regional scales are wildly different, along with precipitation. The actual behaviors of clouds are at much too fine a scale for the models to simulate.
⦁ Richard Betts
Posted Dec 14, 2014 at 6:12 PM | Permalink
Yep, this is exactly why we are so keen to get bigger computers….. 😉
TAG
Posted Dec 14, 2014 at 6:20 PM | Permalink
Yep, this is exactly why we are so keen to get bigger computers
How much of an increase in computing power is needed. is this a question of money or lack of adequate technology?”
The question I have to ask these people is: do you have no sense of shame?
When I asked “do you have no sense of shame?”, I am speaking to Mr Mosher and Mr Betts.
You will be snipped
All large scale simulations have areas that can be tweeked mainly because you do not
have 100% certainty in the values of many of the input variables. Forget for the moment that your basic physics equations; navier-stokes, Bernoulli, etc are approximations to the real world, their description of the physical world is close enough for us to estimate some things in nature well enough to be useful.
One example; the grid-cell sizes are fairly large and may only contain one or few
values for the albedo. Take a cell that contains lots of Sierra Nevada granite,
considerable forest and plenty of sandy desert. A single value for the albedo would
not be an accurate description of that cell. The absolute value of the various reflections would be off. Now, if that type of area only accounts for 5E-07th of the
surface of the earth, you might be able to ignore it. Using smaller cells, or being
able to model a large, tree-abundant city in a desert cell may improve the estimate,
but at a higher cost in computational time and complexity. Another way would be to
say, let’s make our mountain cell x% darker and see what effect that has on the output.
Thus, that becomes one of the “knobs”. Let’s just acknowledge that there is lots of
uncertaintly in the GCMs with respect to albedo, cloud formation and motion, vegetation
coverage, ocean mixing, etc. But, lastly, be kind to the modellers, they have a tough
job.
But, lastly, be kind to the modellers, they have a tough job.
Payed decent salaries to play with their models? I think the bulk of the world would disagree about the amount of toughness the poor dears have!
In any case, the problem is not that their job is hard. The problem is that too many of them think they have the problem more or less cracked. If they said, as a group, “our models are not yet fit for substantial policy decisions” there would be no issue.
Instead too many want it both ways. To have it a hard job that we cannot criticise when it goes wrong — but also that their results are reliable enough for political decisions. No. Either it is a job that they can do, and do well. Or it is too hard for them to do properly, and they should make that clear.
Ed: Well, I do rely on the kindness of strangers, so here’s a try. Mosher suggests there are model builders out there who are sincerely working at models that don’t fail. I’d be kind to them, if I could find them, but they seem to be the Bigfoot of climate-they may not exist! And if they do exist, their models show a “pause”, so the press has no interest in finding them and others would call them deniers or the like. I’ll be somewhat kind to the few (Betts, Way, Mosher, others, yes Stokes) who post and engage here (and take this from the likes of me), and sometimes enlighten-but all too often drive us directly down rabbit holes. They also freely acknowledge uncertainties and complexities when they post here, yet they evidently do not engage the “95% confident” crowd (here’s a quick question- is the “internal variability” mentioned above part of, or all of, the remaining 5%?) on these uncertainties. As per the host, strange.
“Curious” – you wrote
Richard Betts 2014:
“GCMs (General Circulation Models) aren’t just simulating global mean temperature – they simulate the global patterns of climate, like the general circulation of the atmosphere (i.e.: large scale wind patterns), rainfall, and so on.”
and added
“Demetris Koutsoyiannis et al 2008:
Abstract “Geographically distributed predictions of future climate, obtained through climate models, are widely used in hydrology and many other disciplines, typically without assessing their reliability. Here we compare the output of various models to temperature and precipitation observations from eight stations with long (over 100 years) records from around the globe. The results show that models perform poorly, even at a climatic (30-year) scale. Thus local model projections cannot be credible, whereas a common argument that models can perform better at larger spatial scales is unsupported.”
and asked the question
“Richard Betts – Has there been an intervening paper which overturns DK’s findings?”
Actually, adding to Demetris’ excellent paper are quite a few peer reviewed articles that we summarized in our article
Click to access b-18preface.pdf
As just two examples
Stephens et al. (2010) wrote
“models produce precipitation approximately twice as often as that observed and make rainfall far too lightly…The differences in the character of model precipitation are systemic and have a number of important implications for modeling the coupled Earth system …little skill in precipitation [is] calculated at individual grid points, and thus applications involving downscaling of grid point precipitation to yet even finer-scale resolution has little foundation and relevance to the real Earth system.”
Xu and Yang (2012) find that without tuning from real world observations, the model predictions are in significant error. For example, they found that
“the traditional dynamic downscaling (TDD) [i.e. without tuning) overestimates precipitation by 0.5-1.5 mm d-1…The 2-year return level of summer daily maximum temperature simulated by the TDD is underestimated by 2-6 C over the central United States-Canada region.”
Other examples are in our article.
That the models have major flaws in simulating “the global patterns of climate, like the general circulation of the atmosphere (i.e.: large scale wind patterns), rainfall, and so on” is very convincing.
Roger Sr.
Roger – thank you for taking the trouble to reply.
Richard Betts – I ask again; do you have any references which are able to support your assertions? Original question is up thread at Dec 15, 2014 at 8:39 PM in case you missed it whilst it was in moderation.
I am simply gobsmacked that an issue which commands such extraordinary funding from governments and imposes huge costs on economic development can be so poorly documented that conversations like this one can occur at this late date.
That fact that a comment thread like this can be generated (assuming good faith on the part of all involved) demonstrates that those who rely on the models have been woefully derelict in meeting their duties for public transparency. Not to mention the keepers of the public purse who fund them.
There is simply no excuse that ‘science’ which is so crucially involved in public policy be so poorly documented for the public.
It would be interesting to know what representations on the expected utility of the models were made by the applicants, when they were seeking funding. Mosher can probably tell us.
Historically the models were built to enhance the understanding of scientists.
Basically the scientists built them FOR THEMSELVES. that explains the lack
of a spec.
The case is probably different for weather models some of which get re purposed for climate studies.
The bottom line is there is probably an interesting history here of how weather models and climate models got started and funded and then how they got put to the job of informing policy.
everyone keeps trying to make out modelers as bad guys.
maybe some facts and actually history would help
That is bullshit of the highest order.
These models were constructed with government grants…the complete opposite of self interested, self funded research, they were used to justify changes in governmental policies…changes which caused poor and working class people to pay much more for energy than necessary.
you are simply incorrect, and that is a polite way to phrase you current writings.
I am interested in the actual history, Steven. Particularly the part where the specless models built by scientists for themselves became influential in the making of public policies. Who suggested that the models were fit for the purpose and what evidence have they presented?
Is it something like this:
http://www.nas-sites.org/climatemodeling/page_4_1.php
The NAS says:”Because scientists are able to compare their climate models to both historical and present day data, they are able to validate and improve their efforts over both the long term and the short term. Models are improving all the time. Here are a couple of examples from climate models that show particularly good comparisons with observations for specific weather events:”
So they got a couple of specific weather events about right. I don’t claim to know doo-doo from Shinola, but I don’t think that is validation. Is this the kind of story they have told the politicians and the press to explain validation?
Re: Steven Mosher (Dec 17 15:36), Don Montfort raises an interesting point. There is a whole field of computer science that deals with validation and verification of models — and since model discrepancy is being discussed it seems to be relevant.
Click to access L08-Testing.pdf
i.e.
Does the software do what was wanted?
( are we building the right system? And that is the nub of the problem — it’s subjective.)
as opposed to verification:
Does the software meets it’s specs.
This is not a trivial issue and is a struggle in any large system.
While the modelers may well be due for some criticism, they weren’t the objects of my reference. My frustration is directed at those who rely on the models and use their output to mold policy.
Steve Mc, as I understand it, started on this journey because of his great surprise that ‘science’ used in the public sphere to make such sweeping policy should be so poorly vetted (as opposed to a mining IPO).
It seems like every month or so that we read a post by Judy Curry or someone else discussing more claims that climate scientists are looking for a way to do a better job of “communicating” the science. My suggestion — communicate clearly and as transparently as possible the details of the models. And be available to answer any and all serious questions which arise. In the end, that should really be required by the governments themselves, but we know better than to expect that. If climate alarmist scientists really want better communication, get it done.
Oh, and get serious about making data and code readily available.
There is a whole lot of science that needs communicating.
Mosh, you sayL
Huh?? I, for one, haven’t said anything of the sort. And I’m part of the “everyone” here. I’ve said that I don’t believe that modelers have adequately canvassed models with sensitivity less than IPCC models. I think that this is both a true observation and a fair observation. In doing so, I didn;t make the slightest suggestion that the modelers were “bad guys”.
You’re being too chippy.
Steve: For me these two responses (including at href=”#comment-744612″>11:11 PM) are among your finest on CA. I too don’t see modelers as bad guys though I’ve always felt in my gut that their efforts aren’t remotely policy-ready. I think Mosh is right that writing up the history better might help. But above all I agree with you and others who insist that the viability of the GCMs is an issue for everyone to judge, assisted by whichever local experts they have reason to respect. As usual you’ve taken a careful and measured approach in this thread – albeit a devastating one for current practice. “Trust but verify” seems a valid slogan, even if it’s challenging to know what full verification might look like in this area, except over many decades.
11:11 PM that should have been.
WillR
the point I am making is rather simple.
When folks raise the issue of validation they think it is Obvious on its face what this means.
They think validation means match reality.
it doesnt.
it means satisfy the requirements.
Re: Steven Mosher (Dec 17 15:36), Steven:
The point is not simple: (It just sounds simple.) So I don’t think we are in disagreement — at least I hope not.
Validation
does the software do what was wanted?
“Are we building the right system?”
This is difficult to determine and involves subjective judgements
Verification
does the software meet its specification?
“Are we building the system right?”
This can be objective if the specifications are sufficiently precise.
So as long as we say meeting the requirements means doing what we want — which may not necessarily meet the spec — then we are in agreement.
I wasn’t really responding to you and no criticism of your points was intended — I was just responding to or adding to what Don said, but he did raise the issue: Do people know what these terms mean? In any case those are the accepted CS definitions. (CS Students must be able to repeat these points on demand.)
From what I can see the Climate Models may verify to some spec somewhere — for those who wrote one — sections may even pass unit tests (unit verification) — but the real issue is that they do not seem to validate against observations — at least not going forward, at least not for the most part
…and I really do think that this issue is right on point as it seams to me the discrepancies being pointed out are another way of saying that are “validation issues”.
Cheers!
Steven Mosher
The Met Office Hadley Centre model in CMIP5, HadGEM2-ES, is a recent configuration of the Unified Model (UM) which was originally set up about 25 years ago in order to do numerical weather prediction and global climate modelling in the same system. Since then it has gone through numerous upgrades of various parametrization schemes (clouds, land surface processes etc) and one upgrade of the representation of atmospheric fluid dynamics. These upgrades only get into the UM system if they improve the weather forecast, otherwise they are not allowed.
davideisenstadt
Mosher is right, and you are completely wrong. The climate models are built to forecast the weather, understand the workings of the climate and make estimates of future climate change. Yes of course they are funded by government grants, but so is most national-level research.
Wow. As a person with some significant experience in computational implications of complex systems (I usually work in fundamental/general computational issues, and application in demographics, but the principles are similar)… I am astounded at the assumptions being made.
1) It is disingenuous to say the models are not tuned/tweaked/whatever. Just look at the papers being quoted. Not only do I see half a dozen or more dials tweaked until the past climate “fits”… those dials are KNOWN to be wholly inadequate representations of the actual physical processes involved, even at a macro level.
a) We are dealing with a form of goal displacement (we don’t have models/measures for all the things we know are important, so we substitute a few other items.)…
b) We also are using radically simplified substitutes — eg percent cloud cover instead of a real model for clouds… even though significant research suggests clouds may be part of a major negative/buffering feedback system.
2) I believe Roger Pielke has touched on one key element of concern: we can *prove* that general rainfall patterns, and their climate implications, are way off. This area most likely also would include another CA “resident”‘s favorite feedback mechanism: thunderheads.
Why can’t we just admit that the highest probability is that in our rush to quickly identify anthropogenic forcings, most likely we are still missing the most important natural forcings and feedbacks?
To say that out-of-sample residuals continue to be way too high is NOT to imply that the models are just badly parameterized. Remember Bender’s Dictum 🙂 — there are three uncertainties in any measurement system: Data, Model, and Model Parameters.
If the model itself is essentially bogus, all the data and parameter tuning in the world will not improve the model.
Bottom line from my old example: just because my brother was once twice my age doesn’t mean Age(John) = 2.0 * Age(Pete) is a valid or even useful model. 😀
Collect more data all you like. Tune those parameters all you want. A bad model is still a bad model, even if it “works” for a short period of time.
But if we can’t even say why the model is off by 50 or 100%, such as that in reality it is missing huge natural factors rather than just being badly tuned, then we are misleading policymakers to suggest that the model is adequate to inform action.
Two scenarios:
A) The model is about right on a global scale, but might get the anthropogenic factor off by 50%. IOW, taking any particular anthropogenic action might not affect things 100% as intended but ought to at least head us in the right direction, even if off by 50%.
B) The model is missing major natural factors that are actually the primary climate drivers. It’s essentially a clock that is randomly correct twice a day. IOW, taking any particular anthropogenic action will have essentially random impact: might do nothing at all, might make it worse, might help. (In this case, the actual result depends on the impact of our actions on the unidentified natural factors.)
From what is being said, we can’t even distinguish these two scenarios. Yet we’re telling policymakers that our models are good enough to confidently claim Scenario A is correct.
That’s horrifying. Reminds me of conservationists’ recommendations for diverting water in south Florida 100 years ago. But on a much bigger scale. Oopsie.
“But if we can’t even say why the model is off by 50 or 100%, such as that in reality it is missing huge natural factors rather than just being badly tuned, then we are misleading policymakers to suggest that the model is adequate to inform action.”
Wrong.
1. “We”. what you can say or not say doesnt matter one whit.
2. You dont need to know why a model is off. You merely need to
know it is off. If my model is consistently underpredicting
a quantity that is USEFUL knowledge even if I dont know why.
3. you misunderstand what it means to inform policy. Policy is made and
can be made on bad data, wrong data, uncertain data.
Like others here you continue to believe that action requires knowledge.
it doesn’t.
“Like others here you continue to believe that action requires knowledge.
it doesn’t.”
Well, that certainly explains a large number of actions I see taken around me.
“Action on climate does not require knowledge.”
A bit too long for a bumper sticker, but I’d be happy to pass out campaign signs with that on it…for a candidate or referendum I’d like to see lose.
mosh youre turning into a pedantic equivocator…it ill suits you.
No I am explaining to you the LOGICAL consequence of demanding validation.
Mosh, can you go clean up your other open items before you get too far into this one?
Also, and again – when you feel the need to use all-caps, consider taking a deep breath and re-working the post/argument, please. No need to yell. Thanks. 🙂
Re: Steven Mosher (Dec 17 16:02),
Mosh, if what you say is true, then the following model provides useful information: a decreasing trend of 0.1c per decade. It consistently underpredicts climate over 50+ year periods in modern times.
So what?
GIGO has meaning, even for policy.
This is how we end up with echo chambers. Very sad.
Re: Steven Mosher (Dec 17 16:02),
Please define “inform policy.”
YES, Policy is and can be made on bad/wrong/biased/uninformed data.
But Informed Policy?
Any ethical, reasonable take on policy “informed” by Bad/Wrong/Uninformed data would have to call it a Bad/Wrong/Uninformed Policy. Not “informed” policy.
Good measurement is Observation that tells us more about what is actually happening (technically: reduces uncertainty about the truth.)
Your take on Policy, applied in the medical field, would accept without complaint gov’t policy that causes horrific fatality rates as if it were equivalent to policy that protects lives. No thanks for medicine, no thanks for climate.
Wrong again.
its not a matter of ethics. its a matter of pragmatics.
When Desert Storm was planned models were used. Un tested, un testable, wrong.
They informed the decisions. The decision makers have the absolute right to use any information they want to.
you have no say, I have no say.
Re: Steven Mosher (Dec 17 16:02),
Mosh, I suspect you are conflating those who insist on perfect data (to which a very reasonable response is “this is useful data.”)…
…with my concern about data/models/parameterizations that are so bad that they actually are not useful.
I do get the difference. Do you? What would it take for you to recognize a model as not useful?
Consider the new investigation at http://metrics.stanford.edu/ — turns out that science is being done so badly that quite a lot of the most-cited, supposedly-best medical research is later being proven wrong.
Such research is not useful. Policy based on such research is not useful.
re: the Stanford “Metrics” group
that is co-Directed by Ioannidis who has done pioneering work on failings and unreliability in medical research (“Why most Published Research Findings are False”):
http://metrics.stanford.edu/about-us/faculty
If only we could see some research from that group focus upon climate model discrepancies and other problems of “climate change” research!
Usefulness is judged by the user. Not by you.
A model that a user rejected would be useless.
So what I think doesn’t matter. You need to ask a policy maker.
You keep thinking that your opinion matters. It doesn’t
For what it’s worth, that assertion is completely opposed to the policy of this blog. If climate change is a large problem, then dealing with it will require the commitment of a broad spectrum of the society, not just a few policy-makers. Nor, in a practical sense, can policy-makers implement far reaching policies without the consent and commitment of a broad spectrum of the society.
At one extreme, everything is pointless, but on another level, it’s surprising what individuals can accomplish. To the extent that I, or this blog, have had any impact, I would claim this as an example. I believe that well-informed individuals are important in a civilized society and that they are often opinion leaders within their own circles. While the opinion of a single individual may not matter very much, the opinion of the society does matter. And at this particular blog, the opinions of indviduals may not have equal weight, but they do matter.
Mosh,
Get a grip. The policy makers work for us. And they don’t get lifetime appointments. I know that many appear to be a bit confused on the relationship, but we can get that fixed. Hubris doesn’t have to be forever.
My Congressman lives around the corner. I know my opinion matters to him. 😀
Steven Mosher @ 8:52 PM
I’m not sure if you have spent any time as a user of complex sources of information for decision making whether in public policy or otherwise. But if you do have any experience then you will know the user expects the adviser to be conforming to accepted standards when giving advice, particularly when representing their advice to be of that nature.
So the modeller is not only offering the model they are offering a warrant of fitness. If they see it being used outside that, part of the deal with the user is that they will advise accordingly.
Now in the private sector where I suspect you have had most of your experience in these matters it is caveat emptor. Snake oil salespeople need to be tarred and feathered before they move onto the next town if there is to be any justice. It’s private business with lead pipes behind the bike sheds.
In public policy it is different. The public have an interest. If modellers are standing by while their models are being used inappropriately the Mr Petes have every right to take a view, and silence reflects badly on the modellers, their professional societies as well as ultimately coming home to bite the users.
To quote a prolific member of the literati in these quartes “I suspect in this you keep thinking that your opinion matters. It doesn’t.”
Steve Mc and others are getting close to understanding the deeper point.
Our host wrote:
“it’s surprising what individuals can accomplish. To the extent that I, or this blog, have had any impact, I would claim this as an example. I believe that well-informed individuals are important in a civilized society and that they are often opinion leaders within their own circles.”
+5, and Bravo!
Mr. Mosher –
Are you effing kidding me? I have eagerly read your writings on this blog and Judith Curry’s. I respect your opinion and, given your expertise with the english language, generally feel that I do NOT want to be on the opposite side of any of your opinions. However, I must take exception to your latest posts. Policy makers in this country are elected by the people. For you to discount the opinions of non-policy makers is a very poor smokescreen. I understand that you seem loathe to agree with people who are critical of the models and their output. I understand that your position is increasing CO2 levels will increase global temperatures and that this is undesirable. But to say that only the intended users of the models can criticize them is nonsense. More than that, it is beneath you.
his true colors came shining through. Now we know where he is coming from…I dont know…maybe a few brews in him loosened him up enough to come clean.
“For you to discount the opinions of non-policy makers is a very poor smokescreen.”
I am not discounting them. I am telling you that your opinion and my opinion dont matter.
factually. dont. matter.
Does your opinion matter to me? sure? but Im not a policy maker.
Simple fact. A policy maker can make his decision about abortion based on his own damn reading of the bible, for example.
You might argue thats not science. You might argue that he is wrong to do so. But in fact he gets to do it.
Perhaps what we need is a “policy-making” model. They can start with Australia. Should keep them busy for a while.
Mosh- call bender. See if he can bail you out of this one.
Mosher is just saying ‘the models are being fixed around the policy.”
and now we have someone getting closer to the point
If I were a reasonable, responsible policy maker, I would have to say, after reading all the above, I am not presently going to make any decisions involving billions of dollars and the lives of millions of individuals based on the output of these computer models. Get back to me when you can prove to me, in the best traditions of science, including absolute transparency, otherwise.
Well you are not a policy maker.
What you think doesn’t matter.
He is not a policy maker but many people like him answer the polls that drive policy maker decisions. As Roger Pielke Jr. points out there are large majorities of people who want action taken on AGW and yet nothing of significance happens. Perhaps policy makers should understand the reasons that Pielke Jr. points out for this. Pielke Jr. tried to point out some IPCC recognized empirical facts about AGW on the 538 blog and was swamped with criticism because these did not agree with convenient predictions taken from models.
perhaps there is a the connections between models, policy makers, noted climate scientists, policy proposals and political action is more complicated that one might think.
You’ve lost the plot, Mosh.
What individuals think does matter, regardless of what you assert.
Remember our founding principle of a government “of the people, by the people, for the people”? That was part of the reason I joined the Army, so many years ago. Your continual assertions that what commenters here say doesn’t matter pisses me off to the core of my being. Quit being lazy and refute the argument logically, instead of this animal farm bullshit about “you don’t matter.”
I’ll still fight for your right to make arrogant, stupid statements, but lately I have about as much respect for you as Nick Stokes. You’re being the same lazy, arrogant, I’ll-just-make-things-up-when-I-want person that you were recently complaining about Nick, and it’s unbecoming.
Back to math, please – you’re lots better at that.
really?
do you have a pen and a phone?
Let me make the point a little sharper for you. If you want your opinion to matter, then you need to back it up with some action. write a better model. run for office. otherwise, its just a blog comment. get my point yet.. it’s slow in coming out but I want to make you think pragmatically.
You left out a third possibility: Convince some other person in the policy sector that the information provided by the model is inadequate for the purpose and have them prevent the action which the model supposedly provides the backing.
I agree with Mr Pete. You are derailing a serious look at the models by claiming that the only viable “validation” is by some nebulous group of policy makers. Unlike your general for whom you produce a model to specification, the policy makers are an ephemeral group which changes through time. Showing that a particular set of models hasn’t got it right and are invalid for making enormous societal changes at this point in time can have an effect.
If you want your opinion to matter, then you need to back it up with some action. write a better model. run for office.
You didn’t say that. You said it doesn’t matter. Period. Try to stay consistent, lest people start to refer to you as Racehorse.
Anyone seen the movie, “Key Largo”? This reminds me of the scene where H. Bogart corrects the naive assumption of the old man, who thinks the US govt can handle the gangster Rocco. Bogie knows otherwise, very cynical, knows that we (the “non-users”) are naive to think we can have a world without gangsters like Rocco. Several posters think we in US have a gov’t that still answers to us, making us Mosher’s ultimate user. Mosher thinks our gov’t policy makers have no use for our opinions (all too often he’s right, IMO). He seems to know we have gangster policy makers, you know, the ones who pushed the innocent modelers down in the mud and took their models for nefarious “uses” unforeseen by the modelers. These policy making “users”, evidently answer to no one, they are to blame, not the poor modelers. And he’s now showing his open contempt for those of us who blame the modelers or call for an account. Hope he can recover from this episode.
The hell it doesn’t!
Here is another model-observation discrepancy: ocean heat content change. Here is how the IPCC Fifth Assessment Report characterizes the performance of the models:
“Many models are able to reproduce the observed changes in upper ocean heat content from 1961 to 2005 with the multi-model mean time series falling within the range of the available observational estimates for most of the period. The ability of models to simulate ocean heat uptake, including variations imposed by large volcanic eruptions, adds confidence to their use in assessing the global energy budget and simulating the thermal component of
sea level rise. {9.4.2, Figure 9.17}”
Here is the corresponding figure. They could have written that many more models are unable to reproduce the observed changes, and are, in fact, so wildly off and diverging that they are unusable for simulating the thermal component of sea level rise. Their description lowers confidence in their ability to objectively assess model performance.
My attempt to post the figure seems to have failed. Here is the link:
MHappold is there a more up to date figure. This seems to eviscerate the argument ‘the oceans ate my global warming’ If actual ocean heat is coming in under or in line with model projections, then how can the heat be missing in the ocean? Indeed, the 0-700m discrepancy is smaller than the overall, which means the deep ocean modeled results have an even wider discrepancy than the bottom figures.
Suspicious isn’t it? A figure published in 2013 but only showing data for up to 2005. Where have we heard that before? Seven years missing (since 2013 would have been incomplete). There is another figure in that Chapter that also only goes to 2005 (9.10). I don’t know of a more up-to-date one for ocean heat off-hand, but now I am going to start digging.
I had been planning to try and construct such a figure from the models, but had no idea how to go about it. Now I see the IPCC confirming my suspicions.
Many people – especially the believers – seem to think that if actual temperatures meet the predicted line then the models would be proven to be right. But if you think about this, it is not the case. It is the trend lines that need to match and, as the diagram from my website shows, you need a truly spectacular rate of rise for that to happen.
http://www.bryanleyland.co.nz/future-temperature-trends.html
I find on most of these graphs I’d like to see included the simple linear fit to the whole time-series .
Bob A.: you can do that here, going back to about 1880:
http://www.ysbl.york.ac.uk/~cowtan/applets/trend/trend.html
Steven Mosher
Posted Dec 17, 2014 at 8:52 PM
Mosh:
with all due respect (that is, with all the respect your posts deserve)
youre acting like an ass…at this point, it would be better for you to just let it go. we all know youre in a pissy mood today, and your pedantic nitpicking and equivocation does you no good. really, you are appearing smaller and more petty by the hour.
it is sad to see this from you. really sad.
Steve wrote
It seems to me that at a deeper level, modelers have not adequately integrated current research into natural processes that could impact their models toward less sensitivity.
Where are the Lindzen, Svalgaard etc tunable parameters? Where are even the most rudimentary buffering/negative-feedback mechanisms, allowing for precipitation, clouds, etc to provide dynamic negative feedback on warming rather than static (let alone positive feedback) assumptions?
The lack of such processes seems to be possibly a victim of policy, eg IPCC policy that only attempts a remit to examine anthropogenic questions rather than “what is really happening” questions.
Surprise: Questions that are not asked will never be answered.
“Questions that are not asked will never be answered.”
Given the quality of the current models, the same applies to questions that are asked.
Yes indeed, questions that are asked don’t get answers. Mr. Betts was asked this earlier:
“Are the climate models (which drive the sea ice models) really going to be accurate enough over that 30-36 year interval (as required by polar bear biologists) to be valid?
In other words, is it possible for those models to be precise within the next 36 years?”
Crickets.
Actually, Dr. Pielke(Sr) addressed this with some clarity up-thread:
“The continued use of non-skillful multi-decadal regional climate projections by the policy and impacts communities, with claims that they have any skill, is not justified.”
This thread has been utterly riveting and quite startling in terms of the fallout. It reminds me why I come here regularly and also that it’s been some time since I dropped a small contribution into the tip jar.
Thank you Steve and all the other, so knowledgeable contributors, for everything.
Re: Steven Mosher (Dec 17 20:42),
We DO get to influence those decisions, so what we think DOES matter. Maybe not as much as we’d like, but that too is part of the process. Yes, science has been going downhill for quite some time in this sense… and correctives are needed both in academia and gov’t.
But we need to start somewhere. And YES understanding “how bad” is exactly an important point.
Which gets back to the real point of what I said above before Mosh distracted.
I’m not concerned about “who gets to decide” right now. I’m concerned about “how bad.”
If it is SO bad that quite likely the primary drivers aren’t even part of the model, and the drivers that policymakers care about are being so badly modeled that they have no valid information as to whether policy decisions will make things better, worse, or just be a waste of funds (and therefore make something ELSE worse because the money would have been better spent in another area)… well, that’s important information.
And NO I don’t believe “everyone is aware of the problems of using bad information.” The vast majority of the public, the media, etc, believe what we get from these models and IPCC is generally GOOD information, that they are NOT being misled in any way.
Let me illustrate for you an others what you invoke when you invoke verification.
model verification has a specific meaning.
Lets start with user requirements
1. The model shall predict sea level rise over a 100 year period.
2. the model shall produce answers that are accurate within 1 meter.
That’s a requirements document. You may not like it, but users set requirements.
here is a spec
1. The model will predict sea level rise over a 100 year period.
2. the model will produce answers that are accurate within 1 meter.
How do you validate the model? you test against the spec.. If it meets the spec its valid. Period.
the only mistakes a modeler can make is a failure to meet the spec.
In climate modeling, nobody has set out a clear spec. Nobody has defined what is “good enough”
In fact you might not even be able to define what is good enough.
Is callendars model good enough? Look according to some its better than a GCM. Is it good enough?
good enough for what? good enough for whom?
I could look at callendars model and say ” hmm, adding C02 causes warming, we probably shouldn’t do that”
why? because I dont know the damage that would cause. That’s a perfectly rational response. You might
say… well we dont know the damage, there fore business as usual is ok. That too is a rational response.
Let me put it entirely differently. Imagine a perfect model that predicted 2C of warming. Imagine that the models were exactly perfect hour by hour inch by inch. Imagine they predicted 2C of warming.
There isnt a single skeptic who would change his position, even if models were perfect.not a one.
In other words for all the bluster about what is good enough, in the end skeptics cant define what they would except as proof, and further, even if they were presented with perfect models, they would still resist taking action.
Steven, do you know if the policy makers have been informed that the models they are using to formulate policy have not been validated? Do they know about the unprecendented model discrepancy? Or are they being fed bullcrap like this?:
http://www.nas-sites.org/climatemodeling/page_4_1.php
The NAS says:”Because scientists are able to compare their climate models to both historical and present day data, they are able to validate and improve their efforts over both the long term and the short term. Models are improving all the time. Here are a couple of examples from climate models that show particularly good comparisons with observations for specific weather events:”
Proof doesn’t exist only uncertainty and with that risk (and dealing with that too lies in the eyes of the beholder) but having said that hands up everyone that would build their house where the sea was going to be if they had such a model.
Re: Steven Mosher (Dec 18 18:29),
Interesting that you never answered the equivalent question: what it would take for you to recognize a model as NOT useful.
Steven, I believe you are actually missing the point, because you’re missing the Real Question… (and yes, so are too many policymakers, and media types, etc.) This goes back to our friend Feynman, and also to Yule[1926]. SOMEbody needs to inform policymakers that correlations — even accurately modeled ones — don’t imply cause and effect.
And someone needs to trumpet near and far that just because we want “an actionable answer” does NOT mean we can have one. As my grandma used to say “if wishes were horses, beggars would ride.”
The “answer” is currently being assumed rather than demonstrated. The entire IPCC effort is predicated on the assumption that human action has caused unacceptable warming, and therefore human action can ameliorate it.
I’m willing to accept that this could be true, but today’s models do not assist in accomplishing that task. What is missing — even and particularly in your “perfect” scenario above, is the most important element: cause and effect. A 2C warming prediction is only helpful for a “coping” policy (ie it’s getting warming, get used to it), if we have no idea WHY it is warming.
As Feynman put it so eloguently, scientists bear a special responsibility for honesty — to neither fool themselves nor those they serve. Right now, that’s not happening, and people are imagining that we know — at least in sign if not magnitude — the climate impact of various actions we might take, because of our models.
The reason intelligent scientists and engineers are skeptical is because we see such huge and obviously invalid assumptions being made. If we could validly, scientifically demonstrate cause-and-effect of the various climate drivers on the planet, I would have no reason to be skeptical. (And no, I don’t require perfection.)
The interesting thing to me about correlations: no matter how perfectly a model predicts future results, the model cannot demonstrate cause and effect. The only thing it can do, by failure to predict, is demonstrate a lack of cause-effect relationship understanding. (I say that carefully because while a model may fail to demonstrate an A->B connection, that failure may be due to there being an indirect A->X->B relationship.)
Personally, I find it helpful to look at much of this through virtual “inverting” glasses. Correlations are boring. Lack of correlation is exciting. A hundred models all showing the same thing is boring. An outlier model that (validly) demonstrates something quite different is exciting. Etc etc. What things can be removed from consideration because they wreck the models? That’s exciting. 🙂
My sense: until we have a better understanding, we (the scientific/policy community) need to:
a) Swallow a huge dose of humility, and more proactively appreciate the errors of the past;
b) Invest in better understanding of both human and natural climate drivers;
c) Develop models that allow for the full range of creative (not impossible) forces and feedbacks, particularly including minority perspectives that normally get pushed out of the way by ego;
d) Invest in preparing coping strategies commensurate with the heating and cooling risks that are likely
Steven Mosher said
“There isnt a single skeptic who would change his position, even if models were perfect.not a one.”
Why do you make such statements, Steven? Why do you continually attempt to denigrate skeptics with what you canot possibly know to be true?
Re: Steven Mosher (Dec 18 18:29), Actually I think we are in fundamental disagreement now that I see this post:
Validation
does the software do what was wanted?
“Are we building the right system?”
This is difficult to determine and involves subjective judgments
Verification
does the software meet its specification?
“Are we building the system right?”
This can be objective if the specifications are sufficiently precise.
Verification is atechnical and testing exercise!
As I said above… Also, I believe that Steve was discussing model validation — i.e. does the model do what we want — i.e. make correct predictions whether they are forecast or hindcast predictions.
It is much easier to verify a model than to validate it.
If we cannot agree on the definitions than there is not much to discuss.
You said: How do you validate the model? you test against the spec.. If it meets the spec its valid. Period.
Meeting the spec is verification — i.e. that you programmed the (some) system to do what the spec says. That does not say that the model is correct i.e valid.
Can you decide that we use the standard terminology — or would you rather declare that you are correct and that the rest of us are wrong — make a call and then the debate can move forward. Otherwise there is simply confusion as to what people are saying and agreeing to…
Please. Pretty please…
Cheers!
Mosher:
I think your definition of verification and/or validation is not the same as mine, and it is not being used in the same way climate scientists use the terms.
As I understand it, what you are describing is software assurance – which is related to how software people get paid for their work.
You set out a functional spec with milestones and tests are done to verify that the software has achieved a particular milestone and the programmer gets paid.
That is not the same thing as model verification, which is not the same thing as model validation, which is not the same thing as model confirmation.
As far as I know there is no spec set out for a climate model.
If there is I would sure like to see it – could you please provide a link to one.
“Let me put it entirely differently. Imagine a perfect model that predicted 2C of warming. Imagine that the models were exactly perfect hour by hour inch by inch. Imagine they predicted 2C of warming.
There isnt a single skeptic who would change his position, even if models were perfect.not a one.”
That is false.
I for one would change my position if there were a model that existed that was as accurate as you say, and that same model predicted multiple degrees of warming over coming decades. For me that might change everything. I’m sure there are other skeptics that are similar to me. The fact that the models are so wrong is a big reason for my skepticism (as well as the fact that the science behind the temperature reconstructions is also so evidently wrong).
“The model shall predict sea level rise over a 100 year period.”
Interesting requirement for a scientist to make. Probably honest in its formulation though – for a policy maker wannabe.
Re: Kan (Dec 19 00:14), Kan:
Interesting thought. Maybe we can all agree on a “model validation” test. Let people verify their programs all they wish. Here is what would convince me.
Test One — Hind-cast. Load your model up with everything we know about the year 1914. Let it work it’s way forward demonstrating that it could have predicted the next century in some reasonable fashion as to temperature, El Nino cycles, Ocean Surface temperatures, regional and global temperatures, polar ice extents, and match the beginning of the satellite era as to temperature observations. We can agree on say the one year, two year five year ten year, 25 75 and 100 year (today) marks at least for validation against what we know about those years.
Test two: Forecast — going forward we can agree on shorter time frame testes — say every six months with particular emphasis on the first decade of matching against the model with further particular emphasis after one year, 2.5, 5 year 7.5 year and 10 year marks. By 2024 we will have a convincing validation — or have proved that the models cannot be relied on. (Which it seems is the current state of affairs.)
Again we would need to specify which tests are to be met — but let’s say the gridded temperature models — match the “world” average temperature, the sea surface temperature models , the various ocean cycles, regional sea levels and say polar ice extents as well as the satellite temperature observations. Since those types of specs are most often quoted, if the model cannot provide numbers for comparison — what would be the point?
So there is one simple set of validation test. If a model can do that hind-cast and that set of forecasts I would find that remarkably persuasive.
Otherwise as stated at the the beginning we have unprecedented discrepancies and we can leave it there for now.
Kinda like the Turing test — clear and obvious in concept — if not in execution and design.
Read Mosher’s comments carefully. This oddball requirement was not some loose mistake on his part.
Here is an interesting article on bad models.
The most difficult modelling job I ever had was modelling combat.
why? well there isnt a lot of data. and the next war is always something new and different.
and there was always some guy who said, just use lanchester equations they will get you close enough.
Now, would you guys tell a general that he is not allowed to use bad models as part of his decision support?
Click to access ohanlon-estimating-casualties-iraq.pdf
Generals don’t use that crap, Steven.
That’s a lousy sentiment, don’t you think?
Suppose a GCM showed twice as much warming as we actually see?
How is that useful to a policy maker?
Well, he can use that result to support his decision to do nothing.
Suppose a GCM was perfect in hindcast and predicted 2C of warming?
How is that useful to a policy maker?
Well, he can use that to support a decision to push for more nuclear.
basically, the accuracy or inacuracy of a model, decides nothing. it just is.
Steven, Steven
So you are saying that policy makers could use the GCMs in a kind of Rorschach manner, or whatever.
You keep dancing around the question:
Who suggested that the models were fit for the purpose and what evidence have they presented?
If you don’t know, just say so.
I wonder if the policy makers were given this little ditty:
“basically, the accuracy or inacuracy of a model, decides nothing. it just is.”
Don,
I think what Mosher is getting at is some combination of
1) of course all models will make errors in forecasting, especially in complex systems and
2) everyone that ‘matters’ knows this basic fact and still are keen to selectively ‘marshal’ model output to support their agendas
So a discussion about how ”wrong’ is a model is interesting for the intellectually curious (and those interested in building more accurate models!), but not terribly germane to many ‘end users’.
GD,
How about the germaneness of the models from the perspective of the people who pay big bucks for them and are potential victims of ill-informed policies made by pols and apparatchiks who very likely have not been informed that models are always wrong and that right now there is an unprecedented model discrepancy (keeping it germane).
I will repeat the question:
Who suggested that the models were fit for the purpose and what evidence have they presented?
Mosher won’t answer. Maybe he doesn’t know. Maybe he doesn’t like the question. He is being very pedantic today. Maybe he is mad at McCintyre for pointing out the unprecedented model discrepancy.
I suppose it is different here in the U.S. than in the UK, since not much has been enacted to restrict access to energy here to date.. Public opinion polls show climate change is not a pressing issue here, so all the ‘science communicators’ have not been very successful in their messaging. So I don’t think it would be correct to say the models have been utilized to the detriment of the public.
On the substance of the post, I agree completely that the new pattern of residuals post calibration indicate some source of variation was incorrectly parametrized/failed to be accounted for, and given the large magnitude of deviation from observed temperatures relative to total projected warming, that the forecasts are not valuable.
Finally, Steve Mc, I enjoyed the echoes to the paleoclimate declarations of ‘unprecedented’ in the post. Thanks!
Remember about Mosher and definition:
“Science is what scientists do”
“A scientistis someone who does science”
Modelling is an expectation of the future to help guide investment decisions. Take something like building a high speed rail link – that could cost billions, take 15-25 years (or 50-100 for an entire rail network). Is it worth it? How much do you invest? What routes do you take? The answer is to model potential demand, potential costs and potential risks. The model will be wrong but it gives guidance on the likelihood of different outcomes, sensitivities and crux points.
However you don’t want to overcommit at the start because you might be wrong – the investment decision for a big project is likely to be staged with checkpoints. You plan at the start for everything, but the initial commitment will be for items that either bedrock (everything depends on them), or low hanging fruit – stuff which is relatively easy and low risk. In the climate change world these are renewables, energy saving and pollution reduction and reducing reliance on fuels from politically sensitive parts of the world.
Once these initial tranches of investment are made you re-run and re-check the models with the new data. The likelihoods will have changed. Some outcomes will have become less likely, some more so. You move your investment decisions accordingly. At this stage the investment decisions are also getting harder – you’ve done the easier things, and if the models are moving you would also take even more care over bigger and riskier projects.
In the climate world, more extreme climate change models are looking less likely. At this stage then it makes sense to de-emphasize the extremes (you can’t compensate by saying the extreme will be even bigger) and focus on the models in the most likely range. As the likelihoods shift it therefore makes it more difficult to sustain arguments to solve problems at the extremes or more extreme solutions, perhaps like the more contentious policies like say extreme carbon taxes. But maybe you can still support less easy decisions like nuclear. A judgement has to be made – science doesn’t give the answer.
Then over time you trim and cull the modelling based on the newly accumulating data. As Steve says, at all times you want to know the parameter space – particularly what are the ranges of outcomes for the possibilities of potential upsides and downsides, not just what you think is most likely. It’s not clear how climate science is seeing these likelihoods shifting in the light of experience or whether we just plough on with what we thought was true twenty years ago. For instance we still have another three years until we hit the 30 year mark for Hansen’s 1988 forecasts – do we still plan to these models because as yet we don’t have a full 30 years of data to confirm or refute them statistically?
It’s frustrating because discussions sometimes feel like a furious argument about who will win a cricket match (or baseball match), when the match is being played out at one ball a month and still has 1000+ balls to play.
I couldn’t agree more, but this is just dealing with models in the rationalist’s view of the world. Models also play another role in the more pragmatic world of sales and marketing. They are used to part investors from their hard earned cash and in the case of politics to provide positive things like a rallying point for action to the populous and not so positive, a distraction or rationale for taking control.
It is this latter use that is being discussed here. It would be nice if it were just rational decision making informed by rational science as you describe, but that isn’t the game that’s being played.
Not acknowledging that the game is politics and therefore the weapons of politics (including views expressed on blogs) all have a place has simply filled a large number of column inches while people grope to clear the obscurantist’s fog.
Many of the comments in this thread touch on ethics and what is the proper role of a scientist. Judith Curry posted a discussion on Ethics and Climate Change Policy at ClimateEtc on 12/17. In it she excerpts from and comments on a paper by Dr. Peter Lee with the following lead quote:
“Every aspect of climate change is shaped by ethical dispute: from scientific practice to lobbying and activism and eventually, at national and international levels, the setting and implementation of climate policy. – Peter Lee”
It may be found at http://judithcurry.com/2014/12/17/ethics-and-climate-change-policy/#more-17436
She includes links to Dr. Lee’s full paper which is not paywalled!
Richard Betts
Posted Dec 19, 2014 at 5:18 AM
An assertion isn’t proof.
GCMs down provide predictions we have been told repeatedly. At best they provide projections…nonfalsifiable projections.
They fail at almost every task they are supposed to achieve…regional rainfall patterns…Global atmospheric humidity….oceanic heat patterns…regional and global temperature projections.
In the very post where you declaim that I am wring re: models not being self funded, you conceded that the government funds this enterprise. Yet you persist. as if a grant from the NSF doesn’t come from governmental funds? really?
Dont urinate on my leg and tell that its raining.
I have no patience to play hide the pea with you.
You, as well as anyone who has a smattering of experience modeling physical or economic phenomena knows that the misuse of paleoproxies is so egregious as to be indefensible…yet your grant mining industry continues to defend practices like ex post selection of individual components of proxies, as well the use of proxies for purposes even the creators of the times series in question advise is incorrect.
I had some degree of respect for you posts, as well as your willingness to address questions and concern on this site.
No longer. Dissembling and equivocation are beneath most researchers, apparently though,not all.
Richard Betts,
I would like to thank you for your engagement here, bishop hill and elsewhere – the conversation is improved by the inclusion of your perspective.
Yesterday a friend send me a link to an Enviro Science magazine for engineers
On pages 38-42 there is an article about climate change and infrastructure planning. The authors assert that climate projections are now so reliable and clear that they must be incorporated into local infrastructure design plans. They even quote a lawyer who asserted a possible negligence standard arising from ignoring climate model outputs (emph added):
The whole article is based on the premise that climate model projections are reliable tools for forecasting purposes, and not to use them as such now verges on a form of negligence. People don’t get these ideas out of thin air. The “necessity to act” language filters down from academic users of climate models and is reinforced by slippery IPCC SPM rhetoric about having “very high confidence” in GCMs and even “high confidence” associated with regional projections.
So when major discrepancies appear between GCM projections and the reality they are supposed to be describing, downstream users of climate model outputs are entirely justified in questioning climate models as reliable sources of scientific information. It’s too late at that point for modelers to try to go back and propose some delicately nuanced view about proper and improper uses of climate models, and why they aren’t really supposed to be compared to reality or assessed for forecast accuracy. That ship sailed long ago. Climate modelers are 20 years too late to try to position GCMs as something other than forecasting tools. For whatever reason they let the IPCC speak for them over the years and position GCMs as reliable, policy-relevant forecasting systems. People digested that message and it’s now taken for granted. There’s no avoiding the fact that the growing model-observational discrepancies are going to be interpreted in a way that discredits climate science.
no no no youre completely wrong…GCMs are used to predict regional aspects of climate, things like rainfall patterns and regional ocean temperature anomalies. They provide predictions….until those predictions are challenged by reality…then they morph into projections..
In any case, they only fail to predict these aspects of climate, they also fail to emulate global temperatures (whatever that particular metric really means)
They are the product of self interested, self funded researchers…except to the extant that these guys depend on governmental grants…of course all science depends on governmental grants.
Not only that, we are not told that if we are not policy makers, our opinions mean nothing…That policy makers can (and should, according to mosh?) make their policy decisions on flawed models and information.
Mind bending eh? oh yeah…the kicker…the work product created by these people while employed by public institutions is their proprietary property, and the public has no right to look at it.
Its mind bending really, in its totality.
The hubris, chutzpah…the unmitigated gall and arrogance of the industry is breathtaking.
Richard Betts, I hope that you are reading this. The modeling confraternity is acquiring liabilities, in my estimation. The ignoring of the signal failures of the models and maintainance of the pretense that their product is veritable is irresponsible, in my view.
You have a share in this, in my view.
Down here in NZ there is a legislative requirement to take “into account national guidance and the best available information on the likely effects of climate change” when establishing planning conditions to mitigate coastal hazards.
Our local Parliamentary Commissioner for the Environment (i.e. reports to parliament as a whole, and so is independent of the government of the day) has recently seen fit to state, ostensibly based on IPCC pronouncements, in the media associated with the release of a report on sea level rise: “Sea levels have risen by about 20 centimetres over the last hundred years. In the report, the Commissioner warns a rise of a further 30 centimetres or so by 2050 is now inevitable.”
Chinese whispers based on models causing (high priced) property values on the coasts to decline. I think I see a tipping point in the politics as the elites find they have an interest.
30 cm by 2100 is not an unreasonable estimate.
Particularly if it’s 2081–2100 relative to 1986–2005. No real acceleration – but “inevitable”?
30 cm by 2050 comes to an average of over 8 mm/year. According to AR5 WG1, even the upper end of the range (warmest models) for the highest emissions scenario (RCP8.5) didn’t go there.
Perhaps you have to include the likely collapse of the Antarctic sea ice. Where pretty close so no doubt it will get here first.
This has to be seen in the light of Michael Mann’s talk that climate scientists be forced to adhere to a code of ethics (even as they, as scientists, have no corresponding legally binding code of conduct or statutes).
This is starting to remind me of a real-world story from 25 years ago.
Some contractors were remodeling our home. A Very Authoritative home inspector checked out their work. She adamantly required that we open up some subflooring, and “fix” the way the new water pipes were installed… because she claimed the connections between dissimilar materials had not been properly built. What she claimed was required by The Code: an aluminum strap was needed between all joints connecting dissimilar materials, to avoid galvanic corrosion.
Only problem: the joints were between copper and plastic.
Just because someone makes a policy, and claims to have supporting evidence, doesn’t mean they are correct. And as a “little guy” it can be very hard to push back.
(In my case, I wasted three months collecting evidence on this and other atrocities before her boss finally accepted my statements… ultimately, she publicly melted down and was fired. It was very sad.)
Tom Fuller:
Do you think each ‘pause’ (for lack of a better word) …
Plateau.
Doesn’t try to suggest we know temps will go up again.
From Greg’s site “Greg Laden December 21, 2014
The vast, vast majority of tree ring data can not be used to reconstruct temperature. Most of it simply does not carry that signal. It wasn’t collected to look at temperature, it has other uses, etc. Also, many tree ring sequences look at climate related data other than temperature, and carry virtually no temperature signal as well.
The MWP is real, but it is not what many say it is. It is not global, for example.”
Very funny, but not very interesting? How can he say this and then defend tree ring records?
Posted this at Jo Nova’s as well
Phil Jones’ Index will go up in 2015.
To me, these adjustments are the same kind of “own goal” as the “hidden warming” in the ocean**. When they admit that the natural variablitiy can be large enough to “hide” the human signal, what they’re admitting implicitly is that the “clear” signal they’ve teased (tortured) of the the data is of the same order of magnitude as the noise — and they admit they can’t model the noise.
If you can’t model the noise, you can’t remove it, and thus there’s no way to know that what you’re labelling as signal (human influence) isn’t in fact simply noise (natural variation).
** if the magnitude of energy that can be stored in the oceans is the size of what we assume is a human signal, how do we know that what we see as a human signal doesn’t correlate to a release of the energy in some earlier phase of the ocean energy transport process) — again the “data” is the same size as the “confounding variable”
Self-hypnotized with the aid of supermachines, ticking, ticking in front of the eyes.
==========
If no use can be found for the old stuff, it still holds value and can be auctioned off.
Samsung phones are well known for its eye-catching designs that
include the range of slider phones, folder phones as well as candy bar phones.
It also includes USB and Bluetooth connectivity, document viewer, off-line
mode and Quad-band.
2 Trackbacks
[…] https://climateaudit.org/2014/12/11/unprecedented-model-discrepancy/ […]
[…] writes: Talking of Climate Models, there is another great Climate Audit post titled “Unprecedented” Model Discrepancy where Richard Betts, once again, provides cartoon inspiration in the […]