In today’s post, I’ll return to more typical Climate Audit programming. Upside-down Mann’s mentor, Raymond Bradley, has somewhat surprisingly published an article (Balascio et al 2015) that supports a longstanding Climate Audit criticism of varve proxies. Bradley and coauthors did not report that their interpretation of an important Baffin Island series is upside-down to the orientation used in PAGES2K and numerous AR5 vintage multiproxy reconstructions. It seems that proxies used by the Team are like the Grand Old Duke of York:
And when they were up, they were up,
And when they were down, they were down,
And when they were only half-way up,
They were neither up nor down.
Background
Ever since Mann et al 2008 and Kaufman et al 2009, varve thickness (and similar series) from Arctic lakes have become a staple of multiproxy reconstructions purporting to yield hockey sticks, including PAGES2K and most other AR5 reconstructions. Several varve series are used over-and-over in multiple supposedly “independent” studies, one of which is the Big Round Lake varve series from Baffin Island (Thomas and Briner 2009). The assumption in the varve series used in reconstructions, including PAGES2k (2013) has been that thick varves indicate warm temperatures. I’ve written many critical posts on these supposed “proxies”, beginning, of course, with criticism of Upside Down Mann’s upside down use of the contaminated modern portion of the Tiljander sediment data from Finland (impacted by agricultural runoff). Mann has unrepentantly continued to use this contaminated data, most recently to “reconstruct” ocean currents in the Atlantic. I’ve also written many critical posts on varve series.
A couple of years ago, I noticed that Gifford Miller had interpreted thick varves at a proglacial lake (Hvitarvatn) in Iceland as evidence of expanded glacier activity – an interpretation made particularly convincing by the association of ice-rafted debris in the LIA with thick varves. At the time, I observed that the Big Round Lake (Baffin Island) varve series was closely related to the Hvitarvatn series and that it was implausible to give opposite orientations to two such similar series. The PAGES2K Arctic reconstruction placed the matter at issue once again, since it used varve series from both Hvitarvatn and Big Round Lake, orienting each series so that thick varves were interpreted as “warm” and thin varves as “cold”. The PAGES2K orientation was opposite to that published by Miller et al and, taken literally, implied that Iceland had a Medieval Cold Period followed by a Little Warm Age in the 17-19th centuries. In my original review of PAGES2K, I pointed out the inconsistency between the original Miller et al interpretation and the PAGES2K orientation.
Last year, following a dubious practice pioneered by Mann, two PAGES2K authors (Kaufman and McKay) published an article in a different journal which conceded errors in the original Arctic2K reconstruction, while refusing to publish a corrigendum to the original article. One of their admissions was that they had used the Hvitarvatn series upside down. When the reconstruction was re-calculated with Hvitarvatn in the opposite orientation, there was a major impact on the Arctic reconstruction, undermining some of the headline assertions about 20th century uniqueness. (I formally asked Nature to require PAGES2K to publish a corrigendum, but they refused.)
In my review of McKay and Kaufman 2014, I pointed out that PAGES2K now had opposite orientations for the Hvitarvatn (Iceland) and Big Round Lake (Baffin Island) series, even though the series were very similar in appearance and clearly required consistent interpretation. I argued as follows (not that I expected Kaufman to concede the point) :
This confirmation of my interpretation is of considerable interest to me, since there seems to be a close relationship between the Iceland varve series and Baffin Island varve series, a location of considerable interest from a multiproxy perspective, as discussed in a previous post here, where I showed the close relationship between the Hvitarvatn, Iceland varve thickness series and the Big Round Lake, Baffin Island varve thickness as below. PAGES2K is in the awkward position of orienting the Hvitarvatn in an opposite orientation to their orientation of Big Round Lake, though the two series are evidently responding similarly. It is surely unacceptable for assessment-quality studies to leave such inconsistencies unresolved.
I also observed that inversion of the Big Round Lake series to match the Hvitarvatn would invert the series in numerous AR5 reconstructions.
Balascio et al 2015
Balascio et al 2015, of which Bradley is a coauthor, is an interesting technical study of a proglacial lake in Greenland (Lake Kulusuk). Similarly to the interpretation of other proglacial lakes, they interpreted high mineral content in the sediments as evidence of glacier advance and high organic content as evidence of glacial recession. At Lake Kulusuk, they (plausibly) interpreted the low magnetic susceptibility and high organic content in the Holocene Optimum (HTM – yellow) as evidence of glacier recession. They also carried out a high-resolution xray fluorescence analysis (XRF) and found that the mineral suite was highly correlated to magnetic/organic content, as clearly seen by its PC1, which had a very distinct Holocene Optimum as shown in their figure excerpted below:

Figure 1. From Balascio et al 2015.
Balascio et al directly compared the data from their proglacial lake in Greenland to the proglacial lakes in Iceland (Hvitarvatn) and Baffin Island (Big Round Lake) that had been previously compared in CA posts. Rather than interpreting the two series in opposite orientations, as in PAGES2K, they plausibly explained results in terms of common climate changes in the North Atlantic from the Medieval period to the Little Ice Age::
Kulusuk glaciers increased in size ca. AD 1250-1300 and again ca. AD 1350 and AD 1450, precisely when ice caps on Baffin Island (Miller et al., 2012) and Iceland (Larsen et al., 2011) were expanding (Fig. 4). After AD 1450 Kulusuk glaciers continued to expand, as did Langjökull [Hvitarvatn] on Iceland, while evidence from the Baffin ice caps indicates continuous ice cover (Miller et al., 2012). Both Kulusuk and Langjökull glaciers appear to have advanced in two phases, at ca. AD 1450-1630 and ca. AD 1700-1930. Varve thickness and magnetic susceptibility data from a proglacial lake [Big Round] on Baffin Island, if interpreted to reflect glacier size, also reveal two similar distinct glacier advances at these times (Fig. 4) as well as the earlier advance ca. AD 1250-1300 also observed in the Kulusuk record (Thomas and Briner, 2009; Thomas et al., 2010). Taken together, these data are consistent with records from around Greenland that suggest the most extensive glacier advances since the early Holocene occurred between AD 1250-1900, and provide evidence for regionally coherent cooling phases during the Little Ice Age (Grove, 2001).
Balascio et al Figure 5 illustrated this comparison, including direct comparison of the varve thickness series from Hvitarvatn, Iceland (Langjokull) (panel D below) and Big Round Lake, Baffin Iceland (panel B below), to Kulusuk (panel A not shown in excerpt below). In accordance with Gifford Miller’s interpretation that has been supported at CA, Balascio et al interpreted thick varves in Iceland and Baffin Island evidence of increased glacier/icecap size. 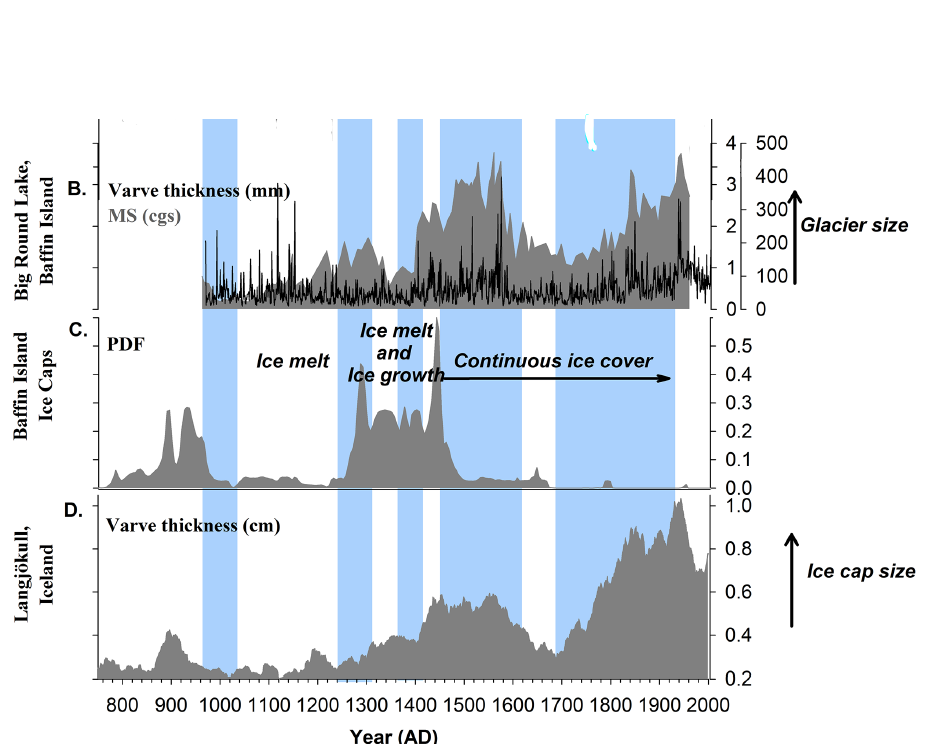 Figure 2. Balascio et al Figure 5 Original Caption: … (b) Big Round Lake, Baffin Island, varve thickness and magnetic susceptibility (Thomas and Briner, 2009). (c) Baffin Island ice cap activity reconstructed using vegetation kill dates with text showing original interpretations (Miller et al., 2012). (d) Langjökull ice cap, Iceland based on varve thickness from Lake Hvítárvatn (Larsen et al., 2011). Blue shading marks periods of increased glacier size (sustained above average PC1
The above comparison us identical to the comparison shown at CA here, also comparing Hvitarvatn and Big Round varves in consistent orientation with thick varves interpreted as evidence of glacier advance:

Figure 3. From Climate Audit here. Varve thickness (mm). Purple – Hvítárvatn from Miller et al 2012 Figure 2D; blue – Big Round Lake (NCDC sheet 7 column 4) 30-year running mean. Both shown on same mm scale. See here. Hvitarvatn matches panel D of Balascio et al, while Big Round matches panel B.
Discussion
It is gratifying that Bradley agrees with the interpretation of these two series that had been previously advanced at Climate Audit, though, like Kaufman, there is no acknowledgement. Unfortunately Bradley and coauthors did not discuss the implications of their interpretation on PAGES2K and other multiproxy studies using the Big Round Lake varve series – including: Kaufman et al 2009, Ljungqvist 2010, Christiansen and Ljungqvist 2011, Feng et al 2011, Christiansen and Ljungqvist 2012, Ljungqvist et al 2012, Shi et al 2014, Tingley and Huybers 2013 plus PAGES2K- all of which used the Big Round series upside-down according to the interpretation set out by Bradley and coauthors in Balascio et al.
Adoption of the orientation of Big Round varve data used in Balascio et al 2015 ought to require fresh interpretation of all the varve thickness series used in PAGES2K and other multiproxy reconstructions. It would then be third varved series which had been conceded to have been used upside down. A bit of a habit.
The Grand Old Duke of York
Bradley was a coauthor of Kaufman et al 2009 which used the Big Round series in the opposite orientation to the one adopted in Balascio et al 2015. However, there’s little reason to expect that Bradley would be troubled by using the same data in opposite orientation in two different papers. CA readers will recall that Bradley, as a coauthor of Kaufman et al 2009 acknowledged in a corrigendum that they had used contaminated Korttajarvi upside down and issued a correction to their series, but as coauthor of Mann et al 2008, Bradley denied that they had used contaminated data, let alone upside down.
I guess that we can say that, in Bradley’s hands, proxies are like the Grand Old Duke of York in the nursery rhyme:
And when they were up, they were up,
And when they were down, they were down,
And when they were only half-way up,
They were neither up nor down.


69 Comments
You know, most days I’d find this funny, but today, such scientific dishonesty just disgusts me. Thanks for highlighting the depressing depths of chicanery that Bradley and his ilk are more than willing to plumb. They are corrupt to the bone. True, it is Noble Cause Corruptions, but it is corruption nonetheless. The damage these miscreants are doing to science is incalculable.
Good detective work as always, Steve.
w.
Steve: Balascio et al 2015 itself seems like a workmanlike and sensible article shedding useful light on the Holocene. It’s the data snooping in the earlier articles that is at issue.
I’m unfamiliar with the term ‘data snooping’.
I can’t be the only person so ignorant. Could either of you gentlemen please help me out?
PS, I’m a great fan of the work of each of you.
https://en.wikipedia.org/wiki/Data_dredging
Thanks, jeez. Leo, unlike jeez (and wikipedia) I distinguish between data dredging and data snooping. Data dredging is looking through lots of subsets of lots of datasets for “significant” correlations. It’s quite avoidable, or you can do it and use the Bonferroni correction to the significance levels.
Data snooping, as I use the term, is quite different. It means designing your analysis around, and perhaps to evade, the specific peculiarities of your data. It is more pernicious in part because the boundaries are nowhere near as well defined as with data dredging. For me, the boundaries are kinda like with taxes—it’s legal to avoid taxes, but it’s not legal to evade taxes. So I have to look at the data to do everything from quality control to choice of analysis methods … but I can’t use that knowledge to misrepresent or distort the results.
To avoid data snooping in the context of paleoclimate, one thing you need are clear and well-justified ex-ante criteria for your inclusion/exclusion of both individual proxies and classes of proxies. And in particular, you can’t use the outcomes to select between proxies. By that I mean, you don’t get to look at a proxy, see if it moves the way that fits your theory, and exclude it if it doesn’t fit. Sounds crazy, I know, but they do that in tree ring analysis under the rubric that they are just finding the trees that are ‘responsive to the climate’ … riiiiight.
At least that’s how I use the term “data snooping”, but because it’s used above by our good host, I’d like to hear Steve’s definition.
w.
Steve: one large problem in this field is the re-use of data with known properties e.g. Graybill bristlecone chronologies. But re-using the same datasets cannot yield fresh insight.
Thanks jeez, Willis, and Steve.
I have a rule of thumb, that when meeting an unfamiliar term or claim, I should Google it first and not trouble the author. If I can’t verify it, clarify it, or find reference to it on the first page of Google, then it’s reasonable to ask. I mention that to share the rule, not because this post is all about me, except to say “Arrgh I’ve embarrassed myself”. I did not abide by that rule in this instance for reasons that turn out to be.. well, stupidity. The first page of results I get is ALL about data snooping as Steve is using it.
The link jeeze gave is probably the best.
What Wikipedia says is:
“The process of data [snooping] involves … testing huge numbers of hypotheses about a single data set … Conventional tests of statistical significance are based on the probability that an observation arose by chance, and necessarily accept some risk of mistaken test results, called the significance. When large numbers of tests are performed, some produce false results,… by chance alone. When enough hypotheses are tested, it is virtually certain that some falsely appear statistically significant…”
If you haven’t already seen Randall Munroe’s comment on the problem, you’ll probably enjoy it: https://xkcd.com/882/
We sang that song a bit differently back in the Boy Scouts in California many years ago… I am submitting both versions to Mark Steyn for adjudication. However, the lyrics are not so far apart as to be labeled inverted.
Probably it is my fault, but repeatedly I ask myself, after reading papers like these, “Where is the original data, preferably graphed for busy people to take in easily, that relates the two main parameters, in these cases (say) varve thicknesses and ambient historic temperatures? There are more often cases where third party proxies are inserted, like ice area as a proxy for temperature, or similar, but all too often one is left with a sense that the relations are so weak that some third party camouflage is needed to make the story spin.
In these cases above, one or more (mixed) magnetic property is a parameter drawn from thin air to proxy for sediment accumulation rates. As one who has rubbed shoulders with eminent and successful magnetometry geophysicists for decades, I could invent various hearsay stories that would make or break this type of assumption. In simple words, I’ve learned enough to get myself into trouble by synthesis of plausible cases that give results that could be heads or tails depending on what was wanted.
Apart from the insecurity and loss of resolution from the use of stacked sequential proxies instead of primary data, there is scientific insult by the lack of correct or even plausible carry through of error terms. There seldom seems to be enough stringent error analysis, let alone rough error analysis, to support assumptions commonly made in these fields of proxy work. Often, one closes the journal with the final thought, “Quite so. But is it no more than noise?”
On many types of earth science data I can make the noise go up when it is needed to go up, down when down, following the Duke of York verse that I memorised and enjoyed long before I encountered science. (Which in turn was well before last year).
Steve, we have a sorry state when Balascio et al here is commended for having some less bad properties than some comparison papers.
Credits are best given for absolutely outstanding research, not for marginally better mediocre work.
“there is scientific insult by the lack of correct or even plausible carry through of error terms.”
Dead on, Geoff. The entire consensus field lives on that neglect.
Iceberg Lake AK and it’s “missing” MWP and conflicting varve “cores” needs a rethink too based on a possible inverted temperature to varve thickness in the early part of the record.
“The data provide a longer-term perspective on the rate of 20th century glacier retreat and indicate that
recent anthropogenic-driven warming has already impacted the regional cryosphere in a manner outside the natural range of Holocene variability”
Is it true or not???
This is an excellent question. Nearly all of my examination of proxies over the past two years – work that is mostly in inventory – has been from a Holocene perspective, trying to answer this question. My own single sentence takeaway – though it takes a huge amount of work to support – is that NH glacier expansion in the Little Ice Age was at its greatest extent since the Last Glacial Maximum. Even after 20th century recession, NH glaciers remain very expanded relative to retraction in the Holocene Optimum. The phrase that you have to watch here is “natural range”. NH summer insolation has decreased dramatically since the Holocene Optimum. We are arguably getting to the point in a precession cycle when NH glaciers ought to be expanding irreversibly. I think that there’s a case that the increase in 20th century NH summer temperatures is counter to that trend (and to that extent “outside the natural range” of variability), but I also think that there’s an interesting question (one that has seldom been discussed) about whether an effect that somewhat combats the Milankowitch influence is something to be discouraged. Framing the question in this way is not the same thing as Hockey Stick theory.
Let me illustrate the point with a diagram of (small) glacier equilibrium lines in Svalbard from Rothe et al 2015 (edited here so that up corresponds to warmer temperatures) that I find convincing (and which I’ve been planning to discuss in more length). The temperature-sensitive glacier equilibrium line has retreated in the 20th century but is still far below lines earlier in the Holocene. This diagram doesn’t even fully state the Holocene Optimum retreat as it does not go back that far as the glacier had retreated outside the range of the proglacial lake.

Steve Re: “We are arguably getting to the point in a precession cycle when NH glaciers ought to be expanding irreversibly.”
Your figure shows strong COOLING for the last 4000 years interspersed with Minoan, Roman and Medieval warm periods.
How much “global warming” (aka politically incorrect “climate change”) do we need to generate to prevent “irreversible” glacier expansion through Chicago and Indianapolis?
The higher the sensitivity, the colder we would now be without man’s input.
=============
Exxon is thinking a little gratitude would be nice.
I think it is pretty clear that any conclusion about where we ‘ought’ to be in the ice age is easily discounted by the variance of the warm periods in the historic record. I only wish we had such influence.
The proxy record doesn’t have the temporal resolution to show our observed increase in summer temperatures. You can do a statistically similar trend and add our observed warming to it and you will see nothing. We have no info which can allow us to make even basic assumptions about observed warming vs history.
“I think that there’s a case that the increase in 20th century NH summer temperatures is counter to that trend ”
This is what I am referencing. There has been no evidence presented on this blog or any other which makes or even moderately supports that statement, which assumes by its nature, a near-monotonic decrease to an ice age. An expectation of CO2 warming does not justify anticipation of an ice age. The oceanic circulation can absorb every ounce of what we do with the worst case CO2 warming without our instruments even noticing the effect. It is statistically below their capacity. It is an easy logic trap to fall into, please consider it carefully.
Hi, Jeff. I was thinking that the nursery rhyme also summarized Mannian principal components and ex post screening:
The Grand Old Duke of York
He made twelve hundred picks
And when they were up, they were up
And when they were down, they were up
And when it was all said and done
He had his hockey sticks.
There are a lot of reasons why this is the best climate blog on the internet. Well one really and that is the author.
What I was trying to write, so poorly, is that the trap we fall into is that the influence we have on warming isn’t statistically separable from the huge variance observed in nature. It is fun to think about which influence what we might have, or what portion is natural, and the trap of assumption that we “caused it” is almost seductive.
I wish we could cause warming because we are truly going to need to be able to in the next few thousand years.
“The phrase that you have to watch here is “natural range”. NH summer insolation has decreased dramatically since the Holocene Optimum. We are arguably getting to the point in a precession cycle when NH glaciers ought to be expanding irreversibly.
[RW] The orbital only comparison between MCA and LIA shows that even over the shorter time period insolation variations can affect regional patterns
: http://www.cgd.ucar.edu/ccr/ottobli/pubs/CESM-LME_BAMS_submit-15Feb2015.pdf
[RW] The general argument is that since the Neoglacial there have been period warm and cold periods in the high latitudes but generally summer temperatures have been declining with glacier expansion being a general phenomenon. At high latitudes (Canadian Arctic, Svalbard etc…) glacier expansion was at its greatest since the hypsithermal in the late 1800s to early 1900s.
“I think that there’s a case that the increase in 20th century NH summer temperatures is counter to that trend (and to that extent “outside the natural range” of variability)”
[RW] Given what we are seeing from ice cores and dating of exposed plants in the Canadian Arctic and elsewhere it would be safe to say that the recent melt rates are incredibly anomalous over the Neoglacial and compare to during the hypsithermal when insolation was far greater. Expect to hear more on this in the coming months. To go from the greatest glacier expansion over the Neoglacial to the greatest Neoglacial glacier decline in a relatively short period does require quite the explanation without external influences.
“but I also think that there’s an interesting question (one that has seldom been discussed) about whether an effect that somewhat combats the Milankowitch influence is something to be discouraged.”
[RW] Certainly a worthwhile question but the question is one of magnitude. There are entire ice caps covering hundreds of km2 in the Canadian Arctic which are below their regional ELA over the past decade indicating they will disappear even if current melt rates are maintained. I could certainly see an argument that combating Milankovich forcing has some upside but there is a difference between maintaining a stable climate and pushing it towards deglacierization.
These are all great points. Ice melting is a great concern as it has the potential for leveraged positive feedbacks both known and unknown.
The key question is what are the primary causes of glacial melting beginning in 1850? Is it a natural cycle followed by a CO2 enhancement? Is it coal derived Black carbon and other particulates (including the cooling SO4 rains down) as is well documented in Alpine studies followed by a natural cycle? There are other possible combinations of causes. My own prejudice thinks particulates plays the greatest role in glacial melting as implied by the dust spikes prior to DO events and the mega-dust spike prior to catastrophic Continental ice sheet collapse.
This matters because we may end up spending a fortune on an ineffective solution that does not have any other documented ill effects (CO2) rather than reducing toxic air pollution that kills millions right now that may in fact be the primary or at least a co-first order mechanism for ice melting. If it’s all natural and we cleanup air pollution, the effort was not for naught.
Just so readers understand my point about NH summer insolation and the Last Glacial Maximum, here is a graph showing JJA insolation at 50 and 60 N from 60000BP to 20000 years into the future, insolation which, according to widely accepted Milankowitch theory, controls the waxing and waning of continental ice sheets. Present NH high-latitude insolation is at the lowest since the deep LGM.
This used to be of concern to climate scientists about 50 years ago, but it appears to be a consensus that the reduced JJA insolation of the present cycle is not reduced enough to be troublesome. Trying to understand why the present low high=latitude NH JJA insolation reduction is not a basis of worry is something that interests many people when they first take an interest in climate, including me. Early on, I unsuccessfully tried to understand why the impact of low JJA insolation in the LGM was seemingly so different. Science of Doom has written a really excellent series of posts on orbital phenomena, seemingly coming to the conclusion that there is very unequal support for various propositions in the field, with some aspects seemingly relying on armwaving.
If high-latitude NH JJA insolation is as prominent a driver of ice ages as apparently believed by the consensus, I’ve always been a little baffled as to why the climate community is seemingly so sanguine about the expected 3000 years of low JJA 50-60N insolation. The lack of interest and concern is very marked in AR5 which, instead of showing 50-60N JJA insolation, the parameter of interest in Milankowitch theory, shows 20S and 20N insolation, which offset and which give a rhetorical impression that orbital changes are of little import.
Thanks for the comments on Milankovich, Steve. One of your earlier comments on the subject led to a post of mine on regarding Milankovich called “Into And Out Of The Icebox”. It’s still all quite puzzling to me, so I look forward to your further discussion of the question.
w.
Willis, I’m not going to venture into the forests of Milankowitch theory. If you haven’t read Science of Doom’s series, I strongly urge you to do so.
Rather than getting lost in such matters, my inventory of work on the Holocene is nearly all on proxy information on what we actually know. In a sense, it will be an extended commentary on Marcott et al 2013, the recent portion of which was, as discussed here, wildly deceptive and, in any responsible discipline, would have been corrected or retracted.
The other point of interest to me at present – which Robert Way picked up on – is that 60N JJA insolation is very low and, according to Milankowitch theory, further declines, such as will be coming over the next 1500 years, would increase glaciation, though the quantum remains uncertain, and anthropogenic forcing that counterbalances or even somewhat reverses this is not obviously a “bad” thing – a position that Guy Callendar would undoubtedly hold.
Robert’s position is that it’s a matter of quantity and complete deglaciation is not something to be wished for. My own take on the proxy evidence in Holocene context is that the present increase as measured by proxy information on glacier equilibrium lines is not “loud” in Holocene terms, but Robert thinks otherwise. One of the problems in reaching common ground is the contamination of the proxy literature by studies relying on things like upside-down Tiljander, upside down varve thickness series, bristlecones, all of which have the effect of making 20th century change seem very anomalous.
Robert says:
Robert, I’ve been looking at Holocene data for a couple of years now – mostly work in inventory – trying to see whether recent proxy data is escaping the bounds of the Holocene. Relative to the Holocene Optimum, it seems to me that any recent increases still leave us in the Neoglacial, though,as noted before, there’s a plausible case that it is less cold than it might otherwise have been. But the “signal” doesn’t look nearly as loud to me as you are advertising. Also, if the change was as loud as you seem to be expecting to announce over the next few months, one wonders why it hasn’t already been reported in the literature.
BTW, I couldn’t help checking “hide the decline” in the spaghetti graph in your citation. This climate science tradition is preserved: yet another climate science spaghetti graph withheld the late 20th century decline of the Briffa et al (2001) reconstruction. Stubborn bunch.
I confirm Steve M’s observation. Briffa 2001 is improperly truncated at about 1960 in Figure 3 of the manuscript submitted by Bette L. Otto-Bliesner, Esther C. Brady, John Fasullo, Alexandra Jahn, Laura Landrum, Samantha Stevenson, Nan Rosenbloom, Andrew Mai, and Gary Strand, cited in Robert Way’s post.
The same Figure 3 incredibly offers MBH1999 as a valid proxy as well, bristlecones and all. Stubborn bunch, indeed.
No et al., for the author list, by the way, because I wanted introduce everyone to some folks who think truncations and tendentious contaminations of data are valid scientific practice.
Pat Frank,
Thank you for the complete list of authors.
Regarding high latitude NH JJA isolation, this does not explain the simultaneous and global cooling of the ice age. Even in the tropics and subtropics snowlines were thousands of feet lower, compared to today. Note that total worldwide insolation does not fluctuate with the Mvitch cycles. I am not so sure that there is a “consensus” among glaciologists on the Mvitch hypothesis.
Currently unavailable for the next day or so but for Steve’s interest there is an interesting Holocene paper from Gajewski (2015) in Global and Planetary Change.
Click to access Arctic_recon.pdf
Robert, shall we assume that the story about these incredibly anomalous melt rates will be revealed in a PR blitz, just before the big Paris climate junket?
Robert Way,
Thank you for the links. Always, always appreciated.
Re: Deglaciation. 1. Is it us or not? 2. Is it bad or good?
More answers, better questions.
===================
And now, a view of the things which are not temperature….
My reinterpretation. At least they are of a sign which passes the obvious test of common sense.
Steve, “It is gratifying that Bradley agrees with the interpretation of these two series that had been previously advanced at Climate Audit, though, like Kaufman, there is no acknowledgement.”
They can get away with ignoring you mostly because you haven’t published your work, Steve. I believe you have already established sufficient credibility that these people could not prevent you being published by the usual recourse of spuriously negative manuscript reviews.
Here’s a second for formal publication of more of your work, Steve.
Yeah, it’s a major PITA. But I think you could outsource a lot of the pain. Prof. Curry (and/or other sympathetic acamedics) likely could supply grad students who’d be happy to do the grunt work in exchange for junior author credit. Please give it some thought.
I’d offer to help but…. my last academic publication was when I was an undergraduate, just about 50 years ago….
Wegman’s experience suggests the danger of outsourcing even routine drafts.
My guess is that Steve’s experience with O’Donnell et al 2010 probably left a bad taste in his mouth for publishing. Hostile reviewers can tie you up in knots and take you places you don’t want to go. Although in this case, Steve might not expect that his “in inventory” work would necessarily be reviewed by a hostile team.
Now why would SM want to sully his sterling reputation by publishing in such journals of ill repute as Science or Nature? Their peer review consists of pea-shooters compared to this one man wrecking ball. No website is more aptly named than this one. –AGF
I was puzzled on reading that they used PC1 of the XRF data. I know something about XRF, and don’t see any intrinsic need to use PCA to extract variational shapes from a very straight-forward physical method.
After reading that part of the paper, I’m still puzzled.
To determine total mineral content, as they stated they wanted to do, (“Rather than relying on a single element (e.g., Ti), we used principal component analysis (PCA) to define the leading mode of variability (PC1) among the elemental data“), why not just integrate the total intensity of each scan?
Total integrated intensity is proportional to total mineral content.
XRF noise is mostly iid random, so even just summing across a scan to give crude intensity should remove much of the noise jitter.
So I don’t really get it. Geoff might know, though.
Steve: the major contrast in the Holocene Optimum relative to LGM and Neoglacial is the proportion of organics to minerals. You therefore want opposite signs for elements associated with organics and elements associated with mineral matter. The PC1 is just a weighted average of the readings in which negative values are allowed. The XRF data is available at considerably higher resolution than the pct organic or pct mineral and, in my opinion, the XRF PC1 “looks” sensible to me. There are many circumstances in which a PC1 makes sense as an index and I think that this is one of them.
Another proglacial lake for which a PC1 was calculated is at Nerfloen, Norway, for which a suite of data is online ftp://ftp.ncdc.noaa.gov/pub/data/paleo/paleolimnology/europe/norway/nerfloen2012.xls
I think that the data from proglacial lakes provides convincing insight into changes through the Holocene.
They measured K, Ca, Ti, Mn, Fe, Zn, Rb, and Sr, which are all metals associated with minerals, not organics. Organics would be sulfur (that’s sulphur to you 🙂 ), phosphorous, and perhaps carbon if they could measure in a vacuum.
They also used a 30 kV probe, which means they measured the K-alpha lines of the elements. This is the easiest to work with because intrinsic intensity changes least across the series. That means, to first order, intensities are directly proportional to concentrations.
If they’d wanted to make a better visual correspondence with other data by inverting the XRF intensity, why not just do it?
I agree that the PC1 “looks reasonable,” but don’t see any reason to use it. Why take real data that has real physical meaning, and use PCA to get an EOF of more obscure meaning?
I’m not saying there’s something suspicious here. I just don’t see a rationale for their choice.
Here’s what Vasskog 2012, et al (the Nerfloen, Norway data at your ftp link) say about their PCA:
“Principal Component Analysis (PCA) is employed to detect patterns of variability that are shared between the investigated lake sediment variables. The PCA includes primary count rates of Fe, Rb, Mn, Sr, Zr, and the K/Ti ratio, six grain-size classes as compositional percentages, and physical sediment variables LOI, DBD, and XBulk, resulting in a final data set containing 15 different variables, with a stratigraphical resolution of one centimeter. The first PCA explains 77% of the total variability of the data set.”
They combined XRF with at least five other kinds of mineralogical data, and ran PCA on the gemisch. I can see running PCA on that, because they’ve muddied the clear physical meaning of each set of data by mixing them together. PC1 says something about minerals, but exactly what I couldn’t guess. Maybe Geoff knows.
On the other hand, Balascio 2015, & co., don’t mention mixing other mineralogical data into their XRF intensities before running PCA. So, there’s no need to extract a PC1 of obscure meaning, from data of muddied meaning.
So, I still don’t see the rationale.
A little off topic to be sure, but if it is Sulfur not Sulphur, shouldn’t it be fosforous Pat ?
That’s pretty funny, Ed, 🙂 but logical or not it’s beyond my competence. I’m afraid you’ll have to take it up with Samuel Johnson’s ghost.
Better yet IUPAC See So Long Sulphur
Given that the ice rafting shown in Figure 4 seems to be at a maximum during the HTM, the later correlation between ice rafting and glacial advance (which only seems to involve two adjacent peaks at 3.2 and 2.8 ka bp anyway) is somewhat underwhelming.
“The oscillatory and stepwise increase in minerogenic input (decrease in organic matter content) after 4.1 ka suggests that rather than advancing steadily toward their historical extent, the Kulusuk glaciers episodically advanced and retreated at centennial timescales until ca. 1.3 ka.”
Without strong correlation to other locations, which I frankly do not see when looking at the graphs despite claims to the contrary, invocation of a jokulhlaup cycle seems just as reasonable to me. Did the Lake Kulusuk glacier really not experience a jokulhlaup in the last 8 thousand years?
Pat Frank at 4:55
It’s already been taken up – by the International Union of Pure and Applied Chemistry (IUPAC) which is responsible for chemical nomenclature.
They have already decided that it should be sul-F-ur and NOT sul-PH-ur in technical documentation. This has been accepted by those most attached to the spelling i.e. the British. It also applies to derived terms such as what used to be sulphide, sulphite and sulphate.
At the same time, the IUPAC decided that the shiny, light metal with an atomic number of 13 should be called alum-IN-ium, not alum-inum. This has NOT been accepted by those most attached to the spelling i.e. the USA!
Ed Snack
Fosforous has not replaced Phosphorous!
That all settles Ed’s attempt at phun! 🙂 Thanks, all.
As one who works in the industry, I can tell you that “Aluminum” is much more widely in almost all countries (outside of the UK) around the world. Case in point: This week I am participating in a trade show: “Aluminum Shanghai 2015”.
There is no “I” in “team” and there is only one “I” in aluminum.
Alan,
Do you mean alu-MIN-ium?
In one of Bill Bryson’s books (either A Really Short History of Nearly Everything or At Home) he explains that the British pronouciation of Aluminum was an attempt to make the naming of the elements more homogenized: Hel-ium, Lith-ium, Beryll-ium, Sod-ium, Magnes-ium, Copper, etc.
Wait a minute, not Copper…
“Are you copper bottoming ’em, my man?”
“No ma’am, I’m aluminiuming ’em, ma’am.”
Say that while simultaneously patting your head with one hand and rubbing your tummy with the other.
Alumin(i)um?
Tom Lehrer’s Elements Song goes to the tune of “A modern major-general” (‘Pirates of Penzance’, G&S) and starts:
“There’s antimony, arsenic, aluminum, selenium
And hydrogen and oxygen and nitrogen and rhenium”
It is quoted in full in the Oxford Dictionary of Scientific Quotations (OUP, 2005, p375). However, the first line was changed, in accordance with the house style of the Oxford University Press, to read:
“There’s antimony, arsenic, aluminium, selenium”
completely destroying the elegantly crafted rhythm.
Lehrer continued: “These are the only ones of which the news has come to Harvard…”
Apparently news of the discovery of aluminium hadn’t reached our shores by 1959.
> I’ll return to more typical Climate Audit programming.
Not so fast. Walt Anderson likes to sign his footballs, THE DUKE.
Paradoxically, you can have two cases that are widely different that both show thin varve thicknesses: case 1 is the full glacier up close to the lake with minimal melting in summer due to cool summers, and case two, a prolonged period of hot temperatures that have melted the glacier and it has significantly retreated from the lake. Temperature too high and climate too dry for much organic growth, little to no run-off of water from the glacier or possibly the glacier is so far away that run-off doesn’t make it to the lake. Thus, thin varves with low organic matter can be either really cold or really hot. Thick varves to me means a large glacier nearby which is evidence of prolonged recent cold temps, followed by present warming; lots of gushing rivelets pushing sediment into the lake. Warm temps and water lead to lots of organics.
Off topic, apropos of nothing and in the weather is not climate category…
Environment Canada has not recorded a totally arbitrary temperature of 30°C or higher at the Toronto International Airport urban heat island so far this year. This has happened only once since 1938, in 1996.
Delete as necessary.
Steve: Toronto has sure had a cold winter, cool spring and cool summer. A friend’s wife from northern Ontario says that none of her vegetables are growing this year.
Steve I was wondering whether you have seen this Calvo et al 2007 study?
It is an alkenone based study of SST temps from southern Australia over the last 30,000 years. It finds that there has been a drop in SST over the last 7,000 years and seems to agree with other studies from inland Australia like Miller et al 1997. Many graphs etc.
Click to access 12.pdf
The paper is in discussion, which means it is in limbo. If it does not get past this stage, and actually published, it will never be cited by any respected scientist.
Given my experience with EGU journals, having highlighted the paper here may guarantee it will never get past the discussion stage.
Let’s see if that prediction holds.
In a science prone to junk-drawer-heaps of assumptions it would be great to see a focus on validating proxies and exploring each’s Achilles heel and disclaimers. Even better would be the calibration of two proxies where both can be found together. Are there any tree-mometers near these lake-mometers? The XRF twist is a nice first step but it needs to be of many locations to give indication of flow distance from glacier.
Until the uncertainty of what varve thickness indicates is fully cleared up perhaps the eager scientists should slow down on the conclusions. After all, hundreds of thousands of activist and leaders are waiting faithfully for whatever they declare (and we would not want to mislead).
Robert Way,
In reading the Gajewski paper, “Quantitative reconstruction of Holocene temperature across the Canadian Arctic and Greenland”, it appears once again paleoclimatology is at odds with anthropology and archeology.
In particular Figure 2 Regional average time series mean July temperature for the Canadian Arctic Archipelago and Greenland, suggests very stable July temperatures in the Eastern Arctic and North Greenland regions for the last 2,000 years.
According to the Anthropology Department at the University of Waterloo, the Thule culture “…represented a new kind of adaptation to the Arctic environment, based on the hunting of large sea mammals in open water through the use of drag floats attached to the harpoon line.” It seems to me the period July to September would represent the best opportunities for open water hunting.
“This kind of adaptation developed around Bering Strait but it spread, primarily though migration, to encompass practically the entire Arctic region by A.D. 1000. In the Canadian Arctic the Thule people replaced the Dorset culture in a poorly understood fashion. Climatic deterioration following the thirteenth century is widely credited with causing the Thule people to modify their way of life into the way of life of the various Historic Inuit groups.”
http://anthropology.uwaterloo.ca/ArcticArchStuff/thule.html
A thirteenth century climate deterioration does not seem to appear in the Gajewski paper.
It is “nice” to see now that both Wikipedia and the Canadian Encyclopedia have changed their entries on the Thule Culture that one upon a time said something like the Thule Culture spread eastward across the Canadian Archipelago as the climate warmed 1,000 y.a.
There is also evidence that the pre-existing Dorset Culture was not displaced by the Thule Culture but disappeared about 300 years before the Thule started colonizing the regions: T. Max Freisen, Contemporaneity of Dorset and Thule Cultures in North American Arctic: New Radiocarbon Dates from Victoria, Nunavut, 2004. He reports the Dorset Culture died out 800 AD which is oddly coincidental with the dark Ages in Europe, but unnoticeable in Gajewski’s temperature trends.
I find this to be a fascinating puzzle.
And just for fun, I note that Gajewski reports that for the last 1,000 years or so the South Greenland July temperatures were on the order of 7.8 ± 0.7°C (eyeball approximation).
Meanwhile the GISS Station record for Angmagssalik (1895 to 2015) suggests July temperatures there were on average 6.6 ± 1.8°C, the warmest July being 8.8°C in 2003 and the coolest being 4.5°C in 1983.
The GISS Station record for Godthab Nuuk (1880 to 2015) suggests July temperatures there were on average 6.0 ± 1.1°C, the warmest July being 8.3°C in 1948 and the coolest being 4.5°C in 1898.
It would be interesting to see how the individual proxy records compare to the individual temperature records.
One recent Dorsett study/excation yielded evidence of trade between Dorsett culture and the Greenland Norse. It would appear that Dorsett culture accompanied the Norse culture into oblivion and that the Innuits found a depopulated region.
mpainter,
From what I’ve read, they used to think the Dorset and Thule cultures overlapped based upon radio carbon dating of char in clearly Dorset sites and the Thule adoption of Dorset harpoon head technology. More recently the thinking has stared shifting away from this with the Thule hunters using old Dorset sites, using their hearths and picking up their harpoon heads. The Dorsets were gone before the Thule and Vikings arrived.
The radiocarbon data shows hearths in continuous use for a century or so and then unused for a few centuries before new char shows up. I guess they keep refining the method.
In fact, Jeff, several Dorset sites have yielded indications of contacts with the Greenland Norse. This from internet sources.
Yes, the interwebs seem to run the gamut. I read a National Geographic article from 2012 that claims the Dorset culture lasted until 1500 AD with no mention of the Thule at all. My guess is that story is not really known by anyone.
Part of the is due to the unusual conditions in the Arctic. Anything made of stone (foundations, carvings, tools) lasts forever and is difficult to date. Organic materials are limited, and get used and reused. The most common source of heat and light, seal oil lamps, do not leave a (currently) datable residue.
The archeologists and anthropologists working in the area seem to have their own grinding axes, possibly politically driven: the Arctic peoples were strong and free until the post Viking Europeans arrived with their disease and general corruption; or the Arctic climate has always been the same until now.
A part of the problem is archaeologists. There are some interesting Inuit traditions about contacts with the Dorset people. One gets the feeling that these are ignored because the Innuit are not peer reviewed and trained anthropologists.
In this regard, the Pueblo Indians have a tradition of having emigrated from Mesa Verde, centuries ago. For years this tradition was disregarded by the anthropologists. It is finally gaining credance.
You mention the longevity of artefacts in the Arctic. At several late Dorset sites wool yarn has been recovered. The wool comes from either the muskox or the Arctic hare, both found in Greenland. Very interesting indications of contacts between the Greenland Norse and the Dorset people.
The implication is that changing climate (the little ice age) may have been the demise of both cultures.
The National Geographic article suggests these yarns are evidence of Viking settlement while it seemed to me to be evidence of trade.
In fact, Sutherland, the excavator, posits a Norse trade station and a flourishing trade with the Dorset people, according to the article.
From CA circa 2013, the canonical 5 varve series. Note the lack of correlation of these series. I re-examined several of the Arctic varve series and they seem to be all over the place.
Another puzzle is why PAGES2K gets 1941-1970 as warmer than 1970-2000, as you discuss here:
The Third Warmest Arctic Century
Was this also true for the Kaufman and McKay correction report from 2014?
This is puzzling because 1941-1970 was during the cooling trend that led some to suggest we were headed into a new ice age.
Any ideas for an explanation of this discrepancy? Could the “upside down issue” have an effect?
Bob Clark
4 Trackbacks
[…] McIntyre has a new post on a new paper by Raymond Bradley that supports a longstanding Climate Audit criticism of varve […]
[…] McIntyre has a new post on a new paper by Raymond Bradley that supports a longstanding Climate Audit criticism of varve […]
[…] https://climateaudit.org/2015/07/07/raymond-bradley-and-the-grand-old-duke-of-york/#more-21169 […]
[…] on some related developments in an article (Balascio et al, Climate of the Past, 2015) which I had discussed last summer while it was in open review, which I will subsequently connect to the discussion of […]