A climateaudit first:- here is the first sample-by-sample àŽⳏ18 for an entire Thompson drill core – in this case KNIF2 and KNIF3 from Kilimanjaro. I had hoped that the data would be properly archived, but it was sent to me by Science and is webbed up here pending a more official archive, which will presumably take place in the future. In the mining business, you need to see complete drill cores – why should ice cores be any different?
I have been attempting to get Thompson to create proper permanent archives of data a long time (with an initial data inquiry over 2 years ago). The two data files here are very inadequate, since they are only 2 of 6 cores at Kilimanjaro and include only àŽⳏ18, but not ion and chemical measurements, and do not deal with other important published tropical sites such as Dunde, Guliya, Dasuopu, Quelccaya, Sajama and Huascaran (not to speak of relatively work at Puruogangri and Quelccaya that is rapidly becoming stale for not being published). However, it’s a small first dividend. Lonnie Thompson is one of the “wise men”, who recently wrote the Barton Committee advising them to butt out.
Here is a quick plot of the data and a few thoughts.
First, a simple that there is no annual cycle of àŽⳏ18 values observable in the Kilimanjaro cores, comparable to other tropical cores. Thompson doesn’t claim otherwise, but it wasn’t mentioned. Second, one obviously doesn’t get any sense of àŽⳏ18 going upwards off the page in the 20th Century. An obvious corollary is that the Hockey Team uses Dunde or Guliya àŽⳏ18 rather than Kilimanjaro àŽⳏ18. If àŽⳏ18 is a good temperature proxy, why isn’t it showing up? Third, the most negative àŽⳏ18 value in the entire KNIF2 core occurs at a depth of only 0.544 m (dated after 1950) – what was going on here?

Figure 1.Kilimanjaro àŽⳏ18 top-KNIF2, bottom KNIF3
Both cores are about 50 m long. KNIF3 is assigned a start date of 11700 BP, while KNIF2 is (implicitly) assigned a start date of about 3800 BP. about 50 m long. I’ve been mildly curious as to how the start date of 11700 is assigned to this relatively thin glacier, as, for example, Quelccaya is much thicker and is assigned a start date of about 470 AD.
One of the key pieces of dating information cited in the article is that a radiocarbon date of 8280 BP (1950) “determined from small quantities of organic samples from the deepest section (47.9 to 49.0 m) of NIF3 supports the presence of early Holocene ice”. The basal age of 11700 BP was assigned by comparing the general shape of the NIF3 àŽⳏ18 to the shape of the well-dated Soreq Cave àŽⳏ18 curve. No information is given as to what the organic material was – it would be interesting to know. I’ve mentioned before that if a glacier in a few centuries were to overrun a temperate site like Sheep Mountain CA, some of the highest organics that it would engulf would be the Holocene Optimum bristlecone stumps, which would date to 6000 BP or so. Wouldn’t an included organic simply be a terminus ad quem for the date of formation of the glacier. Archaeologists worry about this type of thing all the time in dating strata in a tell. I’ve plotted below all the radiocarbon dates by depth from the Thompson SI together with a rough approximation of the age model for the KNIF3 core? There are some remarkably young organic samples in the core, which much surely raise some question as to how much weight can be placed on the interpretation of the dated organics. I’ll try to consider the Soreq Cave on another occasion. For now, let’s just say that the wiggle-matching seems a little arbitrary to me and other interpretations may be possible.
Figure 2. Kilimanjaro Radiocarbon Samples from Thompson et al [2002] SI
One aspect of the Kilimanjaro report that I find troubling is a proposed re-scaling of the KNIF2 core. Obviously I haven’t dealt with this core in detail and am not trying to do anything here other than ask questions. The re-scaling is justified on the basis of àŽⳏ18 wiggle-matching in which “events” in KNIF2 are allocated to “events” in KNIF3. Wiggle-matching seems to me to be sometimes in the eye of the beholder. For example, if you look at my plots in Figure 1 above, it seems to me that one could plausibly allocate the downspike near 40 m in KNIF2 to the downspike near 37 m in KNIF3 and that one could plausibly view the two cores as being more or less the same age – whatever that age was. Instead, Thompson wiggle-matches the downspike near 40 m of KNIF2 with the downspike near 30m in KNIF3 and compresses much KNIF2 length into a shorter length of KNIF3 – see below.

Thompson et al [2003] Fig. 2 (A and C). The 10-year average àŽⳏ18 records from the (A) NIF2 and (C) NIF3 cores are shown for their entire lengths. (B) NIF2 depths are rescaled to the NIF3 depth scale by matching similar àŽⳏ18 features, showing that NIF2 is contemporaneous with the upper 32 m of NIF3. The àŽⳏ18 events labeled 1 to 9 are assumed to be coeval.
In his Supplementary Information, Thompson plots 50-year averages of various ions, showing the effect of the KNIF2 compression. Obviously I haven’t seen the ion data in detail, but the matches in the SI do not seem very impressive. The upspikes in KINF2 occur earlier than in KNIF3, suggesting at least the possibility that the àŽⳏ18 wiggle-matching might not be 100% on the money.
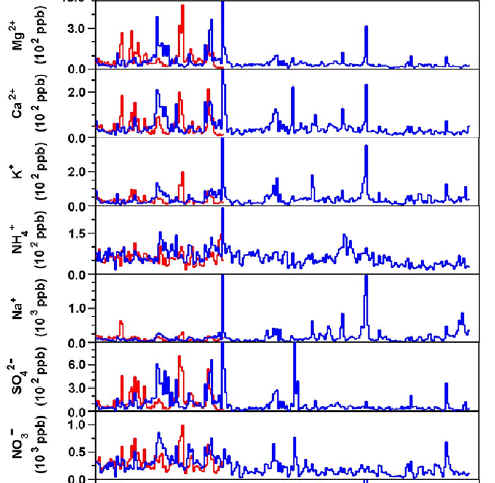
Thompson et al. [2002] Supplementary Information Figure .
A few other oddities that caught my eye in this article.
Thompson has reported massive 20th century downwasting of the Kilimanjaro glacier – this seems unarguable. However at KNIF3, he reported that the high Cl-36 levels from a 1952 thermonuclear explosion could be observed in the core. He attempted to reconcile the downwasting with this layer still being extant by hypothesizing a large precipitation event in the early 1960s. I don’t see that this really does what he wants. One idea here: at tropical glaciers in the Himalayas, the most negative àŽⳏ18 values occur in the summer due to a monsoon rainout effect, reversing the pattern in Arctic regions. (This drives Thompson crazy since he wants to argue that higher àŽⳏ18 values in the 20th century at Dunde and Guliya are evidence of exceptional warmth. As I’ve discussed before, he does some very unimpressive correlation analysis to try to argue this. I’m not saying it’s impossible, only that his statistical arguments don’t really work.) Anyway if you look back at the negative àŽⳏ18 excursion at 0.544 m in KNIF2, maybe this reflects the massive precipitation event, with a monsoon rainout effect in the very negative àŽⳏ18 values. On earlier occasions, Thompson interprets highly negative àŽⳏ18 downspikes as signs of coldness and aridity. I’m not saying that this interpretation is incorrect, but wouldn’t you like to see an explanation of the modern values?
For core SIF2, Thompson reports a 6-meter interval of “rogue” ice that was “removed from the record because the isotopic signature was unique within the set of 5 cores”. The “rogue” ice was attributed to a “brief mass wasting or crevasse formation event”. I am sure that that’s a possible explanation, but it would be nice to see what the data looked like.
The formation of the Kilimanjaro glacier in the warm Holocene Optimum seems a little odd to me. If anyone were trying to argue that the “Holocene Optimum” was a regional hodge-podge (the current Hockey Team line on the Medieval Warm Period), then the supposed formation of the Kilimanjaro glacier in this period would undoubtedly crop up as evidence for local “coldness”. However, if there were problems with the Kilimanjaro glacier dating, then the matter might be reconciled in a different way.


24 Comments
Steve,
Both KNIF links currently point to the same file.
John replies: Ficed
Like you, I’m unimpressed with the rescaling in Fig 2 to get wiggles to line up. You can get a simple objective measure by doing a cross-correlation of the two series versus lag and the rescaling amplitude simultaneously. Of course if there is differential compression of the cores or the local climate was sufficiently different there won’t be a good match.
“Rogue ice” that’s a new one on me.
Isn’t it amazing that these tropical ice cores are reported with such a thick layer of fudge?
Second thought: Does it really take a PhD to work out that the outgassing from such a thin piece of ice right at the equator must render the remainder meaningless?
John, the O18 measrurements aren’t done on CO2. They’re done on the water. Of course O18 measurements might be interesting on CO2 if there’s an appreciable difference in O18 in CO2 produced by burning and that released by respiration. Here’s a random link:
http://www2.sunysuffolk.edu/mandias/lia/determining_climate_record.html
“Measurement of the ratio of O18 vs. O16 isotopes in ice indicates the temperature of the snow at the time it was formed. Higher ratios of the heavier O18 oxygen isotope indicate the snow formed at a higher temperature while lower ratios indicate the snow formed at a cooler temperature.”
To me a very worrying issue in the Kilimanjaro core is that accumulation is extremely low.
How can anybody guarantee that all years had ice accumulation, or that no great hiatuses exist due to previous meltings.
Sedimentary equivalents: non-deposition and erosion.
Or in other words: how do we know that the Kilimanjaro ice core record is complete as we cannot distinguish individual years, like we can in eg Quelccaya?
Dave, despite your quotation, in monsoon precipitation regimes, the dO18 in summer is lower due to rainout than in winter. Interpretation of dO18 in tropical glaciers seems very fraught with problems to me.
Hans, I agree 100%. The article says that there was net ablation of 1.09 m in 2000-1 and accumulation of 0.13 m in 2001-2002. I don’t see how you can date this thing at all with what he’s shown. I would have thought that the really young organics rather low in some cores would set a maximum age for that depth. For example, I would say that the ~2000 year old organic at 45 m in KNIF1 would argue more strongly for a date about the same as Quelccaya or even younger (!) for this glacier, as opposed to the ~8000 year old organic arguing for an early start. I’m trying to figure out how you can say for sure that it started in the Holocene Optimum as opposed to the MWP.
Something else arguing for a younger date. If you try to correlate the dO18 downspikes to known cold snaps, then there’s nothing for the 19th century cold snap. I’ll bet that the “Wolf” downspike here is actually later – maybe Maunder.
Steve, you say the data was sent to you by Science, I assume you mean the magazine. How is it that they were in posession of the data? And why did they decide to send it out? Does this mean that they may have other “lost treasures?”
Thanks,
w.
Re #7
Yes, though my quote was to indicate that the O18 measurements were from H2O and not CO2 from gas inclusions. I suppose I ought to go look at the earlier thread on monsoon precipitation. I’d think that the differential O18 concentrations would be mostly caused by differential evaporation over oceans by molecular weight rather than rain which I wouldn’t think should sort much by molecular weight. But perhaps I haven’t thought it through enough.
Re #9: Willis, I posted up some correspondence on this with Science http://www.climateaudit.org/?p=327. I’ve been grinding Science a bit since they’ve written to the Barton Committee telling it to butt out. I’d criticized them for either not having a data archiving polioy or not enforcing me. They wrote me in my capacity as blogger telling me that they had a terrific data archiving policy. So I’ve been trying to hold their feet to the flames a little. In fairness to them, they seem to have been working away at Thompson. Thompson’s fed them a little data, which they sent me. I think that they were hoping against hope that this would appease me. But Thompson’s data archives are a joke. He needs to archive every damn site and every damn sample. The irony of Science and Thompson both writing the Barton Committee to tell them to butt out is really quite delicious when they are both so non-compliant with Science’s data archiving policies.
Steve
Fig 2 , Kilimanjaro Radiocarbon samples above is interesting – the red line for date does not fit the data at all. 2 data points above, the rest below. The curve should have as many above and below.
Louis,
I agree.
Whatever “Add trend” Thompson chose to draw this line was not one which actually fit his data.
I continue to be amazed that this sort of thing makes it through the peer review process.
Isn’t the red curve indicating a different dating mechanism? Not a trend line for the organics. If you read the post, it gives that impression. Figure should have duplicate axes.
The red line is not a “fit” to the radiocarbon dates, but a dating model based on several assumptions: 1) that the glacier formed at least in the Early Holocene based on the presence of the 8000 BP radiocarbon organics; 2) wiggle-matching to Soreq Cave to pin the start to 11700 BP; 3) the Wolf Minimum matched to he second downward O18 excursion. That’s not to say that this argument holds any water.
I would have thought that the YOUNGEST dated organic would be an upper limit to that core i.e. it would be bounded by the young organics. Whatever the real date of this glacier, I don’t see how you can say whether it’s 2000 years old or 11700 years old.
IOW TCO was right.
Content post:
1. Just looking at FIG1, it seems that there is a sort of sawtooth pattern going on with period of every 4-5 meters (but with a fair amount of deviation/noise on top of the sawtooth signal). Are there any tests to run to see if the pattern is significant versus random noise?
2. If there is such a sawtooth and it’s significant, what could have caused it?
3. Trying to think why there could be such a difference in thickness/age and all I can come up with is that the one that has more ice/year was on a flat and the other was on a slope.
4. I assume that there are some mechanisms for transport of organics…but if so, it casts the whole core into question, no? What would an expert like our swiss friend say on this issue?
5. I agree that it seems like wiggles near 40 and near 30 can be matched well with each other with a shift of about 2 meters vice the 10 meter shift. How can one address the two choices mathematically?
6. Just being nitty, but there’s a misprint of 5 twice on T’s figure 2.
7. When I look at T’s figure 2 and follow the wiggles and look at the events, it sure seems to make good sense how he matched the wiggles. Nothing sticks out as wrong.
8. Wonder what the impact of the 10 year averaging is, how many points go into it, etc. Still may be a great way to process data actually to enable the wiggle matches.
9. “coeval?” Come on! Use a regular word. The more silly the social science, the more they wordy up their language.
10. Perhaps the ion measurements need more sample? Still wonder why we have 50m for ions and 10 for O18. and implication of that re stats caveats.
11. The wiggle match is not a simple 4 for 3 rate thing is it? Varying in rate instead?
12. What is the rationale for the prescence of ions at all in the ice? What makes one have more or less of an ion?
13. Sometimes with analyses, it’s more the peaks that are important than the peak height (not sure how to express this). And don’t know if this is the case with ions in ice. Need more cores to see that. But real hard for me to judge if wiggles of ions match or not. NH4+ looks good, but Na+ doesn’t.
14. Any chance, you can capture the implied data from the curves and then deconvolue back out the offset? Then you could visually see if unoffset works better. Or I guess, you could come up with your own offset. But that figure 2 wiggle match sure looks good…
7. The knock against T’s identification is that you can just easily wiggle-match while keeping the wiggles closer together. I think that the plot of all the data (my figure) makes this easier to see than T’s – smoothed version. Second, T’s histogram format has DIFFERENT zeros – for cores less than 100 yars apart, this is really hard to justify. T’s dating requires for two cores less than 100 yards apart (maybe closer) that 1) KNIF2 has lost nearly 8000 years of core (corresponding to the bottom 20 meters of KNIF3), preserved in the nearby core; 2) KNIF3 core is more compressed than KNIF2 so that it covers in 30 meters, what takes 50 meters in KNIF2; 3) most remarkably, the amount of extra compression in KNIF3 EXACTLY matches the amount of missing core in KNIF2 so that both cores end up being 50 meters long.
Come on… it’s just as plausible to match the wiggles a little differently and assume that both cores are about the same age. I’m not sure how one can show that one wiggle-match is better than another wiggle-match, but 1,2 and especially 3 above convince me that you need to find it. But even if you do wiggle-match, you can’t just go and splice them.
Re #13
The I would assume, based on comments below, that the red curve was derived from other data, and that the composite curve is the combination of two separate graphs, hence Figure 2.
Peer review?
Brooks, you hit the nail on the head.
I meant comments below Brook’s post, by the way, but then being a geologist non-obscure talking these days might as well be in Latin.
Here is some breaking news from April 17, 2007.
Kilimanjaro’s ice set to linger
I cannot recall. Was Kilimanjaro one of Al Gore’s icons?
Yes it was. He said that within the decade the snows of Kilimanjaro would be gone. He also just shows a set of before and after pictures without mentioning that the reasons for the melt have nothing to do with AGW.
One disappointing thing about that article is it speculates at the end that the reason why precipitation may have decreased might be the result of global warming. Despite the fact that it’s been well known for years that the decrease in precipitation has been caused by deforestation on the slopes of mount K., caused by local farmers needing wood for fuel and structures.
RE: #23 – People who are familiar with the climate of the Middle East will note that the past 10 – 15 years have featured very cold winters. The way the winter monsoon winds work, the colder it is in the Asian interior, the more robust the winter monsoon is. The winter monsoon is fickle. Some places get rain from it (for example, Singapore) and some places get only coolish dry winds from it. It would be interesting to know how the winter monsoon affects that part of Africa, if at all.
One Trackback
[…] number of posts, including the following Science Editorial, Science Editorial #2, Letter re Esper, Kilimanjaro Data and others. To date, Science’s performance in ensuring compliance with their own data […]