John V has posted some graphics recently arguing that CRN1-2 yielded pretty much the same results as major temperature indices and, in some sense, vindicated these results. As Gavin Schmidt has pointed out, the U.S. is only 2% of the world’s surface; and as I’ve observed on many occasions, the statistical methodologies and data quality in the U.S. are different from the ROW, as is the history.
I’ve been focussing more on ROW issues recently rather than U.S. issues, but thought that it would be interesting to drop in briefly on the U.S. issues. Since there seems to be an interest in gridding, I’ll probably do a version, using the methods that I used to contour the trend maps a while ago. I also thought that it would be interesting to verify John V’s CRN1-2 estimate to NOAA and NASA versions myself.
I mention 2006 in the header because there’s something interesting about 2006 which hasn’t been mentioned in John V’s posts: 2006 values for both NOAA and NASA are as much as 0.8 deg C higher than CRN1-2 values.
Let’s review the bidding on 2006 in the U.S. In January 2007, NOAA (not NASA) announced that 2006 was the warmest U.S. year ever:
The 2006 average annual temperature for the contiguous U.S. was the warmest on record and nearly identical to the record set in 1998, according to scientists at the NOAA National Climatic Data Center in Asheville, N.C.
In May, 2006 was demoted slightly to 2nd place, just behind 1998.
Using final quality controlled data from the recently completed USHCN Version 2 data set, the 2006 average annual temperature for the contiguous U.S. was the 2nd warmest on record.
The following graphic shows the differences between NOAA and CRN1-2 averages (the latter using John V’s numbers, which he emailed me and can be downloaded from here. ) In this graphic, there is obviously a remarkable difference between the 2006 NOAA values and the CRN1-2 values with an extraordinarily large difference of about 0.8 deg C between the NOAA index and the CRN1-2 index.
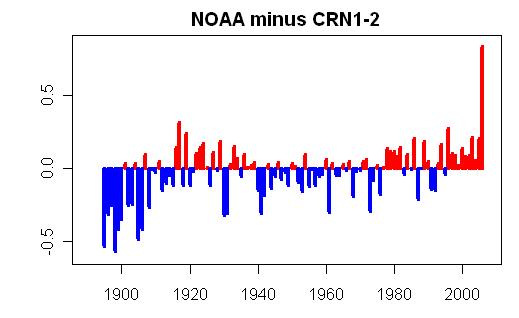
Figure 1. Difference between NOAA and CRN1-2 (both centered on 1961-90 the NOAA reference period).
Now we knew that NOAA runs warmer than NASA – so what is the corresponding result for NASA. See below:
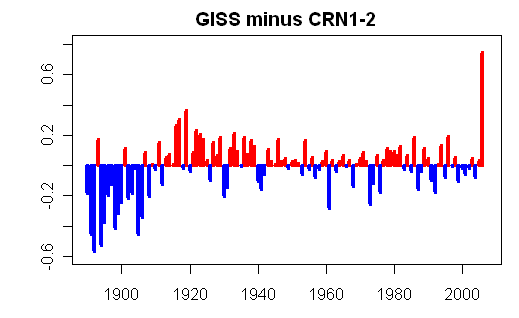
Figure 2. Difference between GISS and CRN1-2 (both centered on 1951-1980, the NASA reference period).
Using the CRN1-2 index, 2006 is not the 1st, 2nd or even 3rd warmest year but the 31st warmest year. The 2006 anomaly exists for both NOAA and NASA. What causes it? Worth looking into. Why didn’t this show up in John V’s graphs? Unfortunately his graphs were typically smoothed and 2006 got lost in his end-point handling, I guess. Personally with these relatively short series, I much prefer to keep an unsmoothed version at least in a grey-scale with a smooth overlay, so that this type of thing shows up better.
Note: I’ll try to do my own gridding of CRN1-2 data to verify whether the 2006 anomaly is due to some artifact in John V’s gridding calculation as opposed to an artifact in the NASA-NOAA numbers.
UPDATE: John V has observed below that the yearly data that he sent me is only up to March 2006 whereas GISS and NOAA values that have compared (in anomaly form) are for the full 2006. He also sent a monthly data set here.
In writing this post, I did not consider the possibility that the annual data for 2006 covered only the first 3 months. When John V sent me his data, he did not state that the 2006 average was only for the first 3 months (it could be deduced from the monthly data, but since the graphs presented to date were from annual data, that’s what I looked at.) This might account for the difference.
Indeed, it’s quite possible that the 2006 anomaly noticed here is an “artifact” – a possibility that I specifically mentioned prior to this update.
I’m going to do some gridding my own way and I’ll revert on this. If any misunderstanding has arisen out of the 3-month stub, I don’t think that, under the circumstances, I’m entirely responsible; in any event, we’ll clear it up; blogs can be quickly edited and I’m quite happy to re-post reconciled graphics.
Also, readers should understand that no slight is intended in the above remarks towards the integrity of John V’s analysis. In comments below, it’s suggested that I intended a slight, but was “too clever” to actually put it in words. If I wanted to make a slight, I would have; the reason why there is no slight “in words” is because there is no slight. John V’s put his methods online and sent me an ASCII version promptly when I requested.
However, different people can look at data differently. How NOAA and CRN1-2 versions compare is just as relevant to me as how GISS and CRN1-2 compare and that comparison was what initiated the present post. It was an area where I expected a difference and it was a topic that John V had not commented on.
I did not suggest that he was in any sense covering up a NOAA-CRN1-2 discrepancy by not comparing them – only that he hadn’t done so and I think that it’s worth doing and worth commenting on – as the warmest 2006 claim primarily originates from NOAA and it’s quite permissible to use CRN1-2 station information to check that result.


81 Comments
Steve, the caption for Figure 2. reads: “Difference between NOAA and CRN1-2” rather than “GISS and CRN1-2.
For this kind of analysis, don’t you have to do CRN 3, 4, 5 as well?
Next step …
It’s self-evident. Someone at NOAA and NASA evidently mixed up their temperature history and climate change research budget spreadsheets.
In all seriousness – that is an extraordinary difference.
Oh, and which version of the NASA temperatures are we talking about? Current, early-September, or pre-September? With all this changing of the past, it’s harder to keep up with than a George Orwell novel.
Just because there are no microsite issues doesn’t mean that UHI has been excluded as well.
On these graphs, 2006 is an obvious outlier in the NASA and NOAA data. Of course NASA and NOAA can fix this by making 2007 and 2008 into outliers which are similar to 2006.
Has the geographical imbalance of the CRN12 sites been resolved? My recollection is that the “warming” western US was over-represented and the “no-trend” southeastern US was under-represented.
#7 Brooks:
Erik and JohnV might take exception to your comment as unhelpful. I think the anomaly SM has identified is sufficient to warrant a close examonation of the 2006 temperature record. Other speculation is not necessary.
Going back to 1890 both NOAA and GISS exagerate the ups and downs also, increasing the warming to ca 1940, increasing the the cooling to ca 1975 and then increasin the warming to 2006, at least somewhat. For GISS the overall warming from 1900 to 2005 is increased by at least 0.2 degtrees C (for NOAA 0.4 degrees C). That’s about 30%. John V’s smoothing seems to obscure things a little, but a pretty significant little. Was that why he went back only to 1925? Murray
SteveM what value did you use to create the CRN12 anomaly from 1950-1981.?
I don’t think any region can be over-represented ;). But you are correct, there basically no stations west of the Mississippi and East of the Rockies.
I think some of the stations in the following pic have since been discluded due to followup on rural classification:
So John V. would have been looking at the same data. He has produced about 50 charts of the data already. I’m assuming he started using the 5-year smoothing technique since the annual data varied so much. But in that process, he would have noticed how the annual data varied over time as well.
Some people were a little uncomfortable with how quick he was to declare “a vindication of GISTEMP.” Now we know why. He smoothed out a vindication.
Good job again Steve.
I posted up the little script to do these calculations. At present, it refers to local directories and needs to be modified a little to make it portable, but, for now, shows the calculations and provenance of data. I’ve shown graphics using a 1961-90 anomaly for NOAA and 1951-1980 for NASA – in this sort of comparison, this doesn’t really matter, as you are showing a delta.
I’ve noticed that John V calculates an absolute temperature rather than an anomaly. I’ll try to do a gridded anomaly calculation of my own using the CRN1-2 data today.
This is the NASA mid-August version. The previous error would be higher and is worth drawing.
There may be something very interesting about the 2006 anomaly which may have some bearing on the ROW analysis. Although USHCN data was available up to 3rd quarter 2006, the NASA version only used USHCN data up to March 2006. Thus, the last three quarters of 2006 in GISS was primarily based on MCDW data – the urban airport stuff that dominates recent ROW data. As the USHCN data is rolled in, it will probably come down. Right now, we don’t know how NOAA averages are compiled, but, from the similarity of the anomaly to the GISS anomaly, you’d have to guess that they also have a staged roll-in of USHCN data, but I’m not sure of that. These are just speculations – I’ve not tried to verify it.
This would imply that this type of rolling anomaly has probably occurred in the past, with a downgrading of the year just past as USHCN data rolled in during late returns, but with a warm current year as the new MCDW data set front ran the USHCN.
It also suggests the possibility that substantial differences can occur between calculations based on USHCN-quality data and MCDW-quality data over the same geography – which would bear on the ROW problem.
Somebody asked about the pre-Y2K comparison: here it is.
SteveMC: to create the anomaly for CRN12 you subtracted its 1950-1981 mean? If this mean is lower
than the nasa mean for the same period, then the deltas are artficially small. For example:
if the GISS mean for the period is 11.2C and the CRN12 eman for the same period is 11.1 You mask
a .1C difference. Doesnt change trends.
MY CRn12 do not match JohnVs. Not even close. Is his CRN12 a rural subset?
18, I thought so. He has recently been labeling CRN12R. I dont know what SteveMc is using though.
RE 19.. Ok I’ll get that and run it.
#17. I centered both series on the same period for both comparisons. I’ve also done graphics using 1895-2006 means and they all look the same.
#4 mega lol!
#21. I used what John V sent me and posted it up at the link shown in the post.
SteveMc:
A very cursory look at the data I sent you (which included the monthly values) would have shown that I only have monthly values to March 2006. So, you are plotting my average for Jan-Feb-Mar and comparing it to a full year average. Based on that you are implying that I was hiding something.
I expect an apology and full retraction.
steven mosher:
The values I emailed to SteveMc were the rural CRN12 results (CRN12R).
John Lang:
There are pretty strong implications in this post as well. I will wait for your apology with SteveMc’s.
One more thing. All of my comparisons have been between my CRN12 results and GISTEMP. What’s with comparing against NOAA and then implying that I was hiding something? (In your Second Look post you made it very clear that NOAA was different and worse than GISTEMP).
“Based on that you are implying that I was hiding something.
I expect an apology and full retraction.”
JohnV,
It might be that you are over inferring just a tad. The only implication that I can draw from “Unfortunately his graphs were typically smoothed and 2006 got lost in his end-point handling, I guess.” is that Steve feels that it’s unfortunate that you smoothed the graphs. Where does “hiding” come in?
I suggest that SteveMc was making an inference based on this:
Of course SteveMc is much too clever to outright accuse me of anything, but the inference is very clear.
John V,
Please type more slowly. You have stressed from the outset that you were working with GISS, right? Are you saying that Steve referring to something that is interesting because it “hasn’t been mentioned” is code for “JohnV is hiding something”? He’s a clever rascal but I’m not sure that’s what he’s saying.
BTW – I appreciate the effort that you’ve made and am astounded by the rapidity with which you completed the work – that doesn’t mean I think you had it in your pocket from Day 1 – 365 – it means that I’m astounded. My stuff doesn’t require the DaVinci codex in order to decipher the meaning.
#24
Why are you 18 months behind?
Bruce, I downloaded the USHCN data set in mid- to late-Sepember. That’s what’s in their file. If somebody can provide me with a link to more recent data, I will be happy to run the analysis including 2006.
SteveMc, will you be happy to promote my results to an article when I do so? (It only seems fair after this article).
Hey guys:
Let’s not get testy. Focus on the data.
I didn’t see anything but monthly in John V’s data and it ended in March 06. And I don’t think anyone is hiding anything. We just have so many data sets floating around that it is hard to keep them straight.
I still think when we tease out the adjustments we are going to find that they will look reasonable individually, but will be shaded so that the combined effect is unreasonable. It is easy to do when the number of adjustments is so great.Just be at the upper or lower edge of each reasonable range. Individually, they look good. Combine them and you get a false result.
We have to keep our eye on the ball and not get upset.
I hereby apologize to anyone that feels offended. We are breaking new ground and I suspect we all are going to go down one wrong path or another while we find our way through the maze of obfuscation.
John V,
You are the one that sent Steve Mc the 2006 data that was averaged with only 3 months of data. I can understand you pointing out the error but the error was yours. You are the one that owes Steve the apology; he was using your data that you sent him.
#31
Before or after the correction:
“September 2007: The year 2000 version of USHCN data was replaced by the current version (with data through 2005). In this newer version, NOAA removed or corrected a number of station records before year 2000. Since these changes included most of the records that failed our quality control checks, we no longer remove any USHCN records.”
http://data.giss.nasa.gov/gistemp/
By the way, is this chart based on the data uou used John V?
http://data.giss.nasa.gov/gistemp/graphs/US_USHCN.2005vs1999.txt
1998 1.23 1.24
1999 .93 .94
2000 .52 .54
2001 .76 .78
2002 .53 .55
2003 .50 .53
2004 .44 .46
2005 .69 .71
2006 1.13 1.15
It also shows an amazing 2006 jump. Is it just 3 months of 2006?
Mike,
are you kidding? SteveMc asked for my data in an email. In my first response I said (emphasis added):
SteveMc responded that he only wanted the yearly data. I provided it along with monthy averages and raw station data in case they were required.
It seemed like a basic courtesy to give me a heads up before posting a critique, and it seemed redundant to even ask. However, when SteveMc found an outlier in 2006 he did not take a minute to ask me about it or even dig into the data I sent. Instead he posted this article supposedly refuting my results.
It is funny that my complete results have never been promoted.
Steve: John V, you post things here without giving me a “heads up” of what you’re going to post. If you were asking me for my comments on what you were posting, I would very much have preferred that your claims to “vindication” of GISS were far more nuanced to reflect the differences between U.S. and ROW methodology and data, to avoid third parties ratcheting up the rhetoric on this. However, I don’t expect you to run your comments past me. It didn’t occur to me that you expected me to run my posts past you before posting.
As to your claim that your “results have never been promoted” – puh-leeze. You’ve received a large audience here and a lot of attention. I’ve never done any Gavinesque censoring of anything that you’ve posted. Your results as published here have been cited in several other blogs. For the most part in the past few weeks, I’ve not been working on U.S. data and that’s why I haven’t been commenting specifically on your U.S. work – but you’ve had lots of attention from others and an opportunity for “promotion” of your work that you would not have had if you were just putting things up on your website without crossposting here.
Steve:
You’ve said that before, and it’s wrong. The continental US is 2% of the world’s surface area, including oceans. It’s 6% of the land surface.
#34 Bruce:
It was downloaded on September 21, 2007 directly from NOAA. Your quote is from NASA GISS. It was GISS that changed their data sets — there has been no change at NOAA that I know of.
I’ve added the following update to the note:
John V has observed below that the yearly data that he sent me is only up to March 2006 whereas GISS and NOAA values that have compared (in anomaly form) are for the full 2006. He also sent a monthly data set here. In writing this post, I did not consider the possibility that the annual data for 2006 covered only the first 3 months. When John V sent me his data, he did not state that the 2006 average was only for the first 3 months (it could be deduced from the monthly data, but since the graphs presented to date were from annual data, that’s what I looked at.) This might account for the difference. Indeed, it’s quite possible that the 2006 anomaly noticed here is an “artifact” – a possibility that I specifically mentioned prior to this update. I’m going to do some gridding my own way and I’ll revert on this. If any misunderstanding has arisen out of the 3-month stub, I don’t think that, under the circumstances, I’m entirely responsible; in any event, we’ll clear it up; blogs can be quickly edited and I’m quite happy to re-post reconciled graphics.
Also, readers should understand that no slight is intended in the above remarks towards the integrity of John V’s analysis. In comments below, it’s suggested that I intended a slight, but was “too clever” to actually put it in words. If I wanted to make a slight, I would have; the reason why there is no slight “in words” is because there is no slight. John V’s put his methods online and sent me an ASCII version promptly when I requested. However, different people can look at data differently. How NOAA and CRN1-2 versions compare is just as relevant to me as how GISS and CRN1-2 compare and that comparison was what initiated the present post. It was an area where I expected a difference and it was a topic that John V had not commented on. I did not suggest that he was in any sense covering up a NOAA-CRN1-2 discrepancy by not comparing them – only that he hadn’t done so and I think that it’s worth doing and worth commenting on – as the warmest 2006 claim primarily originates from NOAA and it’s quite permissible to use CRN1-2 station information to check that result.
#37. Quite so – changed. My bad. I used 6% of the world’s land surface in the Where’s Waldo?
Hi JohnV.
My CRN12 temperature for 2006 is .84C. When I looked at monthlies it was clear that 2006 was incomplete.
So, I truncate all my stuff at 2005. On the other hand, when I got the yearly that was linked here, I
saw that 2006 had a more reasonable value..
I downloaded the yearly CVS you mailed to SteveMc and these are the values for 2000-2006:
10.48
10.76
10.49
10.4
10.46
10.6
10.33
10.33 appears to be the average for 2006.
So, is the yearly.cvs in error? When I run OpenTemp I never get valid 2006 figures. ( well If I look
at monthlies i see which months are used.) SO I truncate at 2005. The spreadsheets I mailed you all
show that. Question, did the yearly.cvs you sent steve have a 2006 of 10.33.?
John V,
Your complete results have been promoted by you plenty of times. You have made numerous posts about how your CR12R and GISS are in very good agreement. You usually (or always) fail to mention that you are comparing 17 or less station months of CRN12R data to thousands of GISS station months for any given month. You usually make the vague mention that your data has some geographic distribution problems but you fail to mention that over half of the country is not represented in your CRN12R data.
Never the less, you sent Steve 2006 with only 3 months averaged into that year and did not point that out to him. Usually, when a year is presented it is because all months of that year are included or that year is left blank. Your mistake, not his.
Steve McIntyre:
I appreciate the note. This all could have been resolved with a quick email to me instead of rushing an article. I still think it’s funny that a difference in 2006 is worth an article, but a close correlation from 1900 to 2005 is not.
I would appreciate it if you could provide a link to USHCN TOBS data to the end of 2006. I will update my analysis and send you a new file.
By the way, the early rural CRN12 results should probably not be plotted due to a very low number of stations: an average of 1.3 in the 1880s, 6.6 in the 1890s, 10.6 in the 1900s, 14.3 in the 1910s, and 16 to 17 from the 1920s onward.
#41 steven mosher:
My mistake. My previous GHCN data ended in March 2006. The USHCN data ends in October 2006 (10 months of 2006 instead of 3). I posted above when I was away from my main computer so was writing from memory. I apologize for the confusion.
So, I still need to find data for Nov and Dec 2006. Can anyone point me to it?
#41 steven mosher:
Yes, the yearly.csv file I sent to Steve McIntyre had an average of 10.33 for 2006 (an average for the first 10 months of 2006).
#43. I looked back at my email and I confirm that one of John V’s emails contained the request mentioned above:
I am overwhelmed by the tide of inflow and in this case, I missed this request as the actual data was delivered in a later email. I apologize for not giving John V the requested heads up. As noted above, my guess is now that the size of the discrepancy will be something to do with the three-month stub – a cold early 2006 trimester might account for it, rather then MCDW variations, but it needs to be checked.
#45 John V, you now say the 2006 figure of 10.33 is based on 10 months Jan – Oct, not 3 as you said in 24. If that is the case then your figure should be anomolously high, as it omits cold months. But in fact your fig is anomolously low according to Steves graph at the top. Or is it Jan-Oct divided by 12?! Clearly there is still some confusion. Let’s sort the confusion and stop demanding apologies.
I just re-downloaded from NOAA at the link below, but the data file is exactly the same as the one I have been using. That is, it ends in Oct 2006.
ftp://ftp.ncdc.noaa.gov/pub/data/ushcn
PaulM:
Thanks for your input. I have already apologized for thinking the data ended in March 2006 instead of October 2006. As I said, I was not at my main computer but the article reqired a quick response.
Good catch. OpenTemp currently assumes a full year’s worth of data when calculating the average for a year. It has never been an issue before because I have been discarding partial years. I will fix it to write nothing if the year is not complete.
Now, can you help sort out the confusion by providing a link to USHCN TOBS data for all of 2006?
RE 44. Thanks JohnV. This morning when I saw Steve’s post I thought I was takin crazy pills, because
I’ve always got the small numbers for 2006 ( like
PaulM:
OpenTemp is now fixed to not write yearly averages for partial years. That should help prevent any confusion in the future.
RE 44. You switched to USHCN? When I post stuff I’ll indicate that I am using GHCN files. That way we wont
argue at cross purposes
#36 SteveMc:
In response to your inline reply.
I have acknowledged and thanked you for the opportunity to post my results here. I will do so again. Thank you.
I requested that you give me a heads up because you were specifically plotting my results. As I recall, John Goetz required BigCityLib to remove his plot based on a bad interpretation.
My comment was regarding which articles you choose to post and which you choose to hide. This is your site so you can post what you want, but your repeated pleas of impartiality in the AGW debate are getting harder and harder to believe.
#52 steven mosher:
My most recent plots clearly indicated that they were USHCN TOBS.
Note:
The last plot (with key trends) has an error in the title. It should read “GISTEMP (Sept 12, 2007), CRN12R (TOBS), CRN5 (TOBS)” like the other plots.
RE 51
“OpenTemp is now fixed to not write yearly averages for partial years. That should help prevent any confusion in the future.”
John,
In your fix for this, do you alert the user that the yearly average for that year is an extrapolation from partial data?
32. I started out only using JohnV monthly data. when I started to notice funky stuff at the end of the charts
I looked at all 12 months of 125 years of data. And you could see that 2006 was not complete.
Kinda off since the program indicates as it runs that it is writing 2005,2006,2007. But whatever.
Then, I switched to yearly. yearly.cvs. Unforntately the file writes a 2006 value even if 2006 is
incomplete. With my version it was easy to see this since the 2006 figures would be .8C instead of
11C.
JohnV did you update the program to calucluate the average of years with missing months? Because my
version has .84C as the avergae for 2006. This would imply a sum divided by 12.
#55 Aaron Wells:
I wrote “OpenTemp is now fixed to not write yearly averages for partial years”. Since a partial year average is an invalid average, it is not written at all. The monthly data file is available for calculations from the monthly results.
steven mosher:
It looks like we were both writing at the same time. See my posts above.
OpenTemp was dividing by 12 and writing the results even if the year had partial data. As you’ve said, it was easy to spot the 2006 problem with GHCN since it only had 3 months. It’s harder to see with 2006 because 2006 was a warm year (in the USA lower 48 of course).
OpenTemp is now fixed to exclude yearly averages if the year does not have monthly averages for all 12 months.
RE 54.
Yes I saw those charts. those charts didnt tell me the source of the data you sent SteveMc.
So I just assumed it was the CRN12 we had been talking about earlier. Not CRN12R, and not CRN12 USHCN.
I just wanted to clear up my comment that said my stuff ( GHCN CRN12) didnt match your stuff. ( CRN12R USHCN).
I’m clear now on what you sent to steve. I had put the data in my big old data sheet but since everything
else in there is GHCNv2_mean, I’ll remove it just for consistency. If I send you that speadshet for posting
I’ll include all the partcilars
#42 Mike:
I could fill each of my posts with disclaimers and never get to the results. I am working with the rural CRN12 stations because those are the best stations available. In my opinion it’s better to work with a small set of good data than a large set of bad data.
It sounds like you’re playing the coincidence card. I will concede that it’s possible that it’s just a coincidence that the rural CRN12 stations match the GISTEMP result (for the USA lower 48). As more stations are rated by Anthony Watts and his volunteers we will know better.
Let me ask you a couple of questions:
– If the rural CRN12 stations gave a very different result than GISTEMP, would you call that a coincidence?
– Were you playing the coincidence card when SteveMc’s results showed a huge difference between CRN1 and CRN5 (a conclusion that I agree with)?
re57: thanks JohnV.
For completeness, here is a map of the distribution of rural CRN12 stations:
They are under-represented in the south east. OpenTemp weights the stations geographically to compensate for this bias.
I am interested to see how the OpenTemp results compare to SteveMc’s method of weighting. If they match, that’s good. If they don’t, then I can fix any bugs and that will also be good.
#59 steven mosher:
Sorry for the harsh tone in my first response re switching to USHCN (#54). It’s been a long morning…
To confirm:
The data I sent to SteveMc was generated using rural CRN12 stations with TOBS corrections applied.
John V. at al,
Please stow the rhetoric and focus on the data. Every comment you post questioning people’s motives similarly undermines your own arguments. If you feel that your position is being misrepresented you can back up your conclusions with quantified analysis. Folks can acknowledge inherent biases or prejudices and move on.
Thanks,
Earle
PS – People who demand respect or an apology are rarely deserving of it, in my humble opinion. I have no clue whether this opinion is widely shared, so take from it what you will.
RE 63. JohnV that wasnt a harsh tone. I sensed there was something askew with the 2006 figures,
but when saw my CRN12 2006 with .86 and yours with 10.33 or something, I was befuddled. So I asked clay
about the CRN12, and then I though maybe I copied files from the yearly.cvs wrong, so I went back to
my square one. If I get the latest vesion will I have to switch to USHCN? or will my old *bat
files work.
RE 63. JohnV that wasnt a harsh tone. I sensed there was something askew with the 2006 figures,
but when saw my CRN12 2006 with .86 and yours with 10.33 or something, I was befuddled. So I asked clay
about the CRN12R, and then I though maybe I copied files from the yearly.cvs wrong, so I went back to
my square one. If I get the latest vesion will I have to switch to USHCN? or will my old *bat
files work.
>> In my opinion its better to work with a small set of good data than a large set of bad data.
But does that actually tell us anything about the thermodynamic state of the earth-atmosphere? Why not go further and pick the best rural station, and analyze that one station? Surely, if smaller is better, than smallest is better still.
Alternatively, since you are comparing different data sets anyway, why not compare it to the satellite data? I mean, why look at 1 station, 15 stations, or 2% of the world, when you can look at almost the whole world? Oh, right, because that would be on point. And this is all about statistical busy work. Have fun with that.
#64 Earle Williams:
“Please stow the rhetoric and focus on the data.”
That’s good advice. I will try to follow it.
“People who demand respect or an apology are rarely deserving of it”
You should have followed your own advice.
Gunnar:
I have not moved on to the rest of the world because, as SteveMc so often says, do don’t know anything about station quality for the rest of the world. The 17 best stations were chosen based on feedback from my original analysis of 50+ CRN12 stations (which included urban stations and therefore included UHI effects).
You are intentionally misrepresenting my argument.
I developed OpenTemp to look at USA lower 48 data when Anthony Watts posted the results of the first third of stations. The primary goal has been comparing and quantifying differences between stations with different CRN ratings. GISTEMP results were added because GISTEMP has received a lot of abuse around here lately.
If there are more results you’d like to see, download OpenTemp and run any analysis you’d like.
—–
Ok, I’m going to do my best to ignore trolls and flame bait. It’s funny that some people are so mad about a simple comparison between rural CRN12 stations and GISTEMP (for the USA lower 48).
John V,
You ask “- If the rural CRN12 stations gave a very different result than GISTEMP, would you call that a coincidence?
– Were you playing the coincidence card when SteveMcs results showed a huge difference between CRN1 and CRN5 (a conclusion that I agree with)?”
For your first question, I would consider it inconclusive due to a lack of data just like I considered your plots to be inconclusive due to a lack of data.
For your second question, I expect to see differences between CRN 1 and 5 regardless of the number of stations that are being compared.
>> You are intentionally misrepresenting my argument
I didn’t represent your argument at all, so I could not misrepresent it. My point is more abstract: 16 stations, or even 1500 stations, if it only represents 2% of earth-atmosphere, is completely non representative of the thermodynamic state. Therefore, it’s irrelevant busy work. The blunt truth is that Watt’s work is the same. It merely serves the purpose of annoying the AGWers, but does not advance our knowledge. 2% of earth
>> Its funny that some people are so mad about a simple comparison between rural CRN12 stations and GISTEMP
The 2% of earth comparison doesn’t make me mad. I was just stating my opinion that it’s meaningless. 2% of earth. 2% of earth.
I see you didn’t deal with my argument that we should use the satellite data.
Btw, did I mention that you’re talking about 2% of earth?
RE 62:
I see that Woodstock VA (a CRN2 station) is being used. I was the one that investigated this station. It has been a CRN2 station for only a little over a year. For about 10 years before that it was a CRN3 station (under trees and fairly close to a house). Before that it may have been a CRN2 station for a while. Early in the record it was at various locations in the town proper, so it may have been lower quality then.
Bottom line – this station has moved around a lot and was only CRN2 for part of the time. I would delete it from temperature reconstructions.
>> this station has moved around a lot and was only CRN2 for part of the time. I would delete it from temperature reconstructions.
If we were calculating trends for each station, then averaging the trends, then it would seem valid to eliminate a station that is not one consistent dataset. But correct me if I’m wrong, but I don’t think we’re doing that.
A different way of looking at the data is to consider all data points as stand-alone snapshots of the temperature at the particular time and place. Therefore, station moves do not make the data invalid.
Aside: It would be even more useful to weight each station with the area it represents. In this case, we don’t remove urban measurements, we simply weight them as only representing the city. Since the lower 48 have many more stations per square mile than anywhere else, this would make a single station weight quite small. As it should be.
What a load of Statistical mumbo jumbo, what is anyone meant to make of this!
I thought you were auditing the so called scientific output, not having clashes of ego’s.
Gunnar says
The problem is that the 2%-of-earth data is not only the most intensely studied, it apparently forms part of the basis for calibrating an incredible amount of other data.
I don’t have links at my fingertips, but I’ve seen statements alluding to even satellite measures being calibrated off the surface station measures.
The amount of interplay between “independent” data sources is truly astounding. Someone could add great value by documenting, even generally, the connection assumptions. It is far more than “simple” 1200km remote adjustments or Paris-USA, or Sierra BristleCone Pine influence.
This is beginning to remind me of a professional project, where a dozen separate systems are manually updated when (contact) data changes. Except that few people can remember all the places that need updating.
It may seem that the CA “team” is wasting time on silly basics… yet somebody needs to do it! Who else will discover and set out unequivocally solid baseline information? You’re in the right place if you want to distinguish good from uncertain data.
Ok, I’m back, I’ve eaten, and I’m in a better mood. This site can be pretty hostile and too often I let it get to me.
Moving on…
There is nothing that can be done about the small number of rural CRN12 stations. I could start including the CRN3 stations for more complete geographical coverage. I would appreciate it if somebody could provide me with a list of rural CRN3 stations. (I would generate the list myself but it will be better accepted if it comes from Steve McIntyre, Anthony Watts, Kristen Byrnes, or one of the other regulars here).
Once the rural CRN3 station list is available (and assuming it has a dozen or more stations), I can do a Monte Carlo analysis to estimate the uncertainty due to the low number of stations. I hope everyone can agree that adding uncertainty bounds to the CRN12R plots would be useful.
#74 Douglas Hoyt:
I am open to removing any stations that should be removed. The list of stations was provided by Kristen Byrnes. Her assistance in choosing the best stations was helpful.
As thin-skinned as some people appear to be, I would think they’d welcome Global Warming…
Steve McIntyre:
I would appreciate it if you could send me a link for the NOAA yearly data for the USA lower 48. There also seems to be some interest in satellite data — is that available for the USA lower 48 anywhere?
Steve: I’ve uploaded a script to collate NOAA lower 48 station at http://data.climateaudit.org/scripts/station/noaa/collation.us.noaa.txt .
So much of the emotion-driven sniping back and forth comes from the fact that people on both sides of the ideological divide are too quick to run with conclusions that are too premature to be drawn, given the number of CRN stations available.
Let’s wait to draw conclusions (on both sides), and just follow the data where-ever it may lead. Case in point is the fact that John V. makes… the geographical representation of the rural stations is currently grossly imbalanced (not John V’s fault). And as Clayton B. pointed out, the Southeast US is only represented by 1 station out of 17 rural stations. So we have an initial graph which almost completely leaves out a region that had zero average anomalies during the period from 1976 to 2005:
The situation may swing wildly in either direction before we have conclusive data.
Re#68, Gunnar:
If we want to have accurate historic temperature data for a period longer that 28 years (satellite measurements) or 50 years (weather balloon measurements), say for 120 years, weather stations data is the best we have, and it should be rectified to become reliable source of information.
If you are asking if US weather station data (2% of surface) is indeed representative sample of global surface temperature, rough comparison of 28 years of global lower troposphere satellite measurements with 28 years of surface stations measurements indicates that yes, two data sets are highly correlated.
See my new post on this, which fully resolves the anomaly discussed in this post. I’m diverting comments to the new post by terminating comments here.