Rob Wilson (by email) has drawn my attention to the SI to Esper et al 2012 SI, which contains the following diagram relevant to late Holocene treeline changes.
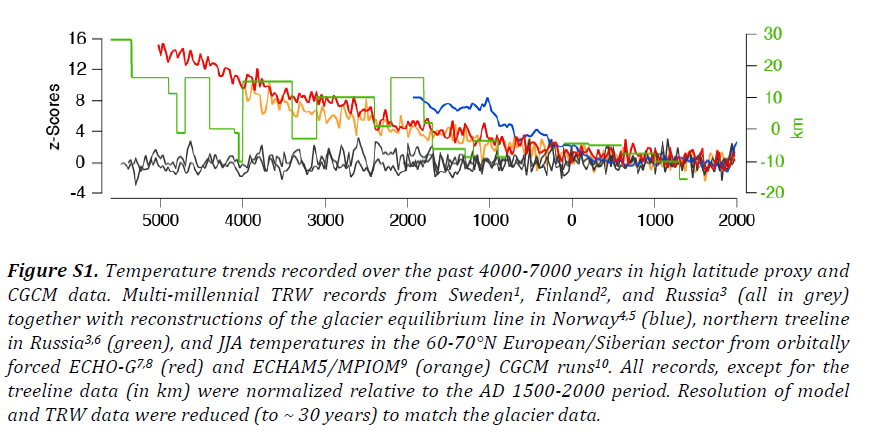
Figure 1. From Esper et al 2012 SI.
Esper et al 2012 noted:
(1) that there had been a substantial decrease in high-latitude NH summer (JJA) insolation on a millennial scale, with a decrease even since Roman times of about 6 wm-2;
(2) since many canonical NH proxies (e.g. Yamal, Tornetrask) responded to summer (JJ) temperatures, the Milankowitch-scale changes in forcing ought to be represented in the proxies.
In the diagram above, the declining JJA insolation (due to Milankowitch orbital changes) is represented as summer temperatures in the ECHO-G and ECHAM climate models( red and orange), both unnecessarily and pointlessly converted to z-scores.
The latitudinal treeline at Yamal (green) and the equilibrium altitude at a Norwegian glacier (blue) both show retreats that are coherent with the declining JJA forcing. Other proxies do as well: e.g. Agassiz ice core d18O and high-latitude ocean alkenone series.
On the other hand, ultra-long tree ring width chronologies (black), including Yamal, have negligible millennial-scale variability and do not record the dramatic changes in JJA insolation and estimated summer temperatures.
In my opinion, these points are shown more forcefully in the above diagram than the ones in the article itself. It’s too bad that they consigned this graphic to the SI where it is easily overlooked (as in my case.)
It’s also interesting that the Holocene treeline series in the graphic is from Yamal itself.
From time to time, I’ve recommended Esper et al 2012, which, almost uniquely among paleoclimate articles in the past few years, contained novel insight into paleoclimate proxies.


