Although climate scientists keep telling that defects in their “hockey stick” proxy reconstructions don’t matter – that it doesn’t matter whether they use data upside down, that it doesn’t matter if they cherry pick individual series depending on whether they go up in the 20th century, that it doesn’t matter if they discard series that don’t go the “right” way (“hide the decline”), that it doesn’t matter if they used contaminated data or stripbark bristlecones, that such errors don’t matter because the hockey stick itself doesn’t matter – the IPCC remains addicted to hockey sticks: lo and behold, Figure 1a of its newly minted Summary for Policy-makers contains what else – a hockey stick diagram. If you thought Michael Mann’s hockey stick was bad, imagine a woke hockey stick by woke climate scientists. As the climate scientists say, it’s even worse that we thought.
It’s hard to know where to begin.
The idea/definition of a temperature “proxy” is that it has some sort of linear or near-linear relationship to temperature with errors being white noise or low-order red noise. In other words, if you look at a panel of actual temperature “proxies”, you would expect to see series that look pretty similar and consistent.
But that’s not what you see with the data used by the IPCC. You’d never know this from the IPCC report or even from the cited articles, since authors of these one- and two-millennium temperature reconstructions scrupulously avoid plotting any of the underlying data. It’s hard for readers unfamiliar with the topic to fully appreciate the extreme inconsistency of underlying “proxy” data, given the faux precision of the IPCC diagram.
Many of the series discussed in this post, including nearly all of any HS-shaped series, have been previously discussed in Climate Audit blog posts (tag/pages2k) from 2, 5, 10 or even 15 years ago or in tweets from 2019 and 2020 (see here).
The PAGES2019 is not a “random” selection of proxies, but winnowed through ex post criteria. As Rosanne d’Arrigo explained to the NAS panel many years ago: if you want to make cherry pie, you first have to pick cherries.
The PAGES2019 dataset consists of 257 proxies, selected from the prior PAGES2017 dataset consisting of 692 proxies, which had previously been selected from thousands of proxy series accumulated by many authors over the years.
In order to give readers an overview of the underlying data – not the massaged final product, I’ve plotted three batches of 11 randomly selected series from each of PAGES2017, PAGES2019 and then PAGES2019 North American tree rings and then commented on each batch. (The samples were selected by R formula sample(1:K, 11) where K is the size of dataset being sampled.) In each case, there were usually series that I had already studied plus numerous non-descript series, which are notable and important to show precisely because the majority of proxies are non-descript and you need to see this to understand it.
This post will be a work in progress for a few days, as I have some sections on special issues that I will try to add as I have time.
A First Batch: PAGES2017 Proxies
As a first illustration, below is a random sample of 11 PAGES2017 series. The series carried forward to PAGES2019 are in blue. For reference, the IPCC curve is shown in red. As you can easily see, most of the series are non-descript and short. Only one series in this sample (Cape Ghir temperature alkenones) has a hockey stick shape, but it goes down.
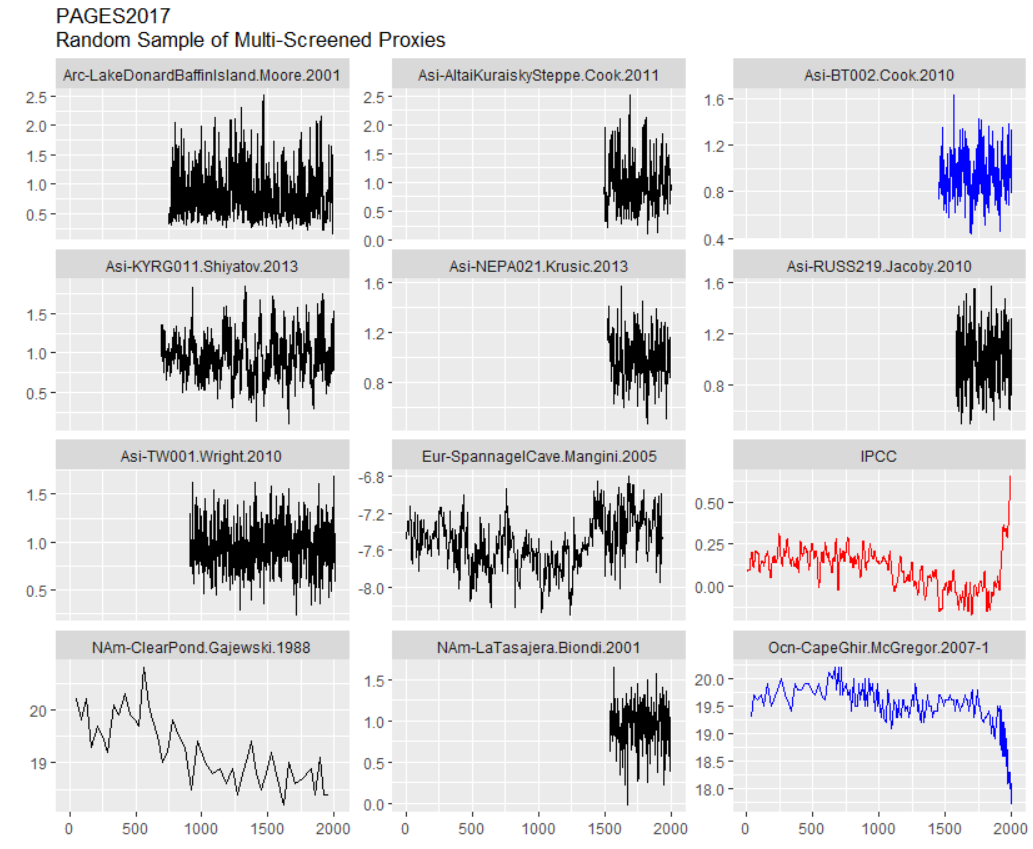
The Cape Ghir series, shown above, is in deg C, but has an obvious problem: it goes down. (See prior Climate Audit discussion of Cape Ghir alkenone series here). And this is not a case where the raw proxy measurement has an inverse relationship to temperature (e.g. coral Sr or coral d18O), but a case where the temperature estimate from the proxy goes down. Alkenones are a very unique proxy because there are widely accepted formulas for converting alkenone measurements directly to deg C. Alkenones are widely used to estimate ocean temperature in deep time, yielding consistent estimates for millions of years. This is totally different than tree ring measurements, where ring widths have first to be adjusted for age and location, prior to trying to develop an ad hoc local formula to estimate local temperature from a sort of average of ring widths.
Precisely why local Cape Ghir (offshore Morocco) temperatures were going down is somewhat of a quandary. Rather than figuring out this quandary, Neukom and the woke just turn the series upside down, following the example of Upside Down Mann by orienting the series according to its correlation with target instrumental temperature, even in their “CPS” reconstruction – a technique that is normally resistant to opportunistic flipping of proxies to enhance HS-ness of a final reconstruction.
Watch what Neukom et al did with their “CPS” method:

CPS (to my knowledge) in all prior reconstructions by non-woke authors is an average of scaled data that has been oriented ex ante by known properties of the proxy. I.e. it won’t flip over an alkenone temperature estimate simply because it goes the wrong way. But this salutary property is not maintained in Neukom’s bastardized implementation of CPS – a bastardization that ought to have been resisted by reviewers somewhere along the line. PAGES2K produced temperature reconstructions by seven different methods, all of which yielded somewhat similar results to CPS – strongly suggesting that these other methods also flip series like Cape Ghir.
A Second Batch: PAGES2019 Proxies
Here’s a second random sample of proxies, this time all from the additionally screened PAGES2019 subset. Take a look, comments below.

It’s not as though PAGES2K made a composite from 257 series that are two millennia long, all or a majority having a HS shape. One series in this sample does look a lot like the IPCC stick and will be discussed at length below, but the others look very different.
Four of the series in the sample are very short – three of them are actually shorter than the instrumental record. These are all coral Sr or coral d18O series, which make up 25% of the PAGES2019 data set. The extremely short records illustrated above are typical, indeed almost universal, in this class of proxy. They do have a pronounced trend in the instrumental period. This contrasts with the lack of trend that one sees in the two long proxies in the middle column above – a tree ring series from Mt Read, Tasmania (also used in MBH98) and a 1983 ice core series by Fisher from Devon Ice Cap on Baffin Island (also available to 1990s vintage multiproxy studies).
The short coral series do not contribute information to the medieval and earlier periods which one is trying to compare to the modern period. So what is their function? Do they contribute anything other than painting a moustache on the non-descript longer series?
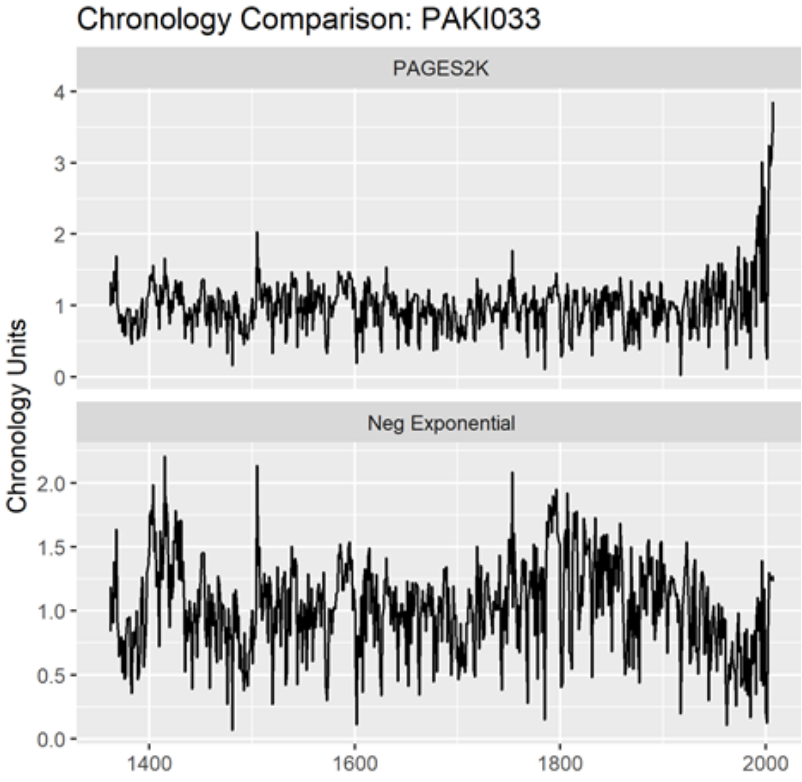
The tree ring series in this sample are rather short; the screening procedures have somewhat concentrated series with slight upticks. (The stripbark bristlecone chronologies that were so prominent in the Mann et al Hockey Stick continue to be used in PAGES2019 – as discussed below.) I discussed the series in the left column with large uptick (Asi_MUSPIG aka paki033) in a 2019 tweet thread here. I located the underlying ring width measurements at NOAA and re-calculated the tree ring “chronology” using standard methodology – see below. The high-frequency details match, showing that the underlying measurement data is apples-to-apples. No chronology from original authors is archived at NOAA: so how did PAGES2K manage to get such a hockey stick? I have no idea.
The most “interesting” series in this sample batch is the borehole temperature reconstruction that has such an uncanny resemblance to the eventual IPCC reconstruction. By coincidence (or not), I wrote about this borehole temperature reconstruction (from WAIS Divide, Antarctica) in February 2019, a few months before publication of PAGES 2019 – see here – scroll down – for a more thorough analysis.
I’ve written multiple posts on the mathematics of borehole inversion calculations, which purport to estimate temperatures for thousands of years into the past from modern day temperatures measured downhole. These calculations require the inversion of a multicollinear matrix (with determinant close to 0). As far as I’m concerned, nearly all the details that specialists pontificate about are a sort of Chladni pattern artifact.
But that’s another story. Here the problem was much stranger. A few years earlier, I had (circuitously) managed to obtain a copy of the code used to calculate this borehole inversion (which is not archived anywhere.) The code showed that they had deleted the top 15 meters of the core from their calculation.
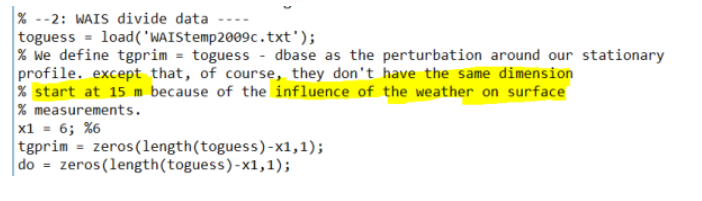
I’ve had a LOT of trouble getting the underlying borehole temperatures for some famous series. (The 2006 NAS panel cited one such result, but the original author (a US government employee) refused to make the data available, and, to my knowledge, it remains unavailable.) However, in this case, the underlying downhole temperatures had been archived, including the values had been deleted. Needless to say, they went down. An inversion using all the data would not have resulted in the impressive Hockey Stick in the PAGES2019 dataset, but a substantial recent decline.

Prima facie, another example of “hide the decline”.
To be fair, as I observed in the earlier post, there is a dramatic seasonal fluctuation in temperatures in the top portion of the Antarctic ice sheet, which makes the already formidable (and probably impossible) inversion problem even more intractable. In my Feb 2019 post, I showed a diagram from van Ommen et al (1999) which showed the dramatic changes in downhole temperature as the seasons changed: a sort of damped sinusoidal pattern can be discerned. In the top 15 meters of the core, seasonal changes dominate.

Note that the blade on the hockey stick in this IPCC series is entirely dependent on the choice of 15 meters as a cutoff point for the borehole inversion. A choice of 20 meters would have probably eliminated the blade altogether.
The fact that the top portion of the core has to be excluded because of seasonal effects also creates a strange irony: the layers at 15 meters at WAIS date back to the 1960s. So IPCC has ended up relying on a series that purports to reconstruct temperature up to 2007, but without using any of the ice core dating from ~1965 to 2007. The calculation is entirely done from ice core layers dated prior to the 1960s. Does this seem reliable to any of you? Doesn’t to me.
Furthermore, the WAIS Divide borehole temperature reconstruction yields a totally different result than the widely replicated and well understood d18O isotope series.
Given the questions and defects surrounding the WAIS borehole inversion series, it is absurd that this series (a singleton, to boot) should be used in a policy-relevant document. That the final IPCC diagram is so similar to this garbage series also makes one wonder about what is happening under the hood of the multivariate calculations.
A Third Batch: PAGES2019 North American Tree Rings
North American tree rings (including some Arctic series) make up ~25% of PAGES2019 proxies. Here’s a random sample.

The majority are short and rather non-descript – nothing like the final IPCC diagram.
There are one series with an enormous hockey stick: Mackenzie Delta (Porter 2013); and two series (“GB [Great Basin]” and nv512) with noticeable closing upticks. Sharp-eyed readers may have already figured out some of this story.
I discussed the Mackenzie Delta super-stick of Porter et al (2013), a new entry to hockey stick fabrication technology, in July 2019 here on Twitter. It comes from Yukon, Canada, an area that, in a 2004 study by d’Arrigo et al, had been a type location for the classic “divergence problem” – ring widths going down, while temperatures went up. So how did Porter et al manage to get a super-stick that had eluded Jacoby and d’Arrigo, long-time searchers for hockey sticks in tree ring data and not shy about picking cherries in order to make cherry pie?
They took “hide the decline” to extremes that had never been contemplated by prior practitioners of this dark art. Rather than hiding the decline in the final product, they did so for individual trees: as explained in the underlying article, they excluded the “divergent portions” of individual trees that had temerity to have decreasing growth in recent years. Even Briffa would never have contemplated such woke radical measures.

To be fair, Porter et al’s original article showed both the actual (non-descript) chronology from all trees, together with superstick resulting from “hide the decline” on individual trees: the decision to use the spurious superstick belongs to Neukom and PAGES2019.

Stripbark Bristlecone Chronologies
As noted above, sharp-eyed readers may recall the identifier nv512. It is one of the classic Graybill stripbark bristlecone chronologies (Pearl Peak), which we had observed to dominate both the MBH98 PC1 and the final MBH98 reconstruction. It (and other key stripbark sites) was listed in McIntyre and McKitrick (2005 GRL) Table 1:

Readers will also recall that the 2006 NAS Panel recommended that “stripbark” chronologies be “avoided” in temperature reconstructions. Although the climate community has professed to implement the recommendations of the NAS Panel, they are addicted to stripbark chronologies, the properties of which are well known. Five different PAGES2019 series use stripbark bristlecones (three from original Graybill versions): nv512 (Pearl Peak); nv513 (Mount Washington); ca529 (Timber Gap Upper); SFP (an update of San Francisco Peaks, incorporating az510) and GB (a composite of Pearl Peak, Mount Washington and Sheep Mountain, using both Graybill and updated information).
In 2018, I looked at how North American tree ring networks had changed since MBH98. The one constant was the addiction of paleoclimatologists to stripbark chronologies- a phenomenon that I had commented on long before Climategate (citing Clapton et al and Paeffgen et al), much to the annoyance of dendros, but the comment remains as true now as it was then.
South American Proxies
add
Other Proxies
add
Conclusion
I discussed many of these problems in July 2019, within a couple of days of publication of the underlying article (see here). While I don’t necessarily expect IPCC reviewers to be paying rapt attention to my twitter feed, one surely presumes that IPCC climate scientists, who are employed full time on these topics, to be competent enough to notice things that I was able to observe in my first day or so of looking at PAGES2019. But their obtuseness never ceases to amaze.
Here is the IPCC diagram. Curiously, this leading diagram of the Summary of Policy-Makers does not appear in the Report itself. (At least, I was unable to locate it in Chapter 2.) However, it is clearly the progeny of PAGES2K Consortium (Nature 2019) and Kaufman et al (2020), both of which I commented on briefly on Twitter (see here).


112 Comments
Thanks!
Yet again.
> But their obtuseness never ceases to amaze.
Hmmm. Isn’t arguing from personal incredulity considered an logical fallacy?
He wasn’t arguing from it, he was arguing to it.
Steve, I agree that the borehole reconstruction is particularly problematic. I see a lot of things like this where essentially ill-posed problems are solved without proper accounting for the uncertainty. And the extrapolation forward in time is totally unjustified.
dpy6629,
Exactly.
Jerry
You don’t think that a single data point wildly extrapolated is proof?
😮
Standard for MSM these days, and idiots like the doctor in southern BC who claimed the death of one customer during the heat wave last June was caused by ‘climate change’ – he wrote that in the hospital records.
She was elderly with substantial health problems.
Meteorologist Cliff Mass explained the heat wave and why it is not the result of global warming – just a stackup of conditions/events, rare but explainable. https://cliffmass.blogspot.com/2021/07/was-global-warming-cause-of-great.html
That doctor is not professional. He should focus on educating people about risks, while high temperatures re unusual in the area people die regularly from accidents. And get into serious health problems from bad diet such as anorexia and alcohol.
Thanks for the update
Nice response for those that point out ” Mann’s hockey stick : has stood the test of time with the multitude of reconstructions.
Reconstruction with the same cherry picked proxies!
Steve–
You must be uniquely well-positioned to produce a believable temperature chronology.
Perhaps with supplementary information on why you threw out (or re-flipped) some of the iconic datasets supporting Mann, PAGES et al.
Maybe a GOFUNDME for just this one project?
It is puzzling that Steve has not simply published his own reconstruction at this point. Surely all the necessary pieces to do this analysis are at his fingertips.
The question is, “Where is there an actual temperature proxy?”
In order to achieve a convincing reconstruction of temperature from proxies, you need (in my opinion) to have a “good” class of proxy. “Good” in this sense means (for me) a proxy that is widely replicated, yields consistent results, is minimally subject to cross factors. If you have a network of “consistent” proxies, you won’t need any sort of fancy multivariate method to extract the “signal”: it will be plain as the nose on your face and require nothing more than simple averaging.
At the AGU convention in 2006, I met Valerie Masson-Delmotte, now an IPCC luminary (also a very decent person), who asked me to review an article for CP that was then under assault from Mann. She thought that our critique of Mann and similar studies was convincing. She thought that the field would need to develop new proxies in order to circumvent that critique and that the effort might take 10-20 years. Another similarly prominent scientist, who asked to be anonymous, sought me out to say the same thing.
Fifteen years has now passed and the 2000-year paleoclimate folks are still using the same proxies as Mann was using – lots of tree rings, with a sprinkling of ad hoc and questionable singletons. The lack of progress has been disappointing.
I suspect (but do not know) that Masson-Delmotte’s present view, in her capacity as a private scientist, would probably not have changed much, but, in her capacity as a senior IPCC Working Group official, she is bound by the scientific literature, which continues to produce intellectually turgid material.
So in your view there simply exists no convincing reconstruction of past temperatures, no existing proxies that could even get at the problem, and no possible way of extracting useful information from those existing proxies?
You must be kidding! He has numerous, detailed threads going back to 2005 on all these issues! Is this your first visit to our planet?
Do you truly not understand Steve’s comment of 10:23 am? He has spent years pointing in out in detail how unreliable the data and analysis have been. It remains unreliable and highly troublesome. Based on that, how does Steve now prepare a reliable analysis?
The argument here seems to be that to be a credible critic of bloodletting, you need a better treatment for bubonic plague. This argument has been repeated ad nauseam by defenders of “the science” forever and it has always been fallacious. It is indeed possible that paleoclimate is no better than medieval medicine and Steve has provided a very convincing critique of the field over the last 20 years. What this shows is that progress in science can be painfully slow once “the science” has been accepted as a “consensus.” We are just lucky that Twitter and Facebook haven’t decided that criticism of climate science should be censored, at least not yet.
I do not mean to imply that there is no value in examining existing reconstructions. But surely you agree that following up a critique on bloodletting with your better solution is a much more useful approach. Unless your position really, truly is, “the plague is untreatable.” But of course if scientists thought that way you and I couldn’t be engaging on a web forum right now.
Thanks for the review Steve. Seems fairly remarkable that these same issues keep occurring (or that no researchers comment on their peers unusual methods).
Bruce
Perhaps having delved scientifically into the machinations and hubris of so many Steve feels he lacks the necessary chutzpah for the task?
Your clarity and pointedness is something to behold. You brought back many years of reading Climate Audit.
Can you comment on the centrality of this diagram to the overall Summary for Policy Makers? Is it a throwaway or will dismantling it cast doubt on other aspects of this portion of the Report?
Steve, excellent analysis except for one thing I am worried about. Namely, in IPCC’s Fig 1a the last 170 years appear to be labelled as “observed”, suggesting that they have spliced observed temperatures onto the end of proxy temperatures. That may be a bad thing to do, but if true it would mean that their hockey stick is not produced by the bad proxy analysis which you have analyzed.
Perhaps I am wrong, but either way please can you clarify on this point?
Go fund me seems to be a good slogan. I have read your post in detail and can not see any arguments that weakens the main conclusion in MHB98. You can get as angry and upset as you want, but I think it’s pretty certain and true that global temperatures have not been higher now than in the last couple of thousand years. I had the same discussion with Curry on Climate.etc, why should the temperature be higher 1000 years ago or 2000 years ago? I’m all ears.
Rune, I wonder where you get that certainty from? Anyway, the bigger argument is to compare with 8000 years ago, at the Holocene Climate Optimum, which nearly all proxies show to be warmer than now, and yet humanity somehow survived that and there weren’t any tipping points. Unless of course you think Noah’a Ark took place in 4004BC or something.
it depends on whether you are interested in these studies as science or as slogans for conclusions.
At the time, we observed that MBH could not draw conclusions about relative warmth of medieval and modern climate based on their data and methodology. We explicitly said that this did not prove that medieval period was warmer than modern modern period.
Mann’s principal components method was clearly invalid. Mann’s reconstruction did not have the claimed statistical skill: in fact, Mann concealed a key verification statistic which, if disclosed, would have revealed the lack of claimed statistical skill. Mann’s reconstruction also depended integrally on very problematic stripbark bristlecones, which even the NAS panel, said should be avoided in temperature reconstructions.
None of these points is really debatable any more.
As I’ve observed on other occasions, there is substantial evidence of NH cooling since the Holocene Optimum about 8-10000 years ago, continuing right to the 19th century. Fortunately, this trend was reversed in the 20th century. We should be grateful for this warming, especially in Canada.
“We should be grateful for this warming, especially in Canada.”
Indeed. Rarely is it discussed in the media that we actually live in an ice age, towards the end of an interglacial, and that the climate left to itself is most likely on its way into another glacial period. We don’t know if the CO2 we have emitted can either postpone or prevent the onset of the new glacial period – if we are very, very lucky then our CO2 emissions will at least postpone the onset, since a glacial period would be nothing but a disaster for human kind.
> We should be grateful for this warming, especially in Canada.
Should Canadians be grateful for the warming that’s coming, and does that impression rest on anything else than opinion?
There is a very simply question which climate science refuses to answer: What is the optimum earth temperature for humanity?
Until that is answered, none of the rest of it matters very much.
So you want to Make Climate Great Again? I can’t say that I’m surprised that you’re carrying that banner. Only problem is that it wasn’t so great in the past. Especially if you were in Canada.
> So you want to Make Climate Great Again?
Your caricature is duly noted, Auditor.
But no – I want you to tell me if Canadians should be grateful for the warming that’s coming. That’s why I asked “should Canadians should be grateful for the warming that’s coming.”
I’m sure you enjoyed your vacations in BC this year.
> There is a very simply question which climate science refuses to answer
Since you believe this question is critical, Mike, surely you must have researched it.
Where’s your homework?
Seeing as there are more humans in the world, than ever before and still increasing, then the ideal temperature has not yet been reached.
Comparing 420ppm CO2 (2021) to 280ppm (1850)
1) Less extreme daily and annual temperatures, expanding planetary habitability zone.
2) Global support to photosynthesis, making crops grow faster, longer and in less hospitable conditions, including dryer.
3) Mitigation of the risk of runaway reglaciation, as was more probably under 280ppm in the event of a super volcano, asteroid strike, solar minimum, slowing of the global conveyor, or any sudden cooling.
4)Overall increase in precipitation, increasing fresh water supplies.
Liabilities:
1) Increased tropical cyclones and intensity. — No statistical evidence as of yet.
2) Increased wild fires. — solved with better forest management.
3) Acceleration in sea level rise — No statistical evidence as of yet.
4) Ocean acidification – No evidence as of yet.
5) Less nutritious food – Mitigated with fertilizer of genetic modification.
Do you think Canadians should be grateful for the warming that’s coming, Ron?
I am grateful I had wise people teach me how to be grateful, by remembering to count blessings received, not for ones anticipated.
Willard, if you meant to ask if Canadians and Scandinavians should feel guilty for the blessing of milder winters and longer growing seasons because it resulted from the advancement of civilization I would say the answer is no.
Should humanity feel guilty if it inadvertently postponed the natural glaciation schedule? Of course. Because nature is good, humanity bad (and ungrateful). To believe the opposite would be to advocate for what I have heard Judith Curry call a “no regrets” policy.
One would have to assume that your expression of hostility is a deflection from any obligation to answer to your own question (whether conscious or not).
I’m not the one who claimed that “we should be grateful for this warming, especially in Canada,” Ron.
Given my scotch and french ancestors migrated south from Canada to the warmer climate of New England that many of my countrymen consider “too cold” to live in, I would say, YES, Canadians should be grateful if their future climate is warmer. They will have more arable land, longer growing seasons, greater drought tolerance in their crops, greater crop productivity, more open coastline, less costly resource operations in the winter, fewer climate deaths (since far more people die from cold than from heat), among many other benefits. Canadians should be not just grateful, but happily throwing the dirtiest coal on the fire.
Canadians can’t seem to make up their minds whether CO2 has no effect or whether it does produce warming and that is good. Either way it is part of a more general principle we observe in regard to vaccination or trying to democratize Afghanistan. People don’t always act in their own self interest or for the benefit of the people in general. People like cats are difficult to herd. People have beliefs, allegiances, phobias, and other aberrations, and every discussion of climate I have seen is colored by this effect.
Ron,
No. I meant to ask if Canadians should be grateful for the warming that’s coming.
That’s why I ask “do you Canadians should be grateful for the warming that’s coming.”
No need to beg that question or to try to spin it so to please the peanut gallery.
Willard, I answered the politically relevant question. The climate justice movement preaches that humankind is doing injustice to the climate, and that any natural disaster can thus be laid at the feet at wealthy consumers and their ancestors. I see that thinking as not much different than past humans giving personification to the stars with mythology and power over our lives with astrology. Morals and justice are concepts reserved for the impacts on animate beings. Mother Nature does not care if humans postpone otherwise inevitable re-glaciation. Do humans have a responsibility of good stewardship of the environment for the benefit of all creatures, future and present? Yes.
Your more dull question is: “Do you think Canadians should be grateful for the warming that’s coming?” The Inuit and Yupik people of Canada do not want milder winters if Robert Way’s opinion is a representative voice. As for Canadians of European descent, I think most would want milder winters.
Yupiks live in Alaska and Siberia.
Ron,
You didn’t answer my question, but are using it as a springboard to peddle Freedom Fighter’s crap.
This is the Auditor’s, not Judy’s.
Please desist.
Willard, you have made a half dozen comments and are yet to make a point. Since being a climate blog commenter seems to fill a lot of your time one would think you could offer us more. Maybe you could share a unique insight about the climate justice movement’s point of view, for example. Is warming in Canada an injustice if partly or completely caused by fossil fuel CO2? Is it injustice that not everyone is happy with the climate? Should sea level threatened Pacific islanders get refugee immigrant status in rights to the country of their choosing? Or, should they get a cash payment from a UN pot funded by western country’s pledges? Should China pay? What if it turns out there is cooling; should they pay the money back? Who decides what deal each country gets? Should strings be attached for practicing good policies? Who decides what are good policies? Can whatever is developed be used as a framework for settling other historical injustices like slavery, invasions and whaling?
Ron,
I made many points, all related to a main one.
The main point is this one:
The claim that “Canadians should be grateful for the warming that’s coming” needs to be substantiated. Other points include that you are using me as a springboard to peddle Freedom Fighters talking points, and that you are trying to reverse the burden of proof.
I have yet to underline that you have probed my mind.
You know, people dislike being used. They tend to feel when they are. If you insist, I *will* illustrate that point by asking you about the odds of a Canada under ice in the incoming centuries.
I do hope you don’t need to ask me why I ask.
Good night.
Yes, Canadians should be grateful for the warming that is coming: https://www150.statcan.gc.ca/n1/pub/91-209-x/2017001/article/14793/c-g/fig11_eng.gif Willard alluded to the BC heat event this past June. That was mainly a weather event, with a minor boost from global warming. The main claim was that there were 600 extra deaths in BC (NYTimes), almost comparable to the winter COVID surge. The people who make those statistical arguments never present the statistics of winter death that occurs year after year, regardless of COVID or flu. That is 10% extra death in winter months in the US, 15% extra in Canada, plus 5% more in bad flu or COVID years.
The counterargument that people are stuck indoors, that it’s not the cold per se, does not really hold water.. There is a clear relationship from low dew points to the extra death. Unlike heat waves, winter death is not a short term displacement (i.e. lots of excess deaths are not immediately followed by a decrease in deaths)
I doubt the average daily number of deaths by month in 2013 could help Canadians decide if they want more heath waves, more floods, and more extreme events in general, Eric, and you’ll freeze to death whether it’s -15 or -17 outside.
The claim that “Canadians should be grateful for the warming that’s coming” needs to be substantiated.
Well you were the one who said it, not Steve. He’s not in the business of predicting the future state of the climate.
Physician, substantiate thyself.
Here you go, Roger:
Must be a slow day.
Most of the Holocene has been warmer than now. The Eemian Interglacial was even hotter, with a forested North Cape above 71 N latitude and hippos swimming in the Thames at London, without benefit of a Neanderthal Industrial Age.
The millennia-long Holocene Climatic Optimum, interrupted by the 8.2 Ka meltwater-driven cold snap, was balmier than today. The Egyptian Warm Period was about as toasty as the HCO. The distressing trend thereafter however is worrisome. The Minoan WP peak was below the Egyptian, the Roman WP lower than the Minoan and the Medieval WP still less ideal.
The Modern Warm Period has yet to enjoy a single 50-year interval with weather as nice as three such half centuries during the Medieval WP. But we might yet luck out.
The decade just past in the US was cooler than the 1930s. Earth has been cooling since February 2016 super El Niño peak, with no let up in sight, given the high likelihood of a renewed La Niña later this year and next.
Earth cooled dramatically for 32 years from the end of WWII until the PDO switch in 1977, despite steazdily rising CO2. Then it enjoyed slight warming until super El Niño of 1997-98, after which the trend in average global temperature stayed flat until super El Niño of 2015-16, since shich, as noted, the trend has been down. All these ups, downs and sideways, again, despite relentlessly increasing plant food in the air, which has greened our planet.
Independent Science should try with Gofundme while the con-sensus keep being fed with big government and invested private grants? Truth is not constrained by the most votes and thus Science neither. IPCC means Intergovernmental Panel for CC, and their mission was solely to look at any anthropogenic warming for political reasons. Natural causes, many with wavelengths of centuries or millennia are of no interest to politicians or ideologists: they want power now. Wake up.
Astounding!! People STILL defending MHB98 in 2021… what part of “poor data, bad methodologies” do you still not understand? And those self same issues are still alive today with the most recent work, as Stephen McIntyre points out above. Anyone with a modicum of scientific understanding can appreciate the glaring issues with this stuff.
It is pretty certain that the global temperatures were higher in the past 2000 years – and higher still in the period between 8000 and 3000 years ago – very likely significantly higher than today. The evidence is there – unless you choose to ignore it.
–“Why should the temperature be higher 1000 years ago or 2000 years ago?”–
That question borders on trollery. I’d be surprised if Curry wasted much time responding to it.
The question “why” must be preceded by the question “if”.
The IPCC and company are performing backflips as Mr McIntyre and others have been documenting for years to explain that temps weren’t higher 1-2000 years ago.
As any lawyer can tell you re the rules of evidence, such gyrations are grounds for at the least doubting and probably dismissing as evidence any work product produced by the various sleights of hand. And that is obviously because, if temps actually were lower then there would be no need to scrupulously exclude those series which eliminate the hockey stick. That they do is prima facie evidence their numbers, graphs, conclusions and methods are at least incompetent and probably intentionally misleading.
The complexity of climate and the myriad influences upon it means no one has a clue why or why not the temperature should be higher or lower 1000 years ago or 2000 years ago or 1000 or 2000 in the future.
The proxies they use for the past and the way they use them have been shown faulty time and again. The models they use to project future temperatures have diverged so far from reality that even so worthy a warmista as Gavin Schmidt admits they are implausibly and increasingly high, are broken and need to be fixed.
If someone can’t get the near and far term past nor even the near term future right, how have they demonstrated the skill or competence to be taken seriously? That their lack of humility causes them to continue the same mistakes, refuse to admit them and declare themselves more certain of the future as they demonstrate little and possibly diminishing skill at backcasts or forecasts indicates not only a lack of seriousness, but increasingly a lack of good faith.
As “any lawyer”, I absolutely agree!
Reblogged this on Climate Collections.
Reblogged this on ClimateTheTruth.com.
Steve: In general, proxies have value because they provide Ph. D. students with data to write their dissertations (LOL). Your studies have revealed that the relation of proxy data to the real world is usually ephemeral, and when scientists with a preconceived agenda pick and choose proxies to prove a preconceived point, the proxies actually subvert science rather than contribute to it. Proxies work under two basic assumptions: (1) That during a limited period when good data is available, the proxy agrees with the data, and (2) There are valid reasons to believe that extrapolating that relationship to eras when no data is available to derive data from proxies is justified. In my studies, I examined many proxies and found a severe lack of support for both assumptions. Soimilarly, I regard your work as proving that many proxies don’t work, and that some prominent scientists pick and choose proxies for their private agendas. But the fact remains that global warming is real and problematic. Whatever the truth is about global temperatures over the past two thousand years, and I don’t believe any of the estimates, it is getting hotter, much more in the north (as expected), mainly due to greenhouse gas emissions, with some exceptions (as you point out) and we don’t really know how far it will go.
Donald,
Your words are OK until you get to the bit about “mainly due to greenhouse gas emissions” which many regard as fundamental to the climate change script.
Greenhouse gas guesses suffer, however, from a lack of calibration, just as many proxies do. (e.g. I have written before about Cook’s tree rings in Tasmania lacking an adequate weather station for local temperatures).
You might like to think about why there has again been no pregress, by AR6, with a valid number for climate sensitivity. Even the sign remains unclear, it is not established which factor drives which, a zero value has not been excluded and the very high ECS estimates of AR6 are hard to reconcile with past reality.
Hi Steve, yours is yet another welcomed contribution. Geoff S
Geoff: I think that the various estimates of the “handle” of the “hockey stick” are pretty much worthless but that doesn’t mean that the “blade” isn’t rising. See:
You missed this in a comment above by MilodonHarlani: https://climateaudit.org/2021/08/11/the-ipcc-ar6-hockeystick/#comment-804769
The truth is that long term temperature reconstructions from various Antarctic or Greenland clearly define that the Earth has been cooling for thousands of years.
Even the hottest temperatures nowadays are preceded by warmer temperatures earlier in the Holocene. The Modern era is still cooler than the 1930s were.
Individual temperature records across America, Australia, Europe show a temperature decline since 1998.
Alleged increased global temperature anomalies are derived from including temperatures from previously and often currently sensor sparse regions; e.g., Siberia, Central Africa, Arctic and Antarctic. Regions with no recorded temperature history and where current “high temperatures” are smudged in from temperature sensors up to 1,200 kilometers away.
Global warming is fictitious and clearly described by UN, UNFCCC and IPCC senior executives as methods to force richer governments to “share the wealth” and to force republics, democracies and monarchies under an unelected Euro socialist style government where citizen are serfs and peasants to support the elites.
The world has been cooling since the end of the Minoan Warm Period. Soil radioisotopes show that the massive East Antarctic Ice Sheet, repository of most of Earth’s fresh water, quit retreating about 3000 years ago.
As in the rest of the planet, the Roman and Medieval WPs, ~2 and 1 Ka, were cooler there than the Minoan and Egyptian WPs, ~3 and 4 Ka, and the HCO, ~8 to 5 Ka.
The trend is not our friend. We can’t burn enough fossil fuels to cancel out the mighty, relentless Milankovitch cycles.
I can go to any number of blogs, and read the claims of self-appointed experts that CO2 has no effect on climate and that we are in the midst of a cooling trend, and what the heck, let CO2 rise into the thousands of ppm, we don’t care. I can also tap into the establishment position that the climate is extremely sensitive to CO2, that warming is getting out of control, that every single flood or fire is due to CO2, and that the end of civilization is near. And those opinions will be repeated over and over again relentlessly as the years go by and the contrary evidence mounts. But the data and analysis that is credible to me, tells me that CO2 (along with other factors) does exert a strong influence on climate, at some presently undefinable level intermediate between the zero of the self-appointed exerts, and the extreme of the politically motivated establishment. I have documented all that in a 600 page book. I would have to conclude that the claim “global warming is fictitious” is the view of someone, to be charitable, who is misguided.
I didn’t claim that global warming is fictitious, just that any human contribution is negligible, as shown by all actual physical evidence, as opposed to GIGO computer games.
Earth’s average temperature, to the extent that it can be measured, is warmer now than 160 years ago, at the end of the Little Ice Age Cool Period, but most of the climatic amelioration occurred before 1940, hence was driven primarily not by human activity. From 1945 to 1977, Earth cooled, despite rising CO2. Some of the late 20th century warming was due to cleaner air, but China and India are reversing that trend.
People do affect local and regional climate by deforestation, irrigation and paving cities, etc, but our effect globally is demonstrably insignificant. The naturally-caused early 18th century warming cycle, coming out of the LIA depths during the Maunder Minimum, was stronger and lasted longer than the late 20th century warming, supposedly primarily thanks to CO2 released by human actions.
In the short term, our planet has been cooling since February 2016, and liable to keep doing so at least into next year, if ENSO predictors pan out. Between 1997-98 and 2015-16 super Los Niños, Earth’s temperature trended flat. So there has been no statistically significant warming in this century, while CO2 has steadily increased, greening the planet.
It’s annoying how widely this graph gets disseminated, by those who think it goes through decent quality control procedures.
It was featured on the Australian Broadcasting Corporation finance report here (10 August):
When I saw it I immediately recognised the zombie hockeystick had arisen again. The figures used in these finance reports are usually pretty good, but not this time, so how is the average person supposed to tell?
I also noticed that this recent IPCC report has relegated natural drivers of climate to +-0.1C, and internal variation to +-0.2C since 1850, a perfectly circular and redundant set of figures massaged to cancel out in order to amplify the human effects, and which is consistent with the underlying procedure in the graph above-designed to smooth out all natural variation.
Science as an human institution has quality control issues that need to be addressed.
The level of dishonest data distortion just keeps getting worse. Researchers pile new distortions on old ones, and become ever-more dishonest as they disregard more and more demonstrations of error.
Another thing that gets me is, the final result is so clearly unbelievable. The latest graph has now abolished both Dark Ages cooling and the medieval climate optimum, which were well established before the IPCC came along and which can still be seen consistently in hundreds of records. The result is to claim that present temperatures are close to 1 degree warmer than a thousand years ago at the peak of medieval warming, contrary to the evidence of numerous long-term individual proxies.
The “sidebar” to the graph also implies that current temperatures exceed the “warmest multicentury period in more than 100 000 years”. Does anyone with real expertise in this field believe that the world is now warmer than the Holocene climate optimum of 3000-8000 years ago – I doubt it.
The key to these highly implausible results is to minimise the fall in temperatures just before splicing on the “instrumental record”. The latest version does a superb job of this, restricting the cooling from the late first millennium to the little ice age to only about 0.3 degrees – a new low in both size and credibility.
Steve, I’m just wondering whether you missed my comment on Aug 11 4:16PM about the possibility that IPCC have SPLICED a thermometer record onto the end of the proxy record, producing a hockeystick by different means?
The new hockey shtick in AR6 does graft instrument “observations” from AD 1850 to 2020 onto proxy “data” from AD 1.
https://www.realclimate.org/index.php/archives/2021/08/a-tale-of-two-hockey-sticks/
Thanks for that link to a RealClimate posting by Mike Mann. However, I don’t see how it gives any more information on the inferred grafting than is present here in the graph at the top of this article?
Their HS appears to be a composite of 7 different PAGES2019 reconstructions from same data using slightly different methods, which have many defects, but brute force splicing temperature is not typically one of them. The only one of the seven where brute force splicing may have occurred is in their implementation of the Mann 2008 method, which does in effect splice temperature data.
However, something very similar is happening when they do correlation-weighting. If you recall the OLS regression formula (X^T X)^(-1) * X^T y, the vector X^T y is correlation weighting times a constant. If the left matrix is I instead of (X^T X)^(-1), then you get correlation weighting. Some readers may recall the left matrix in ridge regression is sum of two matrices of this form (X^T X)^(-1) + lambda*I) – so correlation weighting is an extreme form of ridge regression. There’s a similar stepwise path in correlation space as more eigenvectors are retained in inversion.
We know from OLS regression that one can get a “perfect” fit in a calibration period of 151 rows even from white noise if one has more than 151 columns. However, the resulting reconstruction is meaningless. As one moves away from OLS matrix transformation via (say) ridge parameter, the overfitting becomes less extreme, but remains problematic.
My surmise on the various PAGES2019 methods – even the bastardized CPS – is that the blade results from the implicit overfitted inverse regression of instrumental temperatures onto a matrix of 258 or so columns. This explanation is necessarily heuristic, but I’m confident that it’s correct.
I’ll go with that then 🙂
One omission at a dramatic moment:
>including the values had been deleted
needs a ‘that’.
It’s quite astonishing that after all of this time and with all of the funding thrown at climate science by governments, corporations and non-profits, or should that be non-prophets, that there has been no improvement in the development and implementation of long climate graphing from the IPCC, and the fact that they reuse and repeat the same woeful mistakes that have been documented here for the last 15-plus years. As for myself, I have recently been much more interested in the very long term climate story of say the last 600 MY where the present warming in the midst of a glacial period can be put into proper context.
Rapid warming at the end of the Eemian interglacial casued sea level to rise several meters, just before ice age returned:
Just saying …
Like a dog returning to its vomit, the IPCC incredibly return to the utterly discredited Mann hockey stick. It’s clear the science no longer matters – if it ever did.
Congratulations on an excellent, very informative and timely article, Steve.
Nic Lewis! I was wondering if you were going to be available to comment on the AR6 conclusion that the likely lower limit for ECS is now up to 2.5. Did they include your work, did your work ultimately reach other conclusions than I had thought, what exactly happened? Thanks!
Hi Nic, I recently stumbled across a very long paper on ECS (from perhaps 2018 if memory serves) featuring perhaps 40 authors that went over all the evidence including a long section on historically constrained estimates that reached a conclusion of 3 C as a median value. Just wondering if you had seen it and had read it.
Dave Young
Super! A great start and I’m very much looking forward to further posts like this.
Don’t throw the baby out with the bathwater. The facts that (1) Mann and his henchmen phonied up the estimate of millennial temperature change, and (2) the climate models are mainly too cute to be of much value, does not mean that CO2 does not produce warming, and it does not mean that we are not in the midst of a warming trend driven by CO2, and it does not mean that we shouldn’t be concerned about rising CO2. While extreme deniers revel in every exposure of deceit by alarmists, that does not change the fact we are warming, and we don’t know where it will all end up.
Yeah, and all the scandals by Catholic priests does not mean that global disasters aren’t evidence of god’s wrath.
“that does not change the fact we are warming, and we don’t know where it will all end up.”
One of the great downsides of global warming is supposed to be coastal inundation by rising seas. I believe that the West Side Highway in NYC was supposed to be nearly underwater by now as per Hansen in 1988. It’s not, even though CO2 continues its unabated rise and ‘temperature are rising’.
https://tidesandcurrents.noaa.gov/sltrends/sltrends_station.shtml?id=8518750
Since precisely nothing untoward has happened in 33 years why exactly should anyone place any credence in any of this nonsense. And if you would like I’d be happy to place any wager of any magnitude over any future timeframe for the sea level rise to catch up to prediction. I won’t hold my breath on the last one since no one predicting catastrophe has ever been willing to stake a penny of their labors on the outcome.
Steve’s deconstructions of the various hockey sticks are just additional evidence that the entire enterprise is nothing more than.an exercise in some kind of political power grab.
Donald, looks like you responded to a spambot. Good job.
As for not knowing what will happen in the future, welcome to reality. We’ve never known, and likely never will. Adaptation is our forte, and the only sensible course of any climate action that many be needed.
Yes Jeff, as you and your tribe members think, there are international conspiracies that try to persuade the public that there is global warming and that there is a corona virus pandemic, both of which I am sure you deny. You are most likely unvaccinated and you will get the “Delta”. But on the other hand, you guys up in the far north can’t seem to make up your minds whether you believe in global warming (its OK because you relish warming in Canada and who cares if the world suffers) or whether you deny global warming and expect to stay cold.
> its OK because you relish warming in Canada and who cares if the world suffers
You might like:
https://archive.ph/mhbQN
Willard: Thanks for the link. Interesting. Here are a few links for you:
http://www.drdrapp.com
Donald Rapp:
I believe in global warming but I am not scared of it. I don’t think it’s going to kill me. I may be wrong.
I believe in Covid-19 but I am not scared of it. I don’t think it’s going to kill me. I may be wrong.
Global warming has a very low fatality rate.
The delta variant, concocted in part of the old British Empire and endorsed and passed on by we Brits, has a very low fatality rate.
I am more scared of what my government, and many governments, are doing in order to be seen to be doing something about global warming and Covid-19. I wish they were as astute as another great Brit, King Canute, who realized how powerless he was in the face of nature.
Canute was Danish, born in Denmark to a Danish prince and probably a Polish princess.
“Yes Jeff, as you and your tribe members think, there are international conspiracies that try to persuade the public that there is global warming and that there is a corona virus pandemic, both of which I am sure you deny. You are most likely unvaccinated and you will get the “Delta”.”
And you would be wrong. In fact you are wrong. You made a couple assumptions and only you are the resulting a$$.
I’m fully vaxxed with Pfizer, have been for months.
I don’t think “global warming” (I thought it was supposed to be climate change?) is a hoax. I think the alarmism is completely unfounded. There is no evidence to support the idea of a “climate catastrophe”. There is absolutely no doubt that many organizations and politicians around the world are using this fake emergency to control people.
And articles such as these by Steve just make me wonder where the real scientists are?
“its OK because you relish warming in Canada and who cares if the world suffers.”
I did not see Jeff address this. I am guessing that Jeff indeed lives in Canada. 🙂 Don’t feel guilty because… Donald, if you’re fighting the summer heat right now in a warmer latitude, and the assumption behind your comment is that CO2 climb has led to higher summer highs rather than mostly milder northern winters, you would be wrong. I know you know this because you taught me this. I just don’t want you to fall into the propaganda that you have fought so many years against. There abuse of the climate’s natural variability for political gain by the political, which sadly includes many IPCC authors. Tree ring proxies are a joke. There is no way to know what confounding growing limitations a particular row of trees experienced 200-1000 years ago. And if they do not respond to warming after 1960, or wherever they diverge from observed temperatures, there is no way to know if they would ever have responded to a warm period in the past, like the MWP. Worst of all, the trees are cherry-picked for their “correct signal.”
I’m not in Canada, Ron. But close. I’m in the northwest corner of Washington State. 🙂
Brilliant
Clarification of my previous comment No. 25.
My comment “brilliant “ was my assessment of Steve’s work. It was not aimed at the comment below No. 24 by Donald Rapp, which I had not read when I commented.
“Second, this composite is scaled to the mean and standard deviation of the reconstruction target over the calibration period.”
Does this attenuate possible warm/cold signal in the past? Assuming the composite contains some noise
Always good to see a new post.
I remain astonished at how poor the methodology used in paleoclimate studies is. We all know they’ve seen what you’ve written. Do they just not care?
typo: In first sentence “keep telling that defects” you should insert “us” between “telling” and “that”.
After correcting that, you may delete this post!
Thank you,
–Ben
Out of curiosity, have you collated the data all for the “proxies” into a single table/data file? When I looked at the material posted for PAGES 2017/9019, I found tables with links to individual files for each series, but downloading/parsing that many files can be a pain, even if you write a script to do it. it’d be a nice convenience to have all the series in a single file.
Yes. I’ll post a copy up at climateaudit.info. Would be interested in your thoughts on this.
also, despite efforts of PAGES2K to improve metadata, I think that their digression into LIPD format has been a wrong turn. One still needs flat tables showing concordance of shifting identification codenames to site names and original data. I’ve spent an inordinate amount of time on such concordances over the past few years and make “info” spreadsheets to keep track. For example, I typically have to grep name in info file to look up P19 code to extract precise proxy. My info sheet tends to be work in progress at any given time.
see http://www.climateaudit.info/data/multiproxy/pages2019 for proxy and info.
The proxy data is from https://www.ncei.noaa.gov/pub/data/paleo/pages2k/neukom2019temp/input/proxy_ama_2.0.0_PAGES-crit-regional_FDR.txt. So they do have a collation of it in reasonable format. (Not so for P17)
Their metadata https://www.ncei.noaa.gov/pub/data/paleo/pages2k/neukom2019temp/input/metadata_2.0.0_PAGES-crit-regional_FDR.txt is REALLY crappy. My info sheet is more informative and is needed to sort out which column corresponds to which series. There are some fiddly things that took way too much time.
Awesome.
Off Topic, but a great many links on the various resource pages are dead, such as the ones on this page: https://climateaudit.org/multiproxy-pdfs/
Is anyone on the back end able to fix these?
try climateaudit.info/
Stephen:
climateaudit.info is flagged as not secure.
“Unsupported protocol
The client and server don’t support a common SSL protocol version or cipher suite.”
When I get more round-tuits, I plan to do some major link-updating. I also need to reconstruct the Almagre Adventure photo collection: Google’s online photo store got wiped out. 😦
Well the first diagram is in the full report, page 8, you must not have looked very hard, not only in the summary
You may go down in history as one of the most famous Canadians for your incredible hard work and tenacity, I have no idea how you have kept at this for so long. I do not understand what is the driving force behind these hockey sticks, do the creators really believe they have presented a temperature record that has any significance or relevance to the actual historical temperatures?
Totally agree. Not only is his work tenacious, but also brilliantly executed, well constructed and well reported. The entire field of proxies is in disrepute. Worse still are the cherry pickers, the hiders and the extrapolaters who manipulate the crappy proxies. But think of S. M. beyond being Canadian. He is a world class scientist. And he only ventured into this field later in life. Amazing. And after all his work, all his reports, all his revelations, the IPCC still continues to put forth that fake science.
Stephen, your claim that Valerie Masson-Delmotte is bound by the ‘scientific’ literature alarms me.
Is she operating on some calculation of averaging results of studies or ‘consensus’ (i.e. volume of published work favouring catastrophism)?
‘Nice person’ is of no value if the individual is incompetent or a snake.
Yes, we know IPCC is very confused (I’m being very charitable with that wording, and some of it is plain dishonest such as the PR head with his ‘red flag’ or such wording that is not supported by the IPCC’s own scientific documents. (Alex Epstein exposed that in ‘tweets’ and more recently.)
MrPete said:
“When I get more round-tuits…)
I’m chuckling, as my good brother the computing services sales person used to give out round plastic discs with his name on one side and TUIT on the other side.
Maybe my other brother can find the box that was left in my mother’s house when Brian died, she is gone too.
(Probably trying to urge potential customers to decide, a long process for the quarter-million-a-whack contracts, in any case they’d probably hang on to that advertising piece so remember him.)
Stephen: “…one surely presumes that IPCC climate scientists, who are employed full time on these topics, to be competent enough to notice things that I was able to observe in my first day or so of looking at PAGES2019. But their obtuseness never ceases to amaze.”
Sounds like ‘gethomeitis’, an aviation term for how many pilots kill themselves – so intent on the goal that they do not mentally assimilate contrary information into their decision process.
(Deteriorating weather being a common example of contrary information. Often pilots who are not skilled at flying on instruments, so get disoriented after entering cloud or fly too low to safely go under cloud. I could stretch such into analogies to climate catastrophist ‘scientists’.)
Or worse – I am being charitable.
Ron Graf:
“The Inuit and Yupik people of Canada do not want milder winters if Robert Way’s opinion is a representative voice.”
I’d want to talk to some of them, and desirably have a proper opinion poll.
Any Inuit/Thule/Yupik who claim ‘culture’ should check into how their ancestors got into northern Canada and Greenland – they migrated from western Alaska during the Medieval _Warm_ Period.
Today’s Inuit are very familiar with modern technology and ways to live, adopting much of it.
Certainly was a tough life several centuries ago.
Meanwhile I call ‘nonsense’.
PS:
They eventually got into Greenland, often shifting back and forth between the two countries especially before bureaucrats got in the way.
Some people think they displaced the Dorset people, but there is scant evidence of them ever meeting, the Dorset may have simply faded out because they weren’t successful enough at living. (They did not use dogs nor have tools as good as the later people, nor hunt land animals.)
Archaeology is a science fraught with limited evidence, because living matter usually rots or gets buried by earth or water (rising sea levels for example).
BTW: There are tree fossils in Canada north of the present tree line.
REF: Wikipedia articles.
This is rather out of date. Nevertheless, it is worth saying. Just because the whole field of temperature proxies, especially over the last two millennia, is mostly bad science, with typically poor calibration periods, uncertain extrapolations, and particularly by the MBH crowd, bad mathematics, all that means is that we don’t have a good handle on global temperatures over the past 2000 years (or more). Despite the problem with proxies, it still is evident that the rate of global warming in the past 140 years has been unique, is clearly related to growth of greenhouse gases even though the system is too complex to pinpoint that relationship in detail, and the future might have serious impacts on the world.Yet the establishment, by continuing to rely on bad science, loses credibility, especially with their claims of exact future temperature rise, since nobody of woman born can connect a CO2 level to a tglobal temperature distribution.
The rate of warming over the last 140 years is similar to previous episodes found in the Greenland ice core records.
The cause and effect relationship between T and CO2 is blurry.
Three independent lines of evidence (data from CERES, Project Earthsine and ISCCP) all point to a reduction in late C20th cloud cover which can explain the increase in T better and more simply than the hypothesised radiative greenhouse effect, which relies on an unmeasurable quantity (Effective Emission Altitude).
Tall Bloke: “The cause and effect relationship between T and CO2 is blurry.” Well, just about everything in climate is blurry. We are always working within what Judith Curry calls the “uncertainty monster”. The data on cloud cover, with all it’s variability in type, height, spatial distribution, etc. is even more blurry than the connection to CO2. But you are right that cloud cover is an important factor, and too often neglected in climate discussions. I would like to see NASA put a satellite in a halo orbit at the point between earth and sun where gravity is balanced to observe the earth through a telescope focused on the entire earth that would constantly monitor the emissions of the earth as it rotates below. I think that would provide a much better picture of the earth’s radiation balance. The Genesis mission employed such a spacecraft but it looked at the sun and collected solar wind. I was the proposal manager who wrote the Genesis proposal and I was system engineer in Phase A/B. Finally, to those who would sweep away the connection between CO2 and climate, how else can you make sense of the extreme climate changes over the past billion years? There is no doubt that very large concentrations of CO2 contribute to significant warming. During ice ages when CO2 drops toward 200 ppm there is a significant cooling effect. Read my books. The uncertainty of the CO2 effect lies in the range 300 to 500 ppm.
55 Trackbacks
[…] McIntrye has an interesting post today at his blog Climate Audit The IPCC AR6 Hockeystick Excerpts in italics with my […]
[…] McIntyre has an interesting post today at his blog Climate Audit The IPCC AR6 Hockeystick Excerpts in italics with my […]
[…] AR6 Hockeystick. Source Climate Audit Climate […]
[…] Read more: https://climateaudit.org/2021/08/11/the-ipcc-ar6-hockeystick/ […]
[…] Read more: https://climateaudit.org/2021/08/11/the-ipcc-ar6-hockeystick/ […]
[…] Read more: https://climateaudit.org/2021/08/11/the-ipcc-ar6-hockeystick/ […]
[…] McIntyre on IPCC AR6 WG1 […]
[…] reconstruite par le GIEC est présentée par le célèbre mathématicien Stephen McIntyre dans un commentaire récent. Asseyez-vous pour ne pas tomber de votre chaise. Le problème c’est que les étudiants, les […]
[…] of course, the alleged temperature increase on a global scale is nonsense, derived from a descendant of the infamous “hockey stick.” Naturally enough, so are the […]
[…] Évidemment, le statisticien qui avait en son temps dévoilé la supercherie de la première courbe a tenté de comprendre d’où vient celle-ci. […]
[…] game of the alleged “climate crisis” is an eminently fateful one. On the one hand is the hockey stick model-based prediction of an impending climate apocalypse by UN Secretary-General António Guterres on […]
[…] game of the alleged “climate crisis” is an eminently fateful one. On the one hand is the hockey stick model-based prediction of an impending climate apocalypse by UN Secretary-General António Guterres on […]
[…] game of the alleged “climate crisis” is an eminently fateful one. On the one hand is the hockey stick model-based prediction of an impending climate apocalypse by UN Secretary-General António Guterres on […]
[…] of the alleged “local weather disaster” is an eminently fateful one. On the one hand is the hockey stick mannequin-based prediction of an impending local weather apocalypse by UN Secretary-Basic António Guterres […]
[…] game of the alleged “climate crisis” is an eminently fateful one. On the one hand is the hockey stick model-based prediction of an impending climate apocalypse by UN Secretary-General António Guterres on […]
[…] game of the alleged “climate crisis” is an eminently fateful one. On the one hand is the hockey stick model-based prediction of an impending climate apocalypse by UN Secretary-General António Guterres on […]
[…] of the alleged “local weather disaster” is an eminently fateful one. On the one hand is the hockey stick model-based prediction of an impending local weather apocalypse by UN Secretary-Basic António Guterres […]
[…] game of the alleged “climate crisis” is an eminently fateful one. On the one hand is the hockey stick model-based prediction of an impending climate apocalypse by UN Secretary-General António Guterres on […]
[…] game of the alleged “climate crisis” is an eminently fateful one. On the one hand is the hockey stick model-based prediction of an impending climate apocalypse by UN Secretary-General António Guterres on […]
[…] game of the alleged “climate crisis” is an eminently fateful one. On the one hand is the hockey stick model-based prediction of an impending climate apocalypse by UN Secretary-General António Guterres on […]
[…] the alleged “climate crisis” is an eminently fateful one. On the one hand is the hockey stick model-based prediction of an impending climate apocalypse by UN Secretary-General António Guterres on […]
[…] game of the alleged “climate crisis” is an eminently fateful one. On the one hand is the hockey stick model-based prediction of an impending climate apocalypse by UN Secretary-General António Guterres on […]
[…] crisis” is an eminently fateful one. On the one hand is the hockey stick model-based prediction of an impending climate apocalypse by UN Secretary-General António Guterres […]
[…] the alleged “climate crisis” is an eminently fateful one. On the one hand is the hockey stick model-based prediction of an impending climate apocalypse by UN Secretary-General António Guterres on […]
[…] er ikke mulig å beskrive dette gjenoppståtte bedrageriet mer elegant enn det Steve McIntyre gjorde 11.august: Selv om klimaforskere fortsetter å fortelle at feil i deres «hockeykølle» […]
[…] Der IPCC AR6 Hockeyschläger « Klima-Audit (climateaudit.org) […]
[…] Engineer Stephen McIntyre, has done a dogged job of documenting the misdeeds of climate ‘science.’ He reviews the evidence that Mann’s tree bark reconstruction was wrong — in addition to the fudging — here. […]
[…] The IPCC AR6 Hockeystick […]
[…] By Stephen McIntyre, Climate Audit, Aug 11, 2021The IPCC AR6 Hockeystick […]
[…] Stephen McIntyre, The IPCC AR6 Hockeystick […]
[…] selon l’analyste du climat Steve MnIntyre qui s’étonne de cette quasi forfaiture ( https://climateaudit.org/2021/08/11/the-ipcc-ar6-hockeystick/ […]
[…] is promptly on the job again. Here is his post of August 11, basically dismantling the new Hockey Stick. If you have a taste for a lot of technical detail, I […]
[…] Stephen McIntyre, The IPCC AR6 Hockeystick […]
[…] er ikke mulig å beskrive dette gjenoppståtte bedrageriet mer elegant enn det Steve McIntyre gjorde 11.august: Selv om klimaforskere fortsetter å fortelle at feil i deres «hockeykølle» […]
[…] is promptly on the job again. Here is his post of August 11, basically dismantling the new Hockey Stick. If you have a taste for a lot of technical detail, I […]
[…] is promptly on the job again. Here is his post of August 11, basically dismantling the new Hockey Stick. If you have a taste for a lot of technical detail, I […]
[…] is promptly at the activity once more. This is his put up of August 11, principally dismantling the brand new Hockey Stick. When you’ve got a style for a large number […]
[…] is promptly on the job again. Here is his post of August 11, basically dismantling the new Hockey Stick. If you have a taste for a lot of technical detail, I […]
[…] The IPCC AR6 Hockeystick […]
[…] him into statistical analysis, runs the blog Climate Audit, and the two articles I cite are titled The IPCC AR6 Hockeystick, and PAGES19 Asian Tree Ring Chronologies. Both are technical challenges for the lay person. I […]
[…] for climate realists, Stephen McIntyre remains on the case. In an August 11 post on his Climate Audit website, McIntyre does a complete take-down of this latest incarnation of […]
[…] is promptly on the job again. Here is his post of August 11, basically dismantling the new Hockey Stick. If you have a taste for a lot of technical detail, I […]
[…] im Hochrisikospiel der angeblichen „Klimakrise“. Auf der einen Seite steht die auf dem Hockeyschläger-Modell basierende Vorhersage einer bevorstehenden Klimaapokalypse durch UN-Generalsekretär António […]
[…] im Hochrisikospiel der angeblichen „Klimakrise“. Auf der einen Seite steht die auf dem Hockeyschläger-Modell basierende Vorhersage einer bevorstehenden Klimaapokalypse durch UN-Generalsekretär António […]
[…] zien. Hier ter illustratie enkele proxy-tijdreeksen die McInytre afgelopen week op zijn website publiceerde naar aanleiding van het zojuist verschenen […]
[…] The IPCC AR6 Hockeystick […]
[…] Évidemment, le statisticien qui avait en son temps dévoilé la supercherie de la première courbe a tenté de comprendre d’où vient celle-ci. […]
[…] ist prompt wieder am Werk. Hier ist sein Beitrag vom 11. August, in dem er den neuen Hockeystick im Wesentlichen demontiert. Wenn Sie eine Vorliebe […]
[…] ist prompt wieder am Werk. Hier ist sein Beitrag vom 11. August, in dem er den neuen Hockeystick im Wesentlichen demontiert. Wenn Sie eine Vorliebe […]
[…] Steve McIntyre has shown that the paleoclimate science used to infer atmospheric temperatures over the past 2,000 years is not robust. He says, “It’s hard for readers unfamiliar with the topic to fully appreciate the extreme inconsistency of underlying ‘proxy’ data”. And he accuses researchers of cherry-picking the raw data in order to produce a ‘hockey stick’ shape in the temperature trend. The graph used by the IPCC includes this reconstructed data with little evidence of the well-known medieval warming period (AD 900-1300) and little ice age (1400-1850). (include graph) […]
[…] eine äußerst verhängnisvolle Entscheidung. Auf der einen Seite steht die auf dem Hockeyschläger-Modell basierende Vorhersage einer bevorstehenden Klimaapokalypse durch UN-Generalsekretär António […]
[…] eine äußerst verhängnisvolle Entscheidung. Auf der einen Seite steht die auf dem Hockeyschläger-Modell basierende Vorhersage einer bevorstehenden Klimaapokalypse durch UN-Generalsekretär António […]
[…] See Steve McIntyre’s blog about how the latest AR6 report manages to produce an alarming graph of 20th/21st century […]
[…] er ikke mulig å beskrive dette gjenoppståtte bedrageriet mer elegant enn det Steve McIntyre gjorde 11.august:Selv om klimaforskere fortsetter å fortelle at feil i deres «hockeykølle» […]
[…] detta nya ”hockeyklubbs-ljug” fixats till visas utförligt här; DEL1 […]