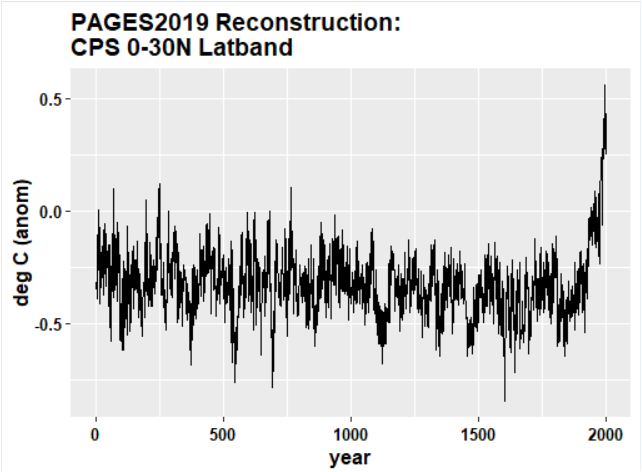
Next, the PAGES2019 0-30N latband. Their CPS reconstruction (CPS) for the 0-30N latband (extracted from the global reconstruction) looks almost exactly the same as reconstructions for the 0-30S and 30-60S latbands. However, none of the actual proxies in this latband look remotely like the latband reconstruction, as I’ll show below. In the course of examining the proxies in this latband, I looked back at 0-30N latband in prior PAGES compilations (2013 and 2017) and Mann et al 2008. The evolution of the proxy network is quite fascinating: the most notable feature is the increasing dominance of short (1-200 year) coral series in a network supposedly reconstructing the past 2000 years.
PAGES2019 Proxies with Values Prior to AD1200
The primary purpose of “2000 year” proxy reconstructions of temperature is to compare modern temperature to estimates of medieval and first millennium temperatures. There are 41 proxies in the 0-30N network, but only three proxies with values before AD1200 and only one (!?!) proxy with values prior to AD925 (see diagram below).
The single long proxy with values through the first millennium is a temperature reconstruction from Mg/Ca values from an ocean core offshore northern Africa. Its values decline erratically through the past two millenia, with very minor recovery in 20th century. If this is the ONLY data for the 0-30N latband through most of the first millennium, how can PAGES2K say with any confidence that modern values are higher than first millennium values? They can’t. My guess is that their algorithm(s) somehow paste 20th century trends in coral d18O onto non-descript or declining long proxies, but that is, at present, just a surmise. All one can say for sure is that, based on the PAGES2019 0-30N proxy network, it’s impossible to assert that modern temperatures in this latband exceed first millennium values (or vice versa.)

Evolution of PAGES19 0-30N Proxies
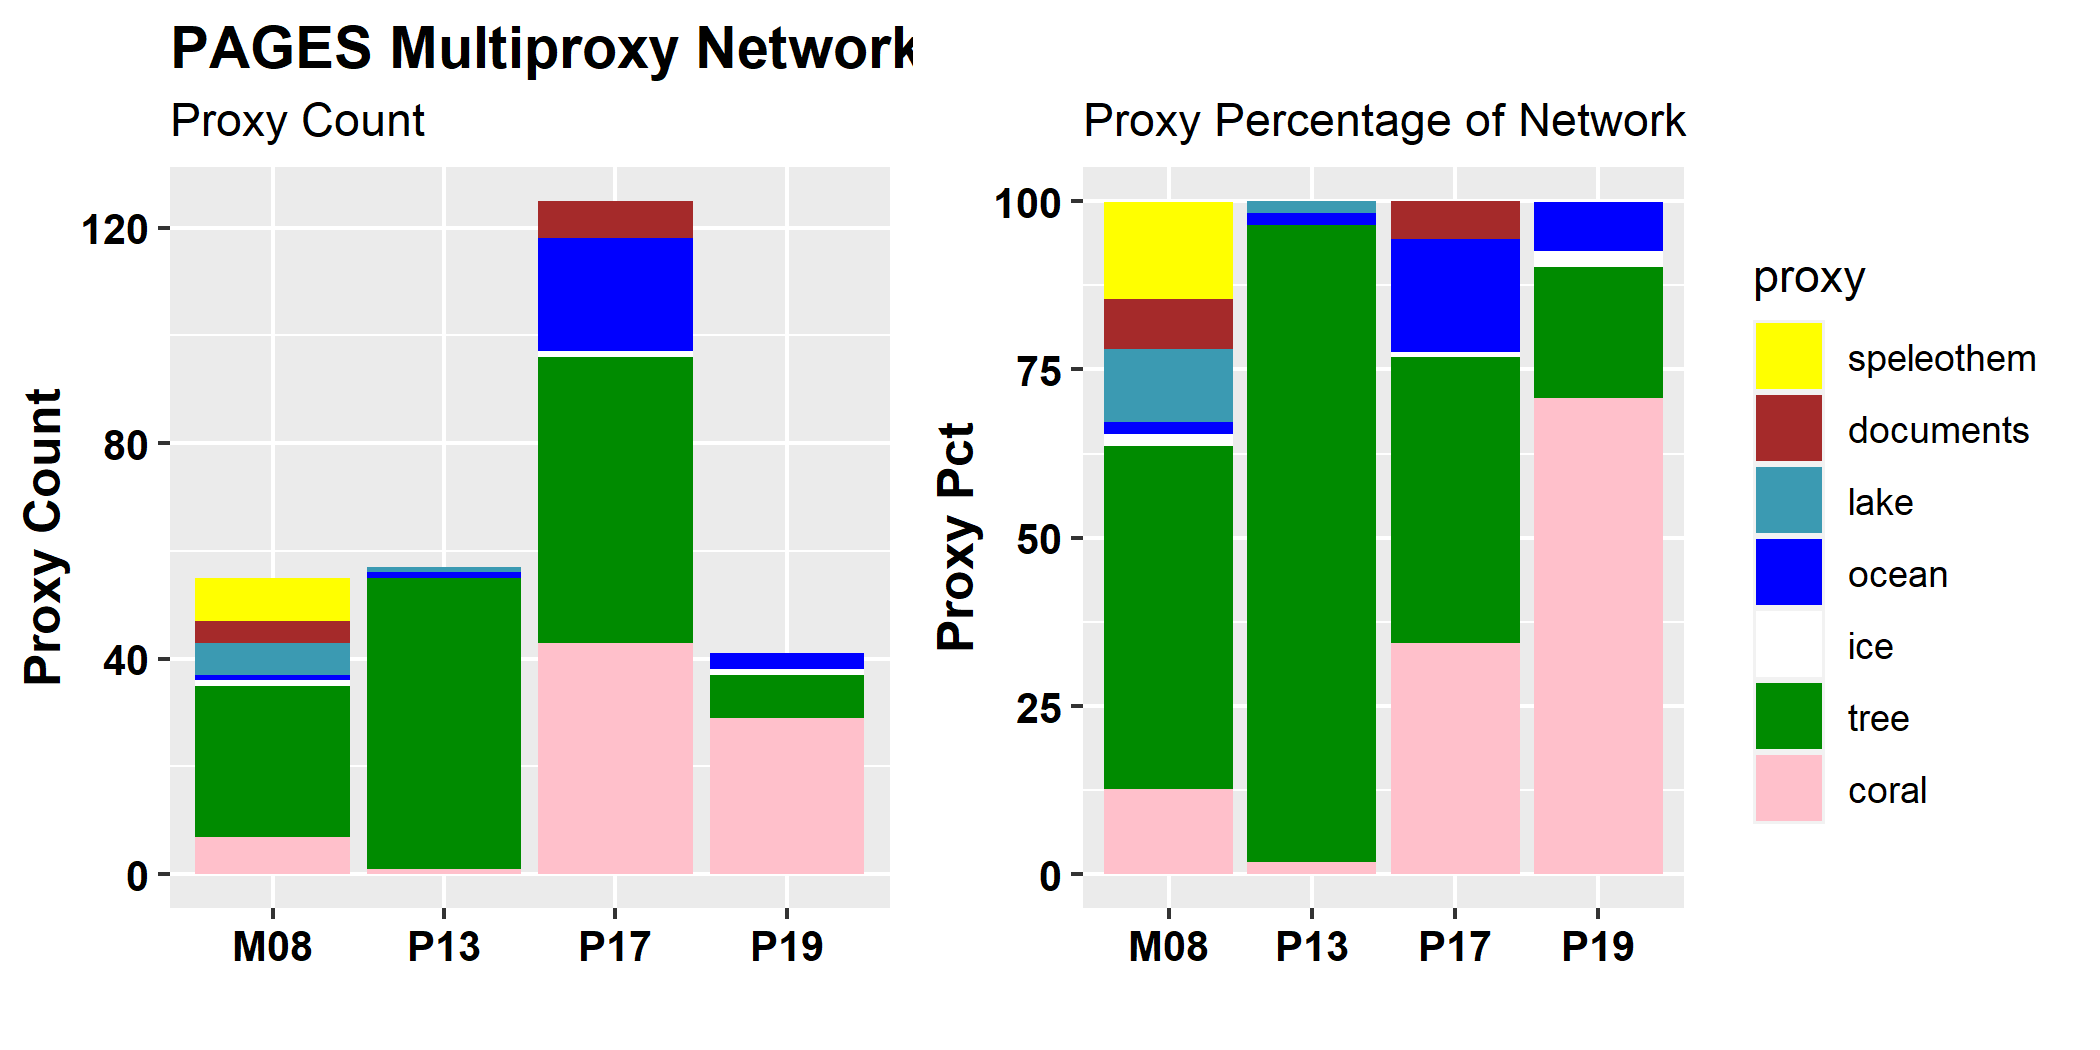
The evolution of the PAGES2K network in the 0-30N latband is really quite remarkable: the major proxy classes are tree ring and coral; secondary classes are ocean cores, lake cores, speleothem with a single ice core retained in three versions. (For comparison, I’ve also included the Mann et al 2008 network). The evolution of the proxy selections in each successive network reveals a great deal about decision-making of PAGES2K authors – much more than is stated in the articles themselves.
Almost every detail in the above graphic gives rise to commentary, requiring a lengthy article to elucidate each detail. I have considerable work in inventory on these details, on which I’ll try to follow up. In this article, I’ll focus commentary on the PAGES 2019 network.
Corals
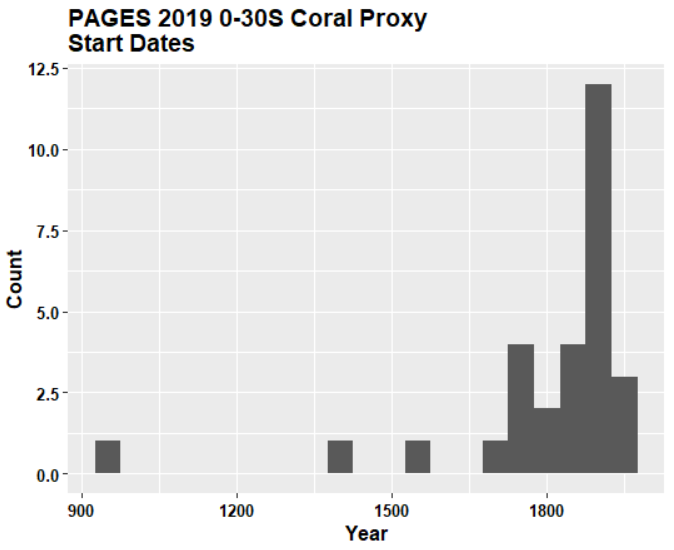
First and foremost, notice the “rise of corals” in successive PAGES versions, even though they are extremely short. As a proportion of the network, corals went from 1.7%, 1 of 57 proxies in the PAGES13 network, to 71% of the PAGES2019 network (29 of 41). All except three of these coral series begin after 1775, with many not beginning until the late 19th or even 20th centuries. The one coral series beginning before AD1000 is intermittent. (It is from Palmyra Island, located on a very narrow portion of the ITCZ in the eastern Pacific and may well be a rainfall proxy – see earlier CA discussion here.
It’s not that new coral series were added in PAGES 2019. The reason for the increased dominance of corals in PAGES2019 is that the 0-30N network was cut from 125 proxies in PAGES17 to 41 proxies in PAGES19 (see left panel above), with nearly all of the cutback falling on ocean sediments and tree rings, all of which were much longer than the retained coral proxies.
Tree Ring Chronologies (Mostly Asian)
PAGES2013 had 54 tree ring chronologies in the 0-30 latband; 52 of the 54 came from the Asia network of Anchukaitis and Cook, for which the chronology calculation method remains unknown (and hard to reconcile with data – see recent post on this issue here ^); the other two from Mexico. This network remained almost entirely unchanged in PAGES2017 which had 53 tree ring chronologies: 52 from Asia network and one from Mexico.
In PAGES2019, the network of Asian tree ring series chronologies is cut back to eight (see below). Mostly these chronologies are nondescript; none are similar to the eventual reconstruction. Two chronologies (CENTIB, MAXSIC) have very late upspikes – a phenomenon examined recently in connection with another Asian tree ring chronology for which underlying measurement data had become available. In that examination, it was impossible to replicate the upspike with usual chronology techniques; further, there did not appear to be any basis for the upspike in the underlying measurement data. In response to a recent inquiry, the PAGES2019 authors were unable to identify how the chronology was calculated and refused to find out.

Ocean Cores
The number of ocean cores in the 0-30N network was cut even more dramatically: from 21 series in PAGES2017 (nearly all of which had been added from the Ocean2K compilation subsequent to PAGES2013) to only three in PAGES2019, one of which is the only “long” proxy in the PAGES2019 network.
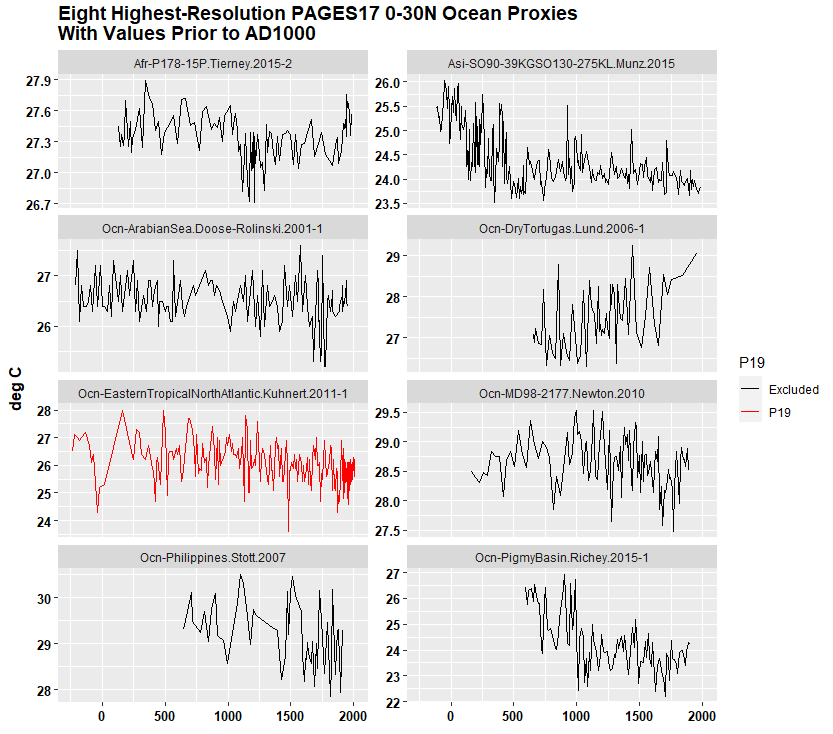
The diagram below shows eight PAGES2017 ocean proxies with values prior to AD1000, with the single series retained into PAGES2019 shown in red. With the exception of the Dry Tortugas series of Lund et al 2006, the other series show declining or stable values through the last millennium, consistent with the Ocean2K aggregate that PAGES2019 and IPCC seem to have been distancing themselves from. (In addition to the Kuhnert 2011 series shown in red below, the PAGES2019 network contains two other shorter ocean series – neither of which reach prior to AD1200. One of these two series is a shorter (15 on) version of the Tierney P-178-15P series at top left below. The shorter version of the series has distinct HS blade not present in the version shown below.
The removal of 18 of 21 ocean cores removed the vast majority of PAGES2017 “long” proxies from the PAGES2019 network.
d18O Proxies
During the past 20 years, there has been a vast increase in the population of high-resolution d18O proxies from speleothems and lakes. A few were included in the Mann et al 2008 collection, but these proxies have not been included in the PAGES2K collections. This is too bad, as, in my opinion, these show considerable promise of consistent high-resolution proxy information.
PAGES 2019 contained two “non-short” 0-30N d18O proxies (in addition to a myriad of short coral dq8O series): Palymra coral (6N, 160W) in heart of heavy ITCZ rainfall band; and a short version of the Dasuopu ice core. d18O values of Palmyra core have declined over past millennium and especially in 20th century and are interpreted as inversely correlated to temperature; d18O values at Dasuopu have increased over the past 100 years and especially in 20th century and are interpreted as positively correlated to temperature. Thus, the two d18O series in the same latband go in opposite directions in 20th century, but, for multiproxy purposes. PAGES2K (and other authors) orient them oppositely, so that each goes up in the 20th century.
For comparison, I’ve also shown two long d18O series – a speleothem (Dongge, China) and a lake sediment series (Yucatan, Mexico) from longer series included in Mann et al 2008. Both series show somewhat declining values in the last two millennia.

Conclusion
A major reason for looking at the underlying data in proxy reconstructions, aside from being sound statistical practice in general, is that, (1) by definition, a temperature proxy is supposed to be linearly related to temperature; and therefore (2) proxies in a network of actual temperature proxies, according to the definition, should (a) have a reasonably consistent appearance; and (b) look like the reconstruction. This obviously doesn’t occur in the PAGES2019 0-20N network.
Secondly, proxies covering the medieval period and earlier are disturbingly sparse in the PAGES2019 0-30N network. Although such series have become much more widely available in the past 15 years or so, PAGES 2019 0-30N contains only one (!) proxy with values prior to AD925. Indeed, it actually reduced the representation of longer (ocean core, speleothem, lake sediment) proxies from Mann et al 2008 and PAGES2017, while dramatically increasing the proportional representation of very short coral proxies. Madness.
Finally, the network is wildly inhomogeneous over time. In the past two centuries, it is dominated by trending coral proxies, with only a few nondescript or declining long proxies. Any form of regression (or like multivariate method) of trending temperatures against a large network in the instrumental period will yield an almost perfectly fitting reconstruction in the calibration period if the network is large enough. But when the network is limited to the few long proxies (and especially the singleton proxy extending to the first century), the fit of the regression (or multivariate method) will be very poor and the predictive value of any reconstruction negligible.
Briffa rightly sneered at Mann’s hyperventilating claims in respect to the few uninformative tropical (0-30N) proxies in the Mann et al 1998-99 network. The same criticism applies to the PAGES 2019 0-30N network.


55 Comments
Unless you are a time traveler, there is a typo:
‘…with very minor recovery in 29th century.”
fixed.
I noticed your comment “In response to a recent inquiry, the PAGES2019 authors were unable to identify how the chronology was calculated and refused to find out.”
I think that says it all about the problems of paleoclimatology and why it is so suspect. Everything points to the method is take a lot of data series from any source, drop the ones that don’t show what your predetermined answer should be, then do dodgy maths to get a magic graph that you can promote.
As you (Steve) have previously noted, in any other branch of activity like medicine or mineral exploration, this would put you before the courts, not being lauded by the the science nobility. And it shows how peer reviewed climate science is just so broken, it is beyond redemption.
Reblogged this on Climate Collections.
Another typo. In the conclusion: “This obviously doesn’t occur in the PAGES2019 0-20N network.” Isn’t that the 0-30N network?
Steve, you say:
“A major reason for looking at the underlying data in proxy reconstructions, aside from being sound statistical practice in general, is that, (1) by definition, a temperature proxy is supposed to be linearly related to temperature; and therefore (2) proxies in a network of actual temperature proxies, according to the definition, should (a) have a reasonably consistent appearance; and (b) look like the reconstruction. This obviously doesn’t occur in the PAGES2019 0-20N network.”
I am not sure that your point (2) follows. Proxies should, in theory, contain a *global* temperature signal and a *local* temperature signal. We should expect that the proxies contain a similar *global* signal, but just visually examining the proxies should not be expected to reveal this because it will likely be masked by the *local* signal. At least, this is my understanding from my familiarity with ocean sediment records.
if one looks at networks of Chinese speleothem d18O or Peruvian d18O records (speleothem, lake, even ice), there is an immediate visual similarity s one feels that they are recording some sort of common signal and an estimate of the underlying “signal” (whatever it may represent) is easily recovered. d18O data from northern subtropics and southern tropics is inverted, but the symmetry is easily noticed. My beef (one of my beefs) with so much PAGES and tree ring data is that there is negligible consistency even at fairly local levels.
Also, in the case of this post and this series of posts, I had already stratified to 0-30N latband. So this removes one of the most important variabilities.
Reblogged this on ClimateTheTruth.com and commented:
More great data analysis from Stephen McIntyre. How does Michael Mann even get away with masquerading as a scientist? His work over the years has been so massively flawed in so many fundamental ways!
My armchair take is the major underlying assumption in just about all these sorts of reconstructions is that if you average out a broad selection of proxies you get a meaningful answer. A further assumption is that the averaging process is so robust you can even select which ones you want to average. Both assumptions are false.
If you average a bunch of noise you just get more noise, if you select pieces of noise you just get a similar looking collation of noise. If some of it is noise and some isn’t, averaging doesn’t reduce the noise. I must be missing something, but my take is that these erroneous reconstructions will continue until the underlying false assumptions that go into them are addressed.
One of the problems with working with land based proxies in this latitude band is the high human population density going back in time many years. We are looking at northern S. America up through Central America and Mexico, then a big chunk of C. Africa, India and then S. Asia. Here in Florida the local Indians cleared lands going back thousands of years to make way for squash, corn and other crops and to improve the conditions for the deer herds. This likely affected the huge oak, pine and cypress stands from which you would like to take core samples. This only intensified once de Soto and the Spanish showed up in the 1500s. It is possible that ocean proxies may have had less direct human interference, but this still does not excuse the woefully short proxy ages used in the study.
DW,
If the proxies are compromised beyond use, the correct action is to avoid their use.
Lipstick on a pig comes to mind. Geoff S
Climates in the North 0-30 band are much more stable than the research approach on them by the PAGES band. Who pays these pipers?
When 50% of the new PAGES2019 0-30N global temperature reconstruction is based only on one “temperature” proxy on the remote nu-inhabitated Pacific Palmyra atoll which presently receives 4080 mm/ 160.3 inches of rainfall a year one can genuinely ask if this is Science, PR or voodoo. There is a lot of land in that region too, not good enough?
I have a feeling that the PAGES saga would make an interesting study in institutional corruption.
It was clearly compromised from the start, but why has it changed its proxy network so radically from one version to the next and why is it now almost devoid of the long-term proxies, running up to now, that alone could give us a credible picture of long-term trends?
A couple of ideas:
1. Maybe the PAGES personnel changes quite a bit. What I imagine may be happening is that “new brooms” come in and insist on fixing some error or other, but that any tendency for these changes to invalidate a hockey stick are squashed by the PAGES hierarchy, resulting in the new broom being swept out, or leaving in disgust, whereupon the process starts again.
2. More fundamentally, there is just no way around the stubborn fact that really long-term proxies tend to show Roman and medieval warm periods at least as warm as today, and a Holocene optimum that is warmer still. The effort to obfuscate this fact through selection or processing leads to ever more far-fetched dodges, and this further encourages the turnover of honest researchers as in 1.
Would be happy to hear other ideas, or evidence for or against the above.
There needs to be some type of investigation into these investigators. The scientific results from study to study are just so arbitrary and contradictory there are no solid foundations. The only thing they are consistent with is blaring scary headlines. For example, Ocean 2K’s McGregor et al (2015) used far more proxies than PAGES19 and came up with a completely different 2000-yr reconstruction, one of flat warmth for the first 1000 years followed by steady cooling for 850 years followed by slight warming for 150 years. They compared hypotheses for the 850 years of cooling and eliminated solar, orbital (M-cycle), and unforced variability and confirmed volcanic aerosol by use of a global climate model. But when you look at their plot of volcanic activity superimposed on their reconstruction they do not match. Tambora in 1815 was the largest eruption in 2000 years yet it marks the beginning of modern warming.
To be clear, I think the volcanic forcing science is valid. But this is precisely why I am skeptical of all the proxies that show no reaction to the global dip in forcing from 1815-1817 or the second largest, Samalas 1257 or the for ninth largest and most recent, Krakatoa 1883. These are scientific markers that are completely ignored by “expert” paleoclimatologists.
https://en.wikipedia.org/wiki/List_of_large_historical_volcanic_eruptions
McGregor et al (2015)Robust global ocean cooling trend for the pre-industrial Common Era
Here is the scary article announcing McGregor: 1,800 years of global ocean cooling halted by global warming
@Ron – why would ocean temperatures need to react to volcanic forcing? I would guess oceans would react way slower due to their high heat capacity, and volcanic-induced temperature drops are usually only on the timescale of years to maybe decades. So too short for oceans to pickup.
If you want to read a good paper on the link between volcanism and CE temperatures, read Buntgen et al (2020). These are a bunch of good paleoclimatologists and they absolutely do not neglect these signals that can be found in the volcanoes!
https://www.sciencedirect.com/science/article/pii/S1125786520300965
@David – it makes no sense I believe to just randomly start guessing at supposed causes for supposed things you think may or may not have happened. The only scientific thing that you could do, is audit (as Steve does) or publish a comment or a paper refuting any conclusions made in earlier papers. Stick to the science.
“There needs to be some type of investigation into these investigators.”
There have been several official investigations in the work on MBH98 and the climategate leak. There was no evidence of any malpractice.
“The scientific results from study to study are just so arbitrary and contradictory”
What is contradictory? They all got a clear hockeystick-shape.
“Ocean 2K’s McGregor et al (2015) used far more proxies than PAGES19 and came up with a completely different 2000-yr reconstruction, one of flat warmth for the first 1000 years followed by steady cooling for 850 years followed by slight warming for 150 years.”
The PAGES19 and McGregor2015 graphs actually look remarkably similar… flat for 1000 years, cooling for 700 or so (neither have 850 year cooling) and then an increase. Ocean2K doesn’t show a hockesytick-blade, but that’s because it ends in 1900.
Often, it is more interesting to realize what is NOT written, than what is written.
First, it looks unnatural to me to subset the proxies used in a global analysis according to their latitudes and to further discuss such subsets. I have seen no scientifically sound explanation why the past blogs have focused on 30-60S, 0-30S, 0-30N subsets of PAGES2019. Latitudes are arbitrary numbers. Why use them as cutoff to create subsets? It may be convenient to write post-hoc criticism, but it is not science if you cannot justify why you do that.
Secondly, PAGES2019 selected 257 proxies from a set of 629, which were previously obtained by reviewing even more proxies. This selection is often described with the derogatory term “cherrypicking”. I may be mistaken, but I haven’t seen a blog-article that delves into the method used to select the proxies and discussed the method in detail. PAGES2019 described how they selected them, but only the result is criticized here, whereas they are simply the result of the procedure. If you believe the result is unreliable, then you have to explain what is wrong in the method. But I cannot find anything like that in the recent blog-articles on the AR6/PAGES2019 hockeystick proxy selection.
The third point that is not written, is the most interesting one: the barchart under “Evolution of PAGES19 0-30N Proxies” shows that the different studies M08, P13 and P19 used different sets of proxies. So it’s not just “cherrypicking” the same proxies all the time (a claim that I have read her before)! Importantly: despite using different proxies, they all got a similar hockeystick! I admit, they differ a bit in the wobble of the shaft and the number of proxies extending into the first millennium differs , but the blade is always very prominent. And that is the key message in the SPM of AR6: theblade of the last 50 years is unprecedented. So basically, any set of proxies gives you a hockeystick. Now, I realize that some people will now straight away think of MM05, where it is claimed that this is because the method (the R-code) to generate the graph is faulty. But that has been debunked – the methodology to generate the ensemble is not the cause of the hockeystick; it is the data that have a hockeystick in them. Moreover, PAGES2019 didn’t use one method, but 7 different methods to create ensembles.
So, don’t just think about what is written. Think also about what you don’t read!
We never claimed that the ONLY way to get a hockeystick was through Mann’s faulty PC method. We stated that Mann’s PC method was faulty and biased towards series with a HS shape and that method was so biased that it could even generate HS from random data with persistent red noise. We noted that Mann’s erroneous methodology gave undue weight to data known to be problematic – stripbark bristlecones. I and others have frequently observed that there are other ways to “get” hockey sticks.
In Mann’s original study, Mann claimed to have demonstrated statistical significance through verification statistics – pointing to verification r2 and verification RE in the original digures. However, his claim of statistically significance was false – as verification r2 was little more than 0. If the network were actually “temperature proxies”, this would be impossible as a combination of actual proxies (linearly related to temperature) would necessarily be statistically significant.
Another trivial way to get a HS is to regress temperature against a large network of random data in the calibration period. The “prediction” from such a model will be the shaft in the reconstruction period. They don’t use OLS regression, but Neukom’s method looks like a form of Partial Least Squares regression which will yield similar result when applied to screened data.
The overall problem is that there is remarkable consistency among the reconstructions, but not in the underlying data – which is a mess. That’s why I plot the underlying data/
r2 is not a measure of statistical significance, is it? You can achieve a statistically significant result with a high r2 for very noisy data with a very strong relationship. r2 just tells you the % variance explained.
I also still don’t think I follow your reasoning for plotting the individual proxies… If you’re saying they don’t look “hockey stickish” enough on their own, that doesn’t mean they don’t contain an underlying hockey stick. 2 and 50 don’t look very much like 26, but 26 is indeed their mean. Combining data with random wiggles + an underlying commonality should get rid of the random wiggles and reveal the commonality (this might be overly simplistic, but that means I probably need a simplistic explanation to help me understand).
There is a very easy way to check if an underlying hockey stick can emerge from numerous noisy proxies. It is enough to operate the selection or the weighting on the detrended series. Gergis falsely claimed to practice this method and his paper was withdrawn. To my knowledge, no one has claimed to attempt the exercise any more. Very strange considering the simplicity and robustness of the method.
There is a very easy way to check if an underlying hockey stick can emerge from numerous noisy proxies or is due to an erroneous algorithm. If you have multiple proxies that give a hockeystick-ensemble, you simply remove the years after 1950 from these proxies and run it again. If you get a hockeystick again, suddenly with a “blade” for 1900-1950, then you know that there is something wrong in the methodology. On the other hand, if this time it is a flatter curve, you know the blade after 1950 is real.
Oh yes, OCEAN2K analyzed only up to 1900 and did not get a blade!
Bas,
I don’t see what end effect you’re referring to. Perhaps you should start by educating yourself on the subject of the discussion.
In fact, it is simply a question of preventing the hockey stick from being part of the selection criteria. This trap can be avoided very simply by using detrended series over the selection period. The selection, or weigthing, is then based on the high frequencies and you are assured that the low frequency shape obtained is not an artifact of the method.
Bas wrote: “Oh yes, OCEAN2K analyzed only up to 1900 and did not get a blade!”
Are you still that trusting that you think the Ocean 2K paper would have dropped the 20th blade had there been one? They simply covered up even though they had high resolution 20th century proxy data.
Steve posted this in 2015:
r2 is a very common measure of statistical significance. Yes, a high r2 is not a guarantee that the model is valid. Of course. But if you have a valid model, then you willl necessarily have a significant r2. So a failed r2 is evidence that morel is invalid. One reason why Mann concealed his failed verification r2 statistics.
Steve, I agree that a high r2 isn’t a guarantee that a model is valid, but I believe the reverse is also true. This is where my confusion comes in. I’ve draw a series with a “baked in” linear trend + very high variability, and predictably the r2 value for the linear trend is quite low:
However, the p-value actually passes at the 95% level:
So here we actually know that the trend is real because we put it there. So, no, the model does not explain much of the observed variance, but it does accurately describe the “long term” behavior of the series. We cannot dismiss the model on the basis of the r2 value alone, especially if we aren’t even interested in describing the variance in the first place, but in describing the trend. Maybe there is something I’m missing, here.
to more accurately emulate a proxy network, you need to construct a network of (say) 50 proxies and then obtain a reconstruction by some multivariate method. E.g. taking an average of series after standardizing to 0 mean and sd=1. Then do you comparison, The noise cancels out from central limit theorem. If they are all signal plus noise,
Steve, you say
“to more accurately emulate a proxy network, you need to construct a network of (say) 50 proxies and then obtain a reconstruction by some multivariate method. E.g. taking an average of series after standardizing to 0 mean and sd=1. Then do you comparison, The noise cancels out from central limit theorem. If they are all signal plus noise”
But, while this makes sense, this doesn’t really address my point of confusion, which is that r2 alone does not seem to be a measure of statistical significance. I agree that it’s possible a combination of proxies will have lower variance, but simply obtaining a low r2 doesn’t doesn’t tell you anything more than that the signal/noise ratio is still low. You can achieve a statistically significant result with a low r2. Maybe there is a high frequency signal that isn’t simply random noise, but if what you care about is the long term evolution that might not be so important.
Stephen,
It doesn’t really matter if your MM05 paper was debunked or not. As you state yourself, it is not the only way to get a hockeystick. The main point I made was “Often, it is more interesting to realize what is NOT written, than what is written”. That extends now to your reaction: what you don’t write, is any rebuttal of the three points I raised! That is most interesting!
As to the focus on latbands, the TEMP12K reconstruction by somewhat overlapping authors produced reconstructions for the various latbands that I’ve been considering. 2000 years is long enough that one would expect to see some Milankovitch influence and therefore relevant to look at SH, NH extratropical and tropical separately.
The TEMP12K analysis defined various latitudinal zones to COMPARE the results obtained for each one of them. You split the global dataset up to discuss each group separately. Because the purpose is different, you cannot simply justify your strategy by referring to their work.
Bas, you make valid points that one must be skeptical for selection biases and tautologies. The primary criticisms of the current paleoclimate establishment is that they use modern thermometer records to select and eliminate proxies. This process necessarily creates a match to modern trends unless one detrends the data sufficiently that a high resolution response is detected. In addition to passing such a test there must also be supplied a scientific explanation for why one set of proxies (trees for example) would be sensitive to temperature while an otherwise identical set would not. Climate Audit is filled with posts exposing these failures.
However, Steve recently posted here an example where paleoclimate science has ignored a precisely known effect that should be used to validate very long polar temperature proxies: Milankovitch precession. In the last ~11K years the perihelion has switched from occurring in the southern winter to the northern winter. This should have increased the growing season for far southern plants and conversely shown a decreasing trend for far northern plants.
If a long-term proxy showed response to Milankovitch effect and also to historic major volcanic eruptions they would be properly validated (unless one had to sort through an otherwise identical haystack of proxied to pluck it out.) But even if all this was achieved one would still have to prove that the proxy was not confounded by modern CO2 fertilization, (as Graybill, of the infamous bristlecone pines warned).
Stephen,
In relation to Bas’ query re the latbands:
” …Their CPS reconstruction (CPS) for the 0-30N latband (extracted from the global reconstruction) …”
Is the CPS construction produced by Pages2K Consortium, or by you?
If ‘extracted’ from the global by you, how is that done?
I was presuming the latband approach was by the Pages2K Consortium.
the PAGES group published latband averages for TEMP12K. For PAGES2K, they published reconstructions for all gridcells. I averaged their gridcell values in 0-30N latband for their CPS reconstruction. Absolutely routine calculation from their data. If they feel confident enough to produce reconstructions for individual gridcells, it’s entirely reasonable to look at latband averages. To be precise, their purported calculation at level of individual gridcell is really stupid overreach. I have no idea how they purported to do that.
Bas,
“But that has been debunked – the methodology to generate the ensemble is not the cause of the hockeystick; it is the data that have a hockeystick in them. Moreover, PAGES2019 didn’t use one method, but 7 different methods to create ensembles.”
You are not understanding the mechanism. If you have a bunch of proxies, where even a very small number have a rising blade at the end (as you would also with just random series) you will get a hockeystick. Unless you are claiming that the few proxies with a blade are somehow magic global temperature indicators and all other proxies should be canned, you agree that the methodology is totally flawed, and that the claim has in fact not been “debunked”.
Someone is feeding you nonsense.
I recall that S McIntyre mentioned in a prior post that there are 2 Pakistan tree ring proxies located fairly close to each other, one of which had an elevated MWP and the other which did not have an elevated MWP.
The HS study in question did not include the proxy with the elevated MWP.
Can you provide some insight / background on that proxy
Thanks
Joe: Such problems are common. There was controversy about selection of some Russian proxy sites and not others (Yamal and Polar Urals are names I vaguely remember). I read that some of the MWP TRWs were taken from “fossil wood” north of the current tree line. To some extent, a tree line during the MWP north of the current tree line proves (to me, at least) that it must have been warmer during the MWP than the “current” WP.
In the case of conflicting Pakistani TRWs, one might decide between these proxies based on the relative elevation of the tree line today and during the MWP.
There are several problems with trying to make use of the tree line elevation. It obviously doesn’t have annual resolution and is impossible to calibrate and date. When the climate warms, how long does it take for a forest to move poleward or to a higher elevation. Is today’s tree line a product of average temperature 25, 50 or even 100 years ago?
If I remember, there was a study that looked into how close to the tree line (elevation) trees needed to grow in order to be good proxies for temperature. As the tree line has risen during the current WP, TRW’s near the old tree line stopped being temperature sensitive.
IIRC, Esper looked at the ability of TRW to reconstruct the 10? largest temperature deviations (mostly volcanic eruption, with some being during the instrument period. He found that reconstructions failed to reproduce most of the annual instrumental temperature drop in the initial year, but that reconstructed temperature showed an artificial cool signal for several years thereafter. Reconstructions based on C13 in the same tree rings matched the instrumental record much better.
In other words, TRWs are lousy temperature proxies. As a chemist, I think about the temperature dependence of the slowest reaction in plant growth, which is probably the incorporation of CO2 by RuBisCO. About half of the protein in chloroplasts is RuBisCO and genetic engineers have been trying had to increaser its efficacy. Are TRWs a function of the temperature dependence of this enzyme integrated over the growing season? Does variation in sunlight introduce noise? Or TRW’s a function of the LENGTH of the growing season and depend on how cool or warm spring and fall have been.
All of these questions mean I am not temperamentally suited to the lack rigor in paleoclimatology, and leave the field to statisticians.
I am glad you brought up tree line elevation. Same issue with receding glaciers revealing trees.
Those proxies dont have annual resolution, but they do provide conflicting temp reconstruction from the TRW’s
Frank – I need to clarify my statement – Question – comment – The various proxies, including but not limited to TWR are calibrated against the temperature record. If the proxy is validated with the temperature record, they are assumed to be valid back in time. On the other side, tree lines elevations don’t provide annual resolution nor do receding glaciers exposing trees. What they do provide are indications of warmer temperatures than the present day. The proxy should reflect the warmer temperature consistent with the other lines of evidence of warmth or lack thereof. If not, the proxy should be either recalibrated or tossed. My observations are those discrepancies are treated as trivial or ignored.
I also note your C13 comment and the inability do distinguish between spring, summer or fall growth. My observation is consistent with your thoughts is that TRW resolution is really insufficient to provide any meaningful insight into prior temps.
Looking forward the post on the 30-60N and 60-90N.
“by definition, a temperature proxy is supposed to be linearly related to temperature”
I don´t agree. A temperature proxy must be related to temperature, but the relation need not be linear, and as a matter of fact usually isn´t.
The selection of proxies by PAGES 2K has always been bizarre, to put it mildly.
The best temperature proxies are probably arctic ice-core d18O, followed by speleothem d18O and alkenone from marine cores. Marine TEX86 is also promising, but plagued by calibration problems at the high-temperature end.
Pollen analysis and subfossil insect faunas also seem to give reasonable and consistent results, as do treeline data.
Just about everything else seems to be largely red noise.
If the proxies are not linearly related to temperature then linear filtering and linear combinations of the proxies will not estimate temperature series.
If the proxies are not linearly related to temperature then linear filtering and linear combinations of the proxies will not estimate temperature series.
While I am getting rusty with some of these concepts, might I please suggest that the Palmyra example from Steve’s analysis raises some questions, perhaps related to the linear relation discussion.

Given the multiple and possibly random nature of impacts that could affect the measurements shown, it is questionable whether time series analysis is valid, at least until some other conditions are met. Specifically, can fragments of data like these be connected on a time series graph without full knowledge of what caused the gaps between fragments?
Growth changes as shown are essentially stochastic/episodic events whose intensity and duration is variable between fragments and over time, so any trend hypothesis, which presumes data are homogeneous with respect to time, is not valid. Long-term trend in a response variable can only be evaluated after effects of stochastic events are statistically removed. Is that done here? Geoff S
h/t Dr Bill Johnston
Absolutely right that the gaps require explanation. Statisticians generally require a determination of “missing at random” in order to include fragmentary series into an analysis without special processing. Otherwise, one must allow the possibility that “missingness” imposes a bias on the signal you are trying to resolve.
According to Cobb 2003, the temporally disparate chunks of data come from different chunks of fossil coral that storms pushed onto Palmyra beaches. The different chunks were dated by U/Thorium.
C2003 and its followers agree that what some call the “blade” only began in their own data around 1975. Arguing with MBH and similar support, they rationalize the “blade” is likely due to AGW. But I see no explanation why their causal analyses are not falsified by their own pre-1975 data which does not match MBH, etc.
Their post-1975 Palmyra “blade” does not curve-match the MBH blade which begins rising about the late 19th c. The PAGES Latband reconstruction at the top of this page shows a blade which looks like the MBH thermometer (eg., 1930’s high, 1960’s low) overlay, not this Palmyra coral data.
Another Jor-El wannabe.
A miracle just happened.
A miracle has happened.
Superman involved in UEA email leak? What does the BBC know? Funny!
Doing some research on past climate, I just came across a 2019 paper: https://www.nature.com/articles/s41586-019-1401 “No evidence for globally coherent warm and cold periods over the preindustrial Common Era” Proxies look like those described by S. McIntyre, lots of info today and less and less as one goes back in time. Is it the same team as the new hockey stick salespeople?
It is a companion paper by same people.
Steve: It seems to me that Neukom et al Nature 2019 is being used to erase the existence of a global LIA (as well as an MWP). They appear to be arguing that there wasn’t a globally homogeneous LIA because the peak cooling occurred in different centuries in different places. If there was cooling almost everywhere, but the location of peak cooling occurred in different places at different times, there was an LIA. And even under the best of circumstances, I question whether the differenced between cooling in different periods of the LIA is statistically significant. Extended Data Fig 8 shows reconstruction from retreaded calibration.
Abstract: “Earth’s climate history is often understood by breaking it down into constituent climatic epochs1. Over the Common Era (the past 2,000 years) these epochs, such as the Little Ice Age2,3,4, have been characterized as having occurred at the same time across extensive spatial scales5. Although the rapid global warming seen in observations over the past 150 years does show nearly global coherence6, the spatiotemporal coherence of climate epochs earlier in the Common Era has yet to be robustly tested. Here we use global palaeoclimate reconstructions for the past 2,000 years, and find no evidence for preindustrial globally coherent cold and warm epochs. In particular, we find that the coldest epoch of the last millennium—the putative Little Ice Age—is most likely to have experienced the coldest temperatures during the fifteenth century in the central and eastern Pacific Ocean, during the seventeenth century in northwestern Europe and southeastern North America, and during the mid-nineteenth century over most of the remaining regions. Furthermore, the spatial coherence that does exist over the preindustrial Common Era is consistent with the spatial coherence of stochastic climatic variability. This lack of spatiotemporal coherence indicates that preindustrial forcing was not sufficient to produce globally synchronous extreme temperatures at multidecadal and centennial timescales. By contrast, we find that the warmest period of the past two millennia occurred during the twentieth century for more than 98 per cent of the globe. This provides strong evidence that anthropogenic global warming is not only unparalleled in terms of absolute temperatures5, but also unprecedented in spatial consistency within the context of the past 2,000 years.”
If a Little Ice Age could have happened only in the north of the Northern hemisphere, then a Little Warm Age can also be going on only there now. The Tropics and Antarctica have barely warmed compared to the Arctic.
In my humble opinion, this question of hockey stick is admirably conveyed in these remarks related to the Gergis affair:
Karoly to Neukom :
“Thanks for the info on the correlations for the SR reconstructions during the 1911-90 period for detrended and full data. I think that it is much better to use the detrended data for the selection of proxies, as you can then say that you have identified the proxies that are responding to the temperature variations on interannual time scales, ie temp-sensitive proxies, without any influence from the trend over the 20th century. This is very important to be able to rebut the criticism is that you only selected proxies that show a large increase over the 20th century ie a hockey stick .
The same argument applies for the Australasian proxy selection. If the selection is done on the proxies without detrending ie the full proxy records over the 20th century, then records with strong trends will be selected and that will effectively force a hockey stick result. Then Stephen Mcintyre criticism is valid. I think that it is really important to use detrended proxy data for the selection, and then choose proxies that exceed a threshold for correlations over the calibration period for either interannual variability or decadal variability for detrended data. I would be happy for the proxy selection to be based on decadal correlations, rather than interannual correlations, but it needs to be with detrended data, in my opinion. The criticism that the selection process forces a hockey stick result will be valid if the trend is not excluded in the proxy selection step.”
Neukom’s response :
“I agree, but we don’t have enough strong proxy data with significant correlations after detrending to get a reasonable reconstruction….”
However, there are many proxies with remarkable high frequency correlation. None of them have a shape reminiscent of a hockey stick.
This isn’t news, but it looks more and more as if the main thrust of PAGES is to destroy the results of decades of work that established the medieval warm period as significant and global in character. That work was based on long-term proxies, which, by a large majority, show a clear MWP signal in practically all parts of the world (http://www.co2science.org/data/mwp/quantitative.php)
So the game becomes finding ways of excluding those well-established proxies. This post has provoked me to re-read some of Steve’s earlier ones on PAGES which show both the determination of the group to stick with a no-MWP narrative and the great variety of highly dubious excuses and methods they found for obliterating the results of earlier and less narrative-driven research (https://climateaudit.org/2016/08/03/gergis-and-law-dome/ https://climateaudit.org/2014/10/07/pages2k-vs-the-hanjiharvi-reconstruction/ https://climateaudit.org/category/multiproxy-studies/pages2k/).
I am looking forward to the next installment (30-60N) as there are literally dozens of long-term proxies showing a MWP in Europe and North America. Did PAGES manage to “deep six” all these results? And if so, how?
I view Holocene as long-term decline to Little Ice Age, with Medieval period being warmer than LIA, but not relative to earlier periods. Their 30-60N network is almost entirely tree rings. I’m busy on other topics right now.
Thanks for the news, even if it means we will need to wait a while for the next installment.
I’m interested to hear you think MWP was no warmer than earlier periods, as I had been inclined to accept at least as a starting point the sort of graphs presented in AR1, before Mann et al got to work, which show temperatures around 1000 AD a little warmer than, say, 800AD, and quite a lot warmer than 1000 BC. Will go off and have a look into this.
One Trackback
[…] PAGES 2019: 0-30N Proxies […]