I’ll try to do reports on various interesting aspects of the AGU conference over the next few weeks. Today I’m going to post on the session on the Divergence Problem, initiated and chaired by Rob Wilson, and which, for the most part, consisted of young dendros probing critically at the issue of the failure of ring widths to record recent warmth. This issue was touched on by both the NAS Panel and IPCC AR4, both of which arm-waved through the problem, relying on a rather lame explanation by Cook (who does a lot of solid work, but this wasn’t one of them).
There were 8 oral presentations in the 4pm Friday time slot, the worst possible time slot at AGU. All but two of the presenters were fairly young. Cook was in attendance, but neither Hughes nor Mann bothered coming. Perhaps the most remarkable aspect of the session was what wasn’t mentioned: none of the presenters mentioned the NAS panel or the IPCC analysis of the Divergence Problem.
There was an ancillary poster session in the morning, to which I was consigned. Had I been giving an oral presentation, I would have analysed the Divergence Problem as set out in my abstrat, but, since it was a poster presentation, I presented Almagre results in a divergence context notwithstanding my abstract. Rob Wilson teased me about it a little but was OK with it. I got quite a bit of traffic – I think that I talked to all the presenting dendros at the poster, something that would not have been possible at the oral session, where the presentations run in military sequence.
The “Divergence Problem” has been an issue that’s been covered since the start of CA. I’ve made a new keyword category Divergence to collect many of the posts and, for anyone interested in the topic, these posts make a pretty good review. I’ve certainly done what I can to keep this issue in the public eye, but the interest of Rob and the various presenters obviously pre-dates the interest expressed at CA.
The Divergence Problem and Asking for MBH Data
Actually the Divergence Problem is one of the things that prompted my initial inquiry to Michael Mann for his data. In April 2003, my attention had been drawn to the following quote by Malcolm Hughes, originally made in 1999 in connection with the publication of Vaganov, Hughes et al 1999:
The recent marked weakening in the correlation between tree growth and temperature means that past climate reconstructions are even more reliable than previously thought, but forces scientists to rethink the role of the vast northern forests in the global carbon cycle, said Malcolm Hughes. Hughes, professor and director of the Laboratory of Tree Ring Research at the University of Arizona in Tucson, is co-author of the Nature paper. Currently he is doing field research in the northern Rockies, but will return to the Tucson campus on July 20.
“The recent weaker correlation between tree growth and temperature clearly affects the reliability of our reconstructions of the past. Actually, it means past climate reconstructions (before the 1960s) are better than we thought they were. And, as a result of this, it means that we underestimated the differences between the present century and past centuries,” Hughes said.
The idea that worse correlations showed that their reconstructions were “better” made no sense to me. A few days later, I noticed a statement from Simon Brown also observing problems with tree ring reconstructions as follows:
Dr Simon Brown, the climate extremes research manager at the Meteorological Office at Bracknell, said that the present consensus among scientists on the IPCC was that the Medieval Warm Period could not be used to judge the significance of existing warming. Dr Brown said: “The conclusion that 20th century warming is not unusual relies on the assertion that the Medieval Warm Period was a global phenomenon. This is not the conclusion of IPCC.” He added that there were also doubts about the reliability of temperature proxies such as tree rings: “They are not able to capture the recent warming of the last 50 years,” he said.
For some reason, within a day or two of reading these news releases, I emailed Mann asking for the location of MBH98 data (something that I’d never done before). My inquiry was very much related to the divergence problem as I wanted to see if any of his proxies were breaking new ground in the 1980s and 1990s – something that seemed inconsistent with the divergence issue.
I mention this background merely to show that the divergence issue has been very influential in my approach to this problem.
Briffa et al on Divergence
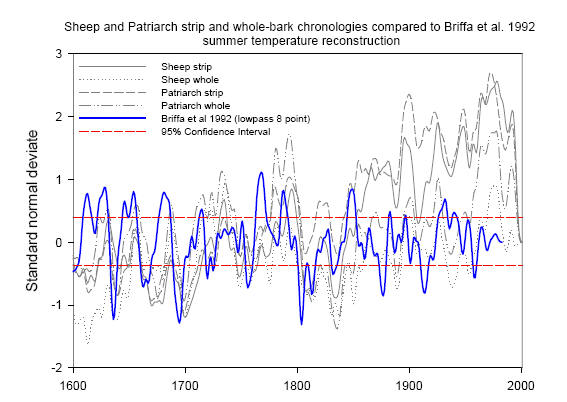
I’ve done a number of posts on Briffa and divergence, including 529, 536, 570, 586, 996. The Divergence Problem was originally raised in Briffa et al 1998, where there is an important figure from Briffa et al. [Proc Roy Soc 1998] showing the relative decline of MXD and RW relative to temperatures since 1960. While there have been a number of subsequent articles on MD divergence, this is a very rare figure on ring width divergence.

Briffa et al. 1998 Original Caption. Figure 6. Twenty-year smoothed plots of averaged ring-width (dashed) and tree-ring density (thin solid line), averaged across all sites in Figure 1, and shown as standardized anomalies from a common base (1881-1940), and compared with equivalent-area averages of mean April-September temperature anomalies (thick line). [SM – it looks to me like the labels in the caption are reversed between density and temperature]
One of the Briffa “cargo cult explanations” for divergence came from Briffa et al 2002, which Ross and I quoted in our NAS presentation:
Briffa et al. (1998b) discuss various causes for this decline in tree growth parameters, and Vaganov et al. (1999) suggest a role for increasing winter snowfall.
In the absence of a substantiated explanation for the decline, we make the assumption that it is likely to be a response to some kind of recent anthropogenic forcing. On the basis of this assumption, the pre-twentieth century part of the reconstructions can be considered to be free from similar events and thus accurately represent past temperature variability. [Briffa et al. 2002]
The Divergence Problem was an issue that grew legs during the NAS presentation after Cuffey noticed the difference between the D’Arrigo recon and temperature – to which Rosanne D’Arrigo answered: “That’s the Divergence Problem” referring him to the Briffa cargo cult explanations. See posts 570, 584,714 and 715 for the NAS panel on this. On presentation day, D’Arrigo and others were totally unable to give a coherent explanation of the matter, so this was an issue that I was very interested in seeing how the NAS panel treated it. (See 714 for my preview). They ended up relying (unsatisfactorily IMHO) on Cook et al as follows:
(111) The observed discrepancy between some tree ring variables that are thought to be sensitive to temperature and the temperature changes observed in the late 20th century (Jacoby and D’Arrigo 1995, Briffa et al. 1998) reduces confidence that the correlation between these proxies and temperature has been consistent over time. Future work is needed to understand the cause of this “divergence,” which for now is considered unique to the 20th century and to areas north of 55°N (Cook et al. 2004)… also that the difference between northern and southern sites found after about 1950 is unprecedented since at least A.D. 900.
In my review comments on IPCC AR4, I was extremely critical of their truncation of the “inconvenient” bits of the Briffa et al 2001 recon where it went down after 1960. IPCC decided that it was “inappropriate” for the hoi polloi to be shown a downtrending recon, but did insert a few sentences on the divergence problem, following a similar line as follows:
All of the large-scale temperature reconstructions discussed in this section, with the exception of the borehole and glacier interpretations, include tree ring data among their predictors so it is pertinent to note several issues associated with them….. Several analyses of ring width and ring density chronologies, with otherwise well-established sensitivity to temperature, have shown that they do not emulate the general warming trend evident in instrumental temperature records over recent decades, although they do track the warming that occurred during the early part of the 20th century and they continue to maintain a good correlation with observed temperatures over the full instrumental period at the interannual time scale (Briffa et al., 2004; D’Arrigo, 2006). This “divergence” is apparently restricted to some northern, highlatitude regions, but it is certainly not ubiquitous even there. In their large-scale reconstructions based on tree ring density data, Briffa et al. (2001) specifically excluded the post-1960 data in their calibration against instrumental records, to avoid biasing the estimation of the earlier reconstructions (hence they are not shown in Figure 6.10), implicitly assuming that the “divergence” was a uniquely recent phenomenon, as has also been argued by Cook et al. (2004a). Others, however, argue for a breakdown in the assumed linear tree growth response to continued warming, invoking a possible threshold exceedance beyond which moisture stress now limits further growth (D’Arrigo et al., 2004). If true, this would imply a similar limit on the potential to reconstruct possible warm periods in earlier times at such sites. At this time there is no consensus on these issues (for further references see NRC, 2006) and the possibility of investigating them further is restricted by the lack of recent tree ring data at most of the sites from which tree ring data discussed in this chapter were acquired.
This lack of recent data was elsewhere explained by Michael Mann and apologist Eli Rabett as due to the inordinate “expense” and time required to update these sites.
The Young Dendros
The “young dendros” presenting at the session, aside from Rob Wilson as chair, included many who’ve been discussed here – nearly always in favorable terms BTW: Andrew Bunn (220), Martin Wilmking (76,527,1319), Trevor Porter (an associate of Mike Pisaric 1278,1283,1287), Greg Wiles, plus some not as young dendros Glenn Juday (76,527,1319), Brian Luckman (many mentions here). Ze’ev Gedalof of Guelph, who’s been very helpful with the Almagre analysis, had an interesting poster on CO2 fertilization and it was disappointing that he didn’t get face time at the oral session, although it would be hard to say who should have been bumped.
Hughes had presented his bristlecone results at an earlier session on High Mountain Environments. Its not that he couldnt justify presenting at that session, but it would have been more stimulating to see what the young dendros worried about divergence would have made of Hughes results. However, Ed Cook was there. (I actually have a lot of time for Cooks articles which I find to be typically very substantive although I think that his article on the Divergence Problem is one of his weakest efforts.)
Bunn and Lloyd
The keynote presentation was by Andy Bunn, together with Andrea Lloyd. (In passing, Bunn mentioned to me that hes placed a number of his dendro functions in an R package.) Bunns presentation was one that most CA readers would have endorsed.
He noted that the Divergence Problem had arisen out of a concern over paleoclimate reconstructions, but observed that there were other reasons for concern over the problem, including forest management. In a poster, he and Andrea Lloyd showed that there were large areas of Arctic browning as well as greening.
As to possible causes of Divergence, he noted that trees were notoriously very plastic both in phenotype and genotype; that linearity was all too often assumed when the full range of variability had not been established; and that, until the mechanism for divergence had been established, one could not assume that the present divergence was unique. (I note once more that this latter point is a direct contradiction of a key NAS panel conclusions, one that I sharply criticized at the time.)
He noted all the different factors that could affect tree growth: temperatures, soil moisture, dimming, ozone, nitrogen, CO2 fertilization
He then presented a simulation very similar to one that David Stockwell worked up a couple of years ago in the context of CA discussions. He showed a simple simulation of CA type in which one factor (T) had an upside-down U response and a second factor (P) had a sigmoid-response and then showed a reconstruction based on plausible values of the two inputs, showing that a divergence problem easily arose in the past (medieval) period, in which the reconstruction failed to recover high values of Factor 1. In his words, if all you have is a value of 6, you cant tell whether you got it through 5+1 or 4+2.
Bunn’s emphasis on the need to provide an actual explanation of divergence was very healthy. He didn’t rebuke the cargo cult theories as I would have done, but the message was still there.
Martin Wilmking
Martin Wilmking reported the difference between positive and negative responders trees that might be only 10 meters apart. CA has covered Wilmking’s work in the past and, on one of the occasions that CA was being criticized by the one of the old generation of dendros, Wilmking observed that our coverage of his work had been very fair.
A point that he made in passing, but which deserves emphasis IMO was that the existence of positive and negative responders in close juxtapostion argued against the Divergence Problem being the result of ozone or dimming or some factor that would apply to all trees – a powerful argument against the cargo cult explanations of a still unknown anthropogenic factor. He said that pos and neg responders had responded similarly until recently when substantial differences arose. He argued that a chronology based on positive responders matched temperature well. The weakness in his argument – and this criticism was made by Andy Bunn in slightly different terms – is that any after-the-fact division of autocorrelated series into “positive” and “negative” responders might well generate something similar.
Laxton
Laxton (of Greg Wiles’ group) reported on three sites in the Gulf of Alaska: Mt Eyak, Glacier Bay and Columbia Glacier – in each case showing informative maps linking the tree sites to the nearby glaciers. She observed that the retreat of the Columbia Glacier had been accompanied by a derease in ring widths at the nearby Great Nunatak site, She hypothesized that the glaier might have generated a small high-pressure system, whih affected precipitation. IT was a pretty dramatic divergence example.
Juday
Juday presented results from productive white spruce sites. He presented temperature data from several sites, including a site Talkeetna, which he vouched for as having no UHI contamination. He observed that there had been dramatic warming in the 20th century across a broad range of temperature measurements – in particular noting almost a doubling of frost free days from 60 to 120 at one location – so it was quite clear that these were not adjustment artifacts, but real increases in temperature.
He said that his model worked well. He showed a fit through to 1996 and that the results through 2006 were consistent. (I’m not sure whether this was an actual out-of-sample demonstration (in the sense that the fit was done originally in 1996 and worked for new data or whether it was a calibration-verification split). In either case, it will be interesting to follow up.
Luckman
Brian Luckman (whose Alberta tree rings have been discussed previously here) presented results from a very large collection of Yukon sites none of which have been archived. Luckman has an abysmal record for not archiving data. Luckman came by my poster and I had a nice chat with him, but made a point of criticizing him to his face for not archiving his measurement data. I don’t get the reluctance. Maybe authors who archive data should stop citing papers by authors who refuse.
In his presentation, he said that climate-tree relationships in the Yukon sites were weak. He referred to the Jacoby-DArrigo TTHH site in passing a site mentioned in several peer reviewed articles. Luckman said that he couldnt figure out where the TTHH site and the location shown on the map was simply a guess. So its not just me thats frustrated by dendro secrecy. (One dendro mentioned to me that Jacoby and Cook were probably not being obstinate in refusing to identify the Gaspe location it was more likely that they failed to make a map and no longer knew where the site was.)
Porter (Pisaric)
Trevor Porter of Carleton presented some results on isotopes in the Mackenzie Delta (Mean Annual temp -9.6 deg C; mean summer 11.8 deg C; mean ann precip 254 mm). He had sampled 3 trees for O18 and C13 (Max Berkelhammer had previously reported O18 for 2 bristlecones in another session discussed
.) Values of dO!8 were typically between 19 and 22 with a dwonspike to about 17 around 1895.
Gagen
Mary Gagen reported on stable C isotopes from 5 European sites: LArnita, Finland (1640-2002); Turku, FIN (1895-194); Altai, RUS (1901-2000); Sandringham UK (1895-1994) and Glens, Scotland 1425-2005. dC13 levels at Larnita on her graphic were in the -23 to -25 range. She observed that dC13 values had remained very stable at most sites in the 20th century despite dramatic increases in atmospheric dC13. According to botanical understanding, this reflected a very sharp increase in Water Use Efficiency (a topic previously discussed at CA last year in connection with bristlecones here) This increase in Water Use Efficiency meant, in her words, that trees were behaving as though it were wetter than it really was.
Anhukaitis
The final presenter was Kevin Anchukaitis, working with Hughes, Vaganov and others, who is operating a Forward model of ring widths based on non-linear (trapezoid) responses to Temperature and Water. He reported on 3 northern sites: Twisted Tree, Coppermine and Hornsby Cabin (three Jacoby-DArrigo sites, for which only old versions have been archived.) HE said that no divergence arose relative to the model for Coppermine, but that divergences arose for Hornsby Cabin/Thelon and TTHH.
Conclusion
Focusing the session on the single topic of Divergence made for a good session and Rob Wilson deserves commendation for promoting the idea. In many sessions, it seems that authors tend to simply recapitulate their recent articles without necessarily making an effort to link their presentation to the topic of the session. But in this session, the authors all seemed to pay attention to the topic.
It’s not as though any answers were forthcoming, but the young dendros said that they viewed the situation as an opportunity, which is surely the right attitude. While many readers are totally dismissive of the data in the dendro collections, I’m not nearly so dismissive as it has the important advantage of being well-dated, the sites typically contain a “signal” even if we don’t know exactly what the “signal” is. Plus there’s a reasonable case that some of the other proxies (e.g. ice cores) are getting a bit of a free ride in terms of rigorous analysis, since they are so sporadic in provenance that statistical comparisons are much harder to do.
But again, my take-home impression was the dog that didn’t bark: the complete, and I mean witness protection complete, omission of any mention of the IPCC AR4 (and NAS Panel) excuses for divergence. The young dendros didn’t even waste their time arguing with them. They didn’t have an answer, but at least they faced the question.