Mystery solved

The mystery of what was hitting CA so hard has been solved (or at least identified). It’s all because of statistics.
Continue reading

New CPD Paper on Reconstructions

Here is the paper from MITRIE on climate reconstructions

M. N. Juckes, M. R. Allen, K. R. Briffa, J. Esper, G. C. Hegerl, A. Moberg, T. J. Osborn, S. L. Weber, E. Zorita, Millennial temperature reconstruction intercomparison and evaluation, Climate of the Past Discussions, 2, 1001-1049, 2006

There has been considerable recent interest in paleoclimate reconstructions of the temperature history of the last millennium. A wide variety of techniques have been used. The interrelation between the techniques is sometimes unclear, as different studies often use distinct data sources as well as distinct methodologies. Recent work is reviewed with an aim to clarifying the import of the different approaches. A range of proxy data collections used by different authors are passed through two reconstruction algorithms: firstly, inverse regression and, secondly, compositing followed by variance matching. It is found that the first method tends to give large weighting to a small number of proxies and that the second approach is more robust to varying proxy input. A reconstruction using 18 proxy records extending back to AD 1000 shows a maximum pre-industrial temperature of 0.25 K (relative to the 1866 to 1970 mean). The standard error on this estimate, based on the residual in the calibration period is 0.149 K. Two recent years (1998 and 2005) have exceeded the estimated pre-industrial maximum by more than 4 standard errors.

Continue reading

Blog Service

Update: the problem seems to be a little different than initially advertised and the server people have re-described the reason for the shutdown. The problem is due to the number of bytes served; it’s not due to a DOS attack. We didn’t get a 1-2 million hit spike after all. The problem is that we’re running at over 1 GB being served every day. For example, two weeks ago the weekly total from the stat sheet was 7 487 504 903 bytes. It seems like a lot for a blog.

The blog seems to be under some sort of attack. We suddenly started receiving 1-2 million hits per day and the service provider shut down the site. It’s been restored under a watch. I’ve obtained access logs from the service provider, maybe that will provide a clue. The access logs are 9-10 MB per day. Does anyone know how to analyze these things?

Willis on Hegerl

Willis writes: A couple of things.

First, I’ve digitized all of the Hegerl proxy data, and placed it here. I sampled it at ~three year intervals, and interpolated the actual years.

Second, I took a look at their reconstruction method. They say:

The first step of the reconstruction technique is to scale
the individual proxy records to unit standard deviation, weigh them by their correlation
with decadal NH 30-90°N temperature (land or land and ocean, depending on the target
of reconstruction) during the period 1880 to 1960, and then average them.

Now, except for one proxy, they are using decadally smoothed data. But for the reconstruction procedure, they have averaged out their data to the decadal level. Thus, they are basing their entire reconstruction on how well it fits vs. eight data points … it seems like this alone should put their error levels from “floor to ceiling”. Let me go see …
Continue reading

Southern Hemisphere Hurricanes

The other day we discussed missing data in the Northern Indian Ocean, where the main best tracks archive showed storm track data up to the mid-1970s but lacked wind speed estimates, with a sharp decline in storm track occurrences in the 1970s.

In his comment on Webster, Curry et al, William Gray observed that there were data problems in the Southern Indian Ocean and South Pacific as well. Webster, Curry et al acknowledged the problem in respect to the North Indian Ocean in their Reply to Gray, available on the internet but never published in a journal, but denied that this was material since North Indian Ocean storms were only a small fraction of total storm activity.

Today I want to look at the situation in the Southern Hemisphere, where the majority of storms occur in the South Indian Ocean.
Continue reading

My Hegerl Predictions – Results

The reconstruction in Hegerl et al (J Clim) was previously used in Hegerl et al (Nature) which provided some information on the number of series and some other particulars, but did not identify the series. In order to show how farcical the Hockey Team claims of “independence” were, I made guesses last spring about the proxies that would be used in the Hegerl et al reconstruction using a principle of least independence. I made an extremely accurate emulation of the Hegerl et al reconstruction as published in Nature simply using the proxies in Osborn and Briffa 2006, describing the process as follows:

I emulated the CH-long blend using the predictions in my earlier post as follows. All of the 12 predictions are in the 14-series Osborn and Briffa [2006] data set. I removed 2 series from the smoothed Osborn and Briffa data set (the Foxtail series and the Chesapeake Mg-Ca series) , took the average of the 10 series available in 1251 (that’s one more than CH so there’s an adjustment to come) and then scaled the average to the CH-long blend. I’ve obviously been able to replicate the CH-blend pretty accurately without them even having to say what proxies they used. Their weighting methodology is not an unweighted average of the proxies. So it’s hard to tell whether the remaining differences relate to weighting systems or different proxies. There’s at least one proxy that I’ve not matched. Also, I’d be surprised if Hegerl used the Alberta version from Luckman and Wilson [2005] – they probably used an older version.

A few days later, I made the following prediction about what proxies would be in Hegerl et al:
Continue reading

Hegerl Proxies: #1 – Mann PC1

The Hegerl et al 2006 climate reconstruction is finally online here . I’m going to go through the proxies individually before talking about method. Obviously the first one to look for is Mann’s North American PC1. Although they say that they’ve “moved on”, Mann’s PC1 was used in Osborn and Briffa 2006 and was one of my predictions when I tried to guess what proxies were used in Hegerl et al.

There is no mention of principal components whatever in Hegerl et al. They state that they used a western U.S . tree ring series, but clearly avoid any reference to principal components or bristlecones. They state:

western U.S.: this time series uses an RCS processed treering composite used in Mann et al. (1999), and kindly provided by Malcolm Hughes, and two sites generated by Lloyd and Graumlich (1997), analyzed by Esper et al. (Boreal and Upper Wright), and provided by E. Cook. The Esper analyses were first averaged. Although there are a number of broad similarities between the Esper and Hughes reconstructions, the correlation is only 0.66. The two composites were averaged.

Their Figure A1 shows that this proxy is available in 500- well before the start of MBH99 in 1000. MBH99 made no mention of the use of “an RCS processed treering composite”. Hegerl et al make no mention of Mann’s PC1 – and after all the publicity, you’d think that they’d make sure to mention any use of this controversial proxy. Here’s their series labeled as “w U.S.A. – Hughes”.

Fig 1. Excerpt from Hegerl et al 2006 Figure A1

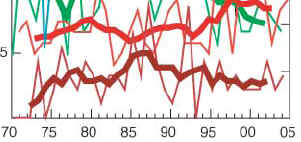
Now for comparison, here is a smoothed version of Mann’s PC1 from Mann and Jones 2003. Look familiar?

Fig 2. Re-plot of Mann and Jones PC1, with 21 year gaussian smooth.

Finally, for good order’s sake, here’s a plot of the Western U.S. series from Osborn and Briffa 2006, using their smooth as archived.

Fig 3. Plot of western U.S. series from Osborn and Briffa 2006.

I think that we can safely conclude that Hegerl et al 2006 used Mann’s PC1 and have incorrectly described what they used. How on earth could they have accidentally mis-described this series? It’s not as though Gabi Hegerl is unaware of the issues pertaining to Mann’s PC1. She was at the NAS Panel for example.

In terms of my predictions of what Hegerl et al 2006, I’m scoring this 1 for 1 so far. I’ll keep going through my predictions individually over the next few days.

New Hurricane Data Archive

On Aug 26, 2006, Judith Curry made the following comment about cyclone data, mentioning that re-processing had been done back to 1983:

The tropical cyclone data really is rather a mess, the NATL is definitely the most reliable, so I am focusing on that data set (with all its warts) until the global satellite data is reprocessed and reanalyzed. This has already been done back to 1983 (paper in review), they should be able to go back to 1977 with alot of hard work, then before 1977 it will be a bit dodgy since it is not clear what kind of shape some of that data is actually in. The problem is that until very recently, people have not been using the hurricane data as a climate data record (mainly used for regional damage estimates etc), so there hasn’t been much incentive until recently to try to get this data in shape.

An enormous ftp archive on all hurricanes from 1983 to date is now online (the directory ftp://eclipse.ncdc.noaa.gov/pub/isccp/b1/hurr which hosts the actual data is dated Sept 18, 2006 so we’re keeping you up-to-date).

The host page is here ; with the ftp location here. The new data set is descibed here . To give you an idea of the size of the archive, the zip file for an individual basin for an individual year range up to 678 MB in size. So there has been no stinting on providing raw data.

Right now, it’s an imposing data set, but certainly more data than I’m interested in or can handle. I don’t know whether there are plans to provide summary data (the Best Tracks data in total is much less than 1 MB in size.)

Northern Indian Ocean Hurricanes

I’m looking at some of the details of the Webster, Curry et al 2005 claim that the proportion of intense hurricanes has increased. While I was doing so, I noticed an interesting issue in the Northern Indian Ocean tropical storm counts. Here is an excerpt from Webster et al 2005 Figure showing the count of cyclonic storms per year. The brown curve is the North Indian Ocean.


Webster et al 2005 Figure 3. Number of Cyclonic Storms/Year. Brown is North Indian Ocean.

I’ve collated storm track data and here is what I obtained when I tried to replicate the count for the Indian Ocean. Note that the period covered in the graphs are different. The solid line is the count according to the archive of storm tracks. However in this area, most storms do not have any wind speed estimates. For example, the 1970 Bhola Cyclone killed over 300,000 people in Bangladesh, but has not wind estimates in the archive is not counted as a storm in the Webster et al graph. The red dashed line shows the number of storms with wind speeds exceeding 18 msec-1 (and this is virtually identical to the number of storms with any data). If you look closely, the corresponding counts in Webster et al differ in detail for unknown reasons.


North Indian Ocean – Number of Tropical Storms. Collated from information at http://weather.unisys.com/hurricane/indian_oc/

A couple of questions obviously arise – which may or may not be easy to resolve. There’s a sharp decrease in the number of tropical storms whose storm tracks are archived in 1976 – with seemingly different average levels before and after 1976. Is this due to a measurement artefact or to some climatic change? I have no idea. There is no discussion of the issue by Webster et al. It’s too bad that climate scientists reporting on hurricane counts in Nature and Science are not obligated to provide such accounting details.

Webster et al observed of the Pacific data:

The need for reprocessing the western North Pacific tropical cyclone data set is very clear.

This would also seem to be true of the North Indian Ocean data.

It’s also worth noting that North Indian Ocean SSTs were supposedly rising particularly quickly according to Hansen’s PNAS article, discussed here recently, but the number of tropical storms in the North Indian Ocean has not increased according to any metric.

Emanuel – Pacific Adjustments

By far, the most important issue in Emanuel 2005 is Emanuel’s adjustments to West Pacific hurricane wind speeds. I’ve reached this conclusion after expenditure of a considerable amount of time and effort, including looking at every Annual Report of the Joint Typhoon Warning Council from 1959-2003.

After doing this, I stumbled on a Comment by William Gray, which was rejected by Nature – which states the problems with the Pacific adjustments in very clear terms. While Gray’s Comment could be and should be pruned, Nature has distorted the record once again by failing to publish a comment that was actually more pertinent than the comments by Pielke and Landsea, both of which were also meritorious.

Although Emanuel’s Pacific adjustments were new, they were not mentioned in the body of Emanuel 2005, although they were described in the Supplementary Information – which might not even have been considered by reviewers. Emanuel himself has added a link at his website to Cleartheair.org, which has developed a sensationalistic graphic of his results. Continue reading