Kevin Vanes writes at Roger Pielke’s site:
The WSJ highlights what Regaldo and McIntyre says is Mann’s resistance or outright refusal to provide to inquiring minds his data, all details of his statistical analysis, and his code. The WSJ’s anecdotal treatment of the subject goes toward confirming what I’ve been hearing for years in climatology circles about not just Mann, but others collecting original climate data. …
As concerns Mann himself, this is especially curious in light of the recent RealClimate posts (link and link) in which Mann and Gavin Schmidt warn us about peer review and the limits therein. Their point is essentially that peer review is limited and can be much less than thorough. One assumes that they are talking about their own work as well as McIntyre’s, although they never state this. …
Of their take on peer review, I couldn’t agree more. In my experience, peer review is often cursory at best. So this is what I say to Dr. Mann and others expressing deep concern over peer review: give up your data, methods and code freely and with a smile on your face. That is real peer review….
Your job is not to prevent your critics from checking your work and potentially distorting it; your job is to continue to publish insightful, detailed analyses of the data and let the community decide. You can be part of the debate without seeming to hinder access to it.
Link
Jerry Pournelle writes at Chaos Manor
I had refrained from commenting on the "hockey stick" because I couldn’t understand how it was derived. I’ve done statistical analysis and prediction from uncertainty much of my life. My first job in aerospace was as part of the Human Factors and Reliability Group at Boeing, where we were expected to deal with such matters as predicting component failures, and deriving maintenance schedules (replace it before it fails, but not so long before it fails that the costs including the cost of the maintenance crew and the costs of taking the airplane out of service are prohibitive) and other such matters. I used to live with Incomplete Gamma Functions and other complex integrals; and I could not for the life of me understand how Mann derived his famous curve. Now I know: he hasn’t told anyone. He says that telling people how he generated it would be tantamount to giving in to his critics. More on this after my walk, but the one thing we may conclude for sure is that this is not science
Link
A quick post to say that the weblog has been mentioned in comments in slashdot. Prepare to repel boarders!
I was a little unsure as to whether to post an article on slashdot, as I was afraid that being "slashdotted" would use up the bandwidth we’re allowed for the next year…this might be a little bit better – a controllable flow rather than a flood.
And to whoever wrote those comments, thanks for sharing!
Wilmking et al. carried out a comprehensive sampling of 1558 white spruce trees at 13 treeline sites in the Brooks Range and Alaska Range. The date of the sampling is not stated but seems to be between 2000 and 2003 and includes the warm 1990s. These findings cover the same species as were primarily used in Jacoby and d’Arrigo’s northern treeline temperature reconstruction, used in multiproxy reconstructions Jones et al [1998], Jones and Mann [2004] as well as MBH98. They found that 40% of the trees had a negative growth response to increased temperatures, 36% had a positive response and the balance had no significant response. They state:
Without accounting for these opposite responses and temperature thresholds, climate reconstructions based on ring width will miscalibrate past climate.
Continue reading →
Moberg et al. [2005] use the July temperature reconstruction of Korhola et al. [2000] using Lake Tsoulbmajavri diatoms as one of 11 low-frequency proxies, as shown in Figure 4 of Korohla et al. reproduced below. There is obviously nothing in this reconstruction that is inconsistent with a pre-hockey stick view of climate history.
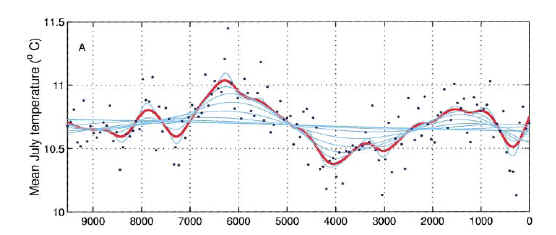 . (Original) FIG. 4. Reconstructed mean July temperatures at Lake Tsuolbmajavri for the last 10,000 years Continue reading →
While Steve McIntyre gets his visage on international TV (and, so rumors say, have his front door widened), here on the weblog we can still play our game of "Spot the Hockey Stick", the temperature reconstruction that, according to William Connelley, was made into a totem of global warming by skeptics and not by the multi-billion dollar greenhouse warming industry. I’m not a PhD, so who am I to disagree?
Clearly skeptics can do amazing things, like get this one reconstruction plastered all over the news, the IPCC 2001 TAR and SPM, teeshirts and posters, the Arctic Climate Impact Assessment, as well as numerous books, and manage to get it cited twice as much as any comparable paper of its age in research papers, whose authors sometimes forget to store their data somewhere safe where they can find it later.
You see, skeptics can do amazing things, and so to prove our powers of suggestion, I invite you to send sightings of our favorite graph to my secret hush-hush e-mail address, proudly funded to the tune of nothing at all, by evil fossil fuel industry slush funds.
The address is climateaudit AT gmail.com
(Yes, I know its not AT exxonmobil.com because they wanted to be subtle)
I’m off to be interviewed by the Dutch television program Netwerk, on the station KRO. It airs this evening Dutch time. Update: this is online here. I was on television on Tuesday for the first time in my life – ROB TV in Toronto online here about halfway throught the show (Squeeze Play), so this is all very new for me. KRO has a short summary here.
The Chesapeake Bay Mg/Ca proxy goes to late 1995 and is used in both Moberg et al [2005] and Mann and Jones [2003] for the proxy reconstructions up to 1980. Figure 1 below shows that its post-1980 behavior does not show an exceptional response to supposedly unprecedented temperature.
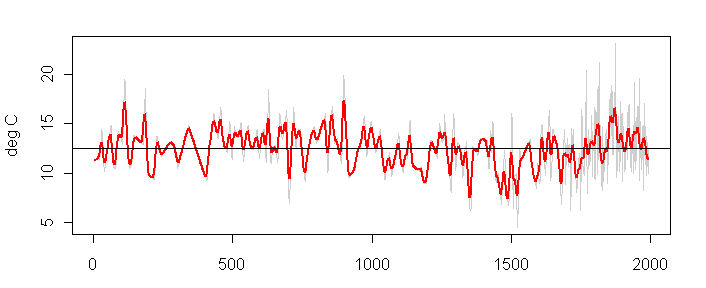
Figure 1. Chesapeake Bay Spring SST. Re-plotted from data at WDCP Continue reading →
Another instalment of our favorite game. This time it’s from the Arctic Climate Impact Assessment, which was published with big fanfare and a slew of scary headlines and quotations in October 2004.
The documents are stowed in the AMAP documents database and contain some of the slickest, glossiest presentations that I can remember. They’ve obviously got plenty of money to produce this stuff.
Anyhow, to show off their presentation skills, they’ve managed to produce the Mann Hockey Stick in 3D in the executive summary. Clearly the use of the Hockey Stick as a totem for climate change is as strong as ever, despite the downplaying of the reconstruction on realclimate.org.

D’Arrigo et al. [GRL 2004] reports on tree rings taken from the Seward Peninsula in northwestern Alaska from white spruce from 14 sites near elevational treeline in summer 2002. We show here their figures, demonstrating that the "proxy" show no evidence of the warm 1990s and hot 1998, raising questions about the ability of this type of commonly used proxy to pick up similar warm periods in the past.
 Continue reading →


More Commentary #2: Kevin Vanes
Kevin Vanes writes at Roger Pielke’s site:
Link