Today I will review the timeline of the above WMO 1999 graph in the light of the ClimateGate (CG) letters. The main events took place on Tuesday, November 16th, 1999.
Things start rolling 9 AM (UK time), when Tim Osborn sends the new Briffa and recalibrated Jones (1998) time series to Phil Jones along with the suggestion to hide the decline.
It is ready calibrated in deg C wrt. 1961-90, against the average Apr-Sep land temperature north of 20N. It goes from 1402 to 1994 – but you really ought to replace the values from 1961 onwards with observed temperatures due to the decline.
Twenty minutes later Jones writes to the MBH crew (cc Briffa and Osborn) explaining WMO plans and exactly what the graph will look like.
Jones explained that the graph was intended for the cover of the WMO annual statement, which had a print run of 10,000. Jones said that he had voted against using the millennial series in the promotion because he knew that he had “oversold the advances in paleoclimate”:
The pertinent item from Geneva concerns the WMO statement on the Climate of 1999. WMO has been issuing these for the past 6 years. There are 10,000 printed each time. There were two possibilities for the front cover (1998’s showed the instrumental record from 1856) – the millennial long temperature series or the contrasting storm tracks for 1998 and 1999. I was the only one voting for the latter – partly personal as I knew I would have to organise the former. I was outvoted 12-1, maybe because in a brief presentation I oversold the advances made in paleoclimate studies over the last few years !
Jones explained the planned figure to MBH as follows:
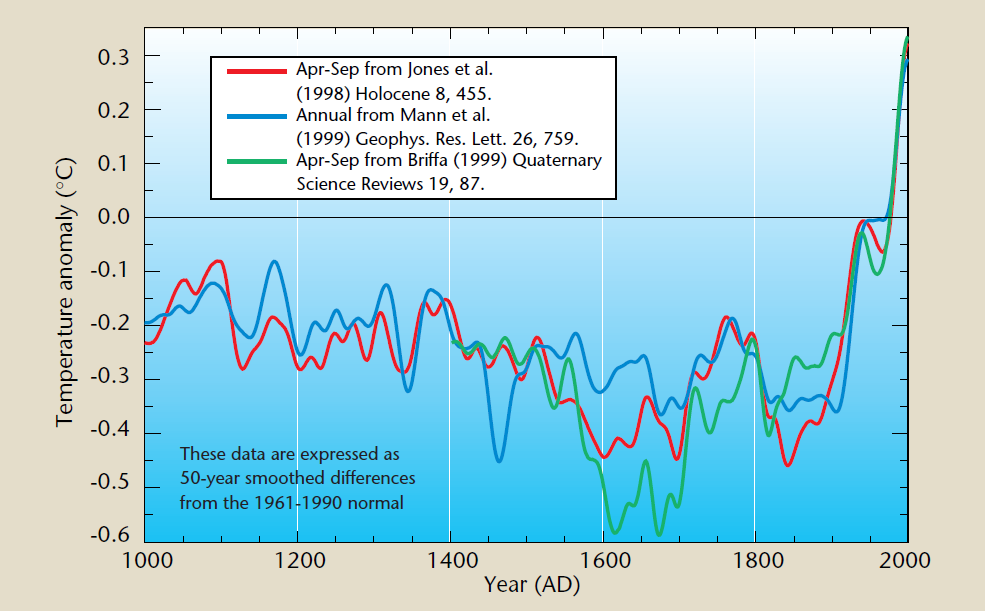
WMO want to go with the millennial record on the cover and I said I would produce something and some text. The figure will be the 3 curves ( Mike’s, mine amd Keith/Tim’s). Tim is producing this curve (all wrt 61-90 and 50 year smoothed). Each will be extended to 1999 by instrumental data for the zones/seasons they represent.
Along is also attached the draft of the brief text to appear on p.4 of the report for the comments. Jones further brags about the importance of the WMO publication.
The full text of the report is then printed during Feb 2000 – last year’s was 12 pages long. It will be released on March 15 in Geneva to coincide with WM (World Met) day and the 50th anniversary celebrations of WMO as well. WMO are planning to print at least twice as many copies as usual and were talking about 25,000 ! Copies go to all WMO members and are distributed at countless meetings and sent to loads of address lists available.
After that Jones apparently begins to work with the times series. He’s ready 1:30 PM and sends the now infamous trick email. (Bradley appears to have commented already, but the email is not in the dossier.)
Once Tim’s got a diagram here we’ll send that either later today or first thing tomorrow.
I’ve just completed Mike’s Nature trick of adding in the real temps to each series for the last 20 years (ie from 1981 onwards) amd from 1961 for Keith’s to hide the decline. Mike’s series got the annual land and marine values while the other two got April-Sept for NH land N of 20N. The latter two are real for 1999, while the estimate for 1999 for NH combined is +0.44C wrt 61-90. The Global estimate for 1999 with data through Oct is +0.35C cf. 0.57 for 1998.
Thanks for the comments, Ray.
Note that Jones clearly explained what he means by “Mike’s Nature trick”. Mann has claimed that his “Nature trick” was nothing more than clearly showing observations and reconstructions on the same graphic with proper labeling. But the direct comparison of observations to reconstructions is as old as statistics – and Jones and Briffa had themselves made such comparisons in prior articles without regarding clear labeling as anything more than elementary hygiene. In this email (which is often shortened in quotation), Jones says that Mann’s “Nature trick” is “adding in the real temps to each series for the last 20 years (ie from 1981 onwards) amd from 1961 for Keith’s”, as originally explained in November 2009 here.
Two hours later Michael Mann, who according to his legal documents “had absolutely nothing to do” with the graph (that is still worth a mention in his CV ), responds. He completely agrees with the text adding that it will “help to bolster the claims to be made in IPCC [AR3]”:
The text looks good, and I agree w/ everything that is said. I think its a strong but defensible statement, and will help to bolster the claims to be made in IPCC. The ’99 numbers are very interesting, and should help thwart the dubious claims sometimes made that El Nino is the sole culprit in the anomalous recent warmth.
There is no objection to the graph, which, according to Mann’s book of Fairy Tales, is undisputably misleading (crediting the whole figure to Jones).
and Jones’s 1999 World Meteorological Organization (WMO) report cover graph depicting past temperature trends was criticized as potentially “misleading” for merging proxy and instrumental data into a single curve — a conclusion nobody really disputed.
Mann further tries to help by sending “for comparison” the draft version of the IPCC AR3 Figure 2-21, and explains a nice “trick” how to handle the baseline in the face of the decline.
Just for comparison to what Tim is producing, I’m attaching the plot you may remember that we (actually, the UK Met Office staff) prepared for the final version of the IPCC chapter 2 draft (in pdf format). To refresh your memory, we used the ’61-90 base period for the absolute anomaly scale, but we aligned the series based on an earlier (’31-60) interval of the instrumental record, which pre-dates (largely) the recent decline in the Briffa et al series. I think this leads to a similar picture, but if you think there are any significant discrepancies w/ what Tim is preparing, we should discuss.
Ten minutes later Osborn sends the draft figure to Jones, who forwards it to the crew half an hour later with the baselining explained.
Keith and Tim’s diagram is the new one that didn’t make it to the present IPCC draft. For the other two, yours has 0.12 added to it to correct your base period of 1902-80 (can’t remember your exact dates) to 1961-90. For mine we’ve used a mean and SD calculated by Tim based on April-September average temps from the NH Land series north of 20N.
There is no protest from the MBH crew after after seeing the figure, and only Malcolm Hughes comments an hour later.
Dear Phil – the text looks fine to me. I have no strong preference regarding the diagrams, except that hte one Mike circulated hs the advantage of sowing an estimate of uncertainties.
So far only Keith Briffa appears to have not made comments about the publication. However, we see his acceptance from the letter written next morning to an Elsevier editor inquiring if the new version for Briffa’s QSR (2000) Figure 5 had been substituted.
Amanda
with regard to the earlier message ( copied below) could you confirm the the new Figure was substituted as I now wish to cite this in a forthcoming WMO publication that will be widely distributed.
QSR (2000) is the reference for Briffa’s series given in the WMO publication, and later in the IPCC AR3. The email is important on its own as it explains the troubles I (and George Kukla, see below) had 15 years later.
Apart from throwing Jones under the bus Mann’s defence line of this “overly simplified and artistic depiction” (per Mann’s Reply Memorandum) has been that the “simplified” figure was produced with a “largely nontechnical audience” in mind. The modern Arabian Nights tells us:
That, in short, was the “trick” that Jones had chosen to use to bring the proxy temperature series in his comparison up to the present, even though the proxy data themselves ended several decades earlier. There was one thing Jones did in his WMO graph, however, that went beyond what we had done in our Nature article: He had seamlessly merged proxy and instrumental data into a single curve, without explaining which was which. That was potentially misleading, though not intentionally so; he was only seeking to simplify the picture for the largely nontechnical audience of the WMO report
However, as can seen from the above, there was no consideration of the special audience when the graph was produced. Instead, Mann argued that it will “help to bolster the claims” to be made to the IPCC audience.
Further, it appears from the CG letters that the “overly simplified and artistic depiction” was further distributed among their colleagues for the scientific purposes. In February 2000, Bradley requests the figure for the possible use in the PAGES systhesis report.
can you send me another copy of the wmo figure that you prepared — at least, if it changed after 11/16/99. In re-visiting your notes on the one you sent then, it seems you were still fiddling with 40 or 50 year filters etc, so maybe the one i have isn’t final. We may end up using this in the PAGES synthesis chapter –I think it is different than the one Keith used in Science (May 7, 1999 –v284, p.927)
In April 2000 Jones sends the figure along with the spliced times series to Curtis Covey
The attached file has the data you want. There are 5 columns (mine, Mike Mann’s, Keith’s, Annual NH and JJA NH). The last two are instrumental and only start in the 1850s. Keith’s starts about 1400. All are wrt 1961-90. You will see that for the 3 multiproxy series this file has been extended to 1999 by adding in instrumental data for the season and region each was supposed to represent. The other attachment is a figure of the first 3 which has appeared on the front cover of the WMO statement for 1999.
and later in October 2000 to Jim Hurrell.
Tim can send you one with all the series in. wmocover.ps is what appeared on the front cover of the 1999 annual statement. On this the series have been extended with equivalent instrumental data to 1999.
In fact, it seems that they were so proud of the figure that they placed the graph on the back of the official CRU t-shirt, which Mann was more than happy to request.
p.s. I wear a medium 😉
The WMO figure makes one more appearance in the CG dossier. In a remarkable letter, worth reproducing in full, late George Kukla writes in January 2001 to Keith Briffa, in which Kukla asked Briffa about the inconsistency between the WMO presentation of the data and the decline shown in Briffa’s technical papers, describing the WMO presentation as “not very responsible”:
Dear Keith,
You are the only guy who may know what was and is going on in the northern forests. With respect to that I do not think that the WMO statement # 913 on the status of the global climate in 1999 is a sufficiently reliable last word. For one thing: the curve attributed to you doesn’t seem to jive with any of the figures of your 2000 QSR paper. Where from did they get the 0.6 degree departure at 1600 AD?Another problem: the ring density and width in the last several decades are both decreasing which at any other
time would be interpretted as a sign of cooling. So why is it shown in the WMO report as an unprecedented warming? As you properly discuss in your papers we just do not know how exactly do the tree rings relate to weather. In my understanding we are left with the following options:1) The calibrations of the rings to temperature prior to 1950 are biased, possibly due to the poor coverage of temperature stations.
2) Something other than the temperature influenced the trees in the last several decades and we do not know what.In either case it is not very responsible to relate the curves to global climate as WMO has done. You are saying it, albeit somehow indirectly but pretty clearly, in all your papers. Unfortunately it appears that these are tooo long for WMO to read.
Ciao and greetings to everyone down there!
George
I think it’s fair to say that George Kukla was first to spot the Hide-the-Decline.
[Edit: By Barry’s request, “before” and “after” pictures:
 ]
]


149 Comments
maybe you could add a graphic, that shows thermometer removed and hidden decline included?
Like Richard Muller did.. (screen capture from his video)
https://7d0b1bd7-a-62cb3a1a-s-sites.googlegroups.com/site/transcriptgraphics01/home/muller_20101001-3215/MULLER_20101001-3215.jpg?attachauth=ANoY7cr94GlufvGTtRV6OE2AvzMjeWjkug1DHlpTZrHIlQwnAEBRbVwUj0lN1z5IGmABg57riyHY44YHZ9rTp0zi04PTJ8x_VQMdDZeEoUhXJ7b4pid2SGtPLtZQLqJmMCPtIUu7cT2PN_AiVXAIo39Yuzc9IOGisPXC2ef4Ekz32bFmrkcQiRmCFzi02__-HIZF79xuZyo7zSllQDnHVvdIHSvbpqAqjmmdU0E-1mj3rt4nhubqQ7Du2b5mZ2QVRh9C-X8NQGCPmIbRcro5bgJ_LxFjN9j3qA%3D%3D&attredirects=1
would really help show what the deception was.. (picture speaks a thousand words, etc,etc)
ie it becomes really really obvious to any casual observer, when the graphics are side by side.
http://wattsupwiththat.com/2011/02/25/currys-2000-comment-question-can-anyone-defend-%E2%80%9Chide-the-decline%E2%80%9D/
(worth noting Prof J Jones comment about Hide the decline, quoted in the WUWT link)
transcript of muller video with screen captures here:
https://sites.google.com/site/mytranscriptbox/home/20101001_m3
Jean S: Done.
Ive followed the climate debate for 10 years but I’ve not seen these two graphs displayed side by side. I am stopped in my tracks at the deception they have engaged in. It is very serious. We are comparing two totally different measurements when the observed is grafted onto the proxy – how scandalous
Best
Michael
Ditto on your comment. The two graghs compared side by side make a stark impression and that is all that is needed.
The catalyst which ignited ‘general public’ skepticism worldwide.
Surprisingly, http://www.HideTheDecline.com is still available for purchase. What a great domain around which to aggregate and summarize the articles and graphics for this case of (what appears to me to be) scientific malfeasance.
Really nice article. This summary of the events is excellent.
Reblogged this on Centinel2012 and commented:
Great work, even though I knew what was done your time line really lays it out. Any one that was involved with this travesty should have there degrees revoked; what ever there are that are not scientists!
Unprincipled non-scientists who got away with far too much for far too long.
Having more than enjoyed their day in the sun , lets hope that sooner rather than latter their feet are held to the fire.
…and let’s not forget Mann’s vigorous rejection in 2004 of the very idea of splicing proxy and thermometer records, let alone rubbing out decades of proxy data and replacing them, without disclosure, with numbers that shoot off in the other direction:
“No researchers in this field have ever, to our knowledge, “grafted the thermometer record onto” any reconstruction. It is somewhat disappointing to find this specious claim (which we usually find originating from industry-funded climate disinformation websites) appearing in this forum. Most proxy reconstructions end somewhere around 1980, for the reasons discussed above. Often, as in the comparisons we show on this site, the instrumental record (which extends to present) is shown along with the reconstructions, and clearly distinguished from them (e.g. highlighted in red as here).”
See more at: http://www.realclimate.org/index.php?p=11#comments
There’s a great quote from Jones in his email to MBH, explaining why the graph was chosen as the front cover. He admits it was:
“because in a brief presentation I oversold the advances made in paleoclimate studies over the last few years !”
Yes, this figure was competing with another nonpaleo one. I think without Mike’s Nature Trick, they lose the cover entirely.
“because in a brief presentation I oversold the advances made in paleoclimate studies over the last few years !”
I made a few small edits, including the addition of Jones’ statement that he had “oversold” the paleoclimate advances to WMO. If people are interested, we can also make a pdf of the emails in chronological sequence, extracting from threads. I’ve spent an inordinate amount of time doing this, as has Jean S. Jean S’ quotes are NOT taken out of context.
I also added a paragraph commenting on “Mike’s Nature trick” – linking to Jean S original post on the topic on November 20, 2009. Mann’s pleadings (unsurprisingly) misrepresent “Mike’s Nature trick”, claiming that it was nothing more than comparing observations and reconstruction on the same graphic with clear labeling – though such comparisons are as old as statistics and hardly original to Mann.
Can you put the quotes on a t-shirt? 🙂
I’d buy 🙂
quotes printed on the inside with S&M label visible on the outer garment(all upside down of course)
All the years of accumulating data from these events has left me fuzzy, but wasn’t it Mann who first denied that no one was aware of anyone “ever” splicing observed temps on to proxies, almost indignantly? When was that vis a vis the events depicted in this fine post? And wouldn’t it expressly contradict what is detailed here?
Steve: yup. See a few earlier comments linking to http://www.realclimate.org/index.php?p=11#comments
Actually, that quote would fit nicely in the article above.
Were the observed temps subjected to some statistical function after splicing, creating a new, incorporated “whole” that the Racehorse crowd would argue makes Mann’s statement somehow technically accurate? I/O/W, was it “smoothed’ or “filtered” (I am a layman and those terms make me thirsty) to create a new “curve” which is not simply the proxy + obs temps?
I think the whole Mann paragraph Steve linked to above fits nicely with the discussion above as well as with recent posts”
Note the comment he makes about “most” studies validating a reconstruction during recent times. I’m trying to recall just how many proxy reconstructions don’t validate themselves during recent times. If there are as few as I think there are, this “most” comment could be a recognition of the Shweingruber series in particular during the same sentence where he denies doing what he actually did.
I thought he posted a followup to this comment acknowledging that MBH padded with the mean taken from the instrumental record.
Excellent collation, Jean. When Mann admits something is wrong, even as he denies culpability, it’s an indication that something is very wrong. You’ve exposed here all the symptoms of climate-change fever: data manipulation, confirmation bias, and blatant dishonesty.
Googling ‘climategate emails out of context’ yields 37,800 hits.
Names high on the list include Mann, Gore, Trenberth, Greenpeace, desmogblog, etc.
Retractions forthcoming/sarc
Jean S’ diligent work is appreciated – Steyn must be just dying to hug him!
One for the history books.
===============
How ironic: Jean S pulls together a narrative in which the Team, in their own voice(s), reveals the very facts, motivations and manipulations that the Skeptics (Steve, Ross, Jean, Jeff, Andrew, et al) have been teasing out for years.
It is a very clear narrative; I have a hard time conceiving of an alternative point of view that is credible and charitable.
Meanwhile, the indoctrinated march on, like moths attracted to a flame, regardless of the fact that scepticism is a basic principle of the scientific method.
Quote:
“Usually, the “skeptical way of thinking” is embodied in the scientific method.”
http://en.wikipedia.org/wiki/Scientific_skepticism
I wrote something of a response to this, but also, a discussion of proxies and graph building and such:
http://scienceblogs.com/gregladen/2014/09/22/steve-mcintyre-misrepresents-climate-research-history/
Jean S: I did not notice you responding anything in this article or I do not understand your ad-hom attack on Steve as you clearly recognize that this post was not written by him. In fact, I’m not even sure if you actually read this post. I’m positive you did not understand it. Of course you write whatever you wish, but I’m sure even most of your readers are capable of recognizing where the substance is.
Greg,
Your article is beyond my comprehension. Maybe if you use simpler words next time……
Greg Laden. You say
Phil Jones’s most famous quote in Climategate
The email had just three recipients – Mike Mann, Ray Bradley and Malcolm Hughes, with cc Keith Briffa and Tim Osborn.
Michael Mann was an active participant in the discussion, sending a reply just two hours later. Further, excluding salutations the words & number counter of the email is just 104. If this was a slur on Mann’s good name, why no response from him or his friends?
Further, Mann’s response two hours later was to the same group. It says
Mann not only assents to what is being put forward, he puts forward something that corroborates the final graph. This looks to me like eager approval of splicing the proxy and the instrumental record. Further, if he was not the real inventor of this “trick”, then he failed to deny it at the time.
Yes, indeed, they spliced the proxy and instrumental data. That. Was. The. Point. Of. The. Graph.
Jean S: We have a winner! We found a person, who is disputing the fact that merging proxy and instrumental data into a single curve is misleading. Not only that, according to you, it was the purpose of the graph! Or are you saying that it was purpose of the graph to mislead?
Nowhere in the quoted emails is there any suggestion or approval or any indication by Michael Mann of seamlessly merging proxyindicator data and instrumental data.
I know, I now, this is hard.
Jean S: Yea, are you saying that he didn’t approve it, but approved the plan, didn’t say anything when was given the graph, and later requested a t-shirt and added the graph to his CV? And again, here’s the file from which you can see why Jones called it mike’s Nature trick: http://www.meteo.psu.edu/holocene/public_html/shared/research/MANNETAL98/fig7-nh.dat
How does one explain this? (I’m just a lurker!)
“No researchers in this field have ever, to our knowledge, “grafted the thermometer record onto” any reconstruction.
The nuance escapes me!
Yes, and simply discounting the ‘decline’ did nothing to (falsely!) increase the credibility of the pre-instrument reconstruction, right? I am not certain if ‘dense’ or ‘obtuse’ is a more appropriate adjective.
I think Greg Laden is providing a valuable service to Steyn’s lawyers with his obduracy and logical contortions. Steyn’s lawyers can essentially assume there will be other more informed diehards who Mann may use as witnesses to support his arguments. It is best the lawyers anticipate that they will have to deal with folks whose commitment to a cause makes them blind to the reality of what Mann has actually done or caused to be done or has helped facilitate. They will need a raft off “yes” and “no” questions that limit the chances of wriggling of their self-made hooks. It will likely get frustrating as Ladenesque logic is applied to the obvious to make it appear that black is white and vice versa.
Greg Laden:
Please give me the reference supporting your statement, ““At around 1960 the ability of the tree ring data to represent regional temperature declines and the tree rings become useless. Prior to that time the data should be used. After that time the data should be discarded.”
All right, I give up. There is just no way to make sense of Laden’s comments. “The Point of the Graph” – just unmentioned? The word “seamlessly”? Whatever; it’s a waste of effort.
Greg said;
“Yes, indeed, they spliced the proxy and instrumental data. That. Was. The. Point. Of. The. Graph.
Nowhere in the quoted emails is there any suggestion or approval or any indication by Michael Mann of seamlessly merging proxyindicator data and instrumental data.
I know, I now, this is hard.”
The facts are thus:
“…they spliced the proxy and instrumental data”, as you say. They did not note or define any seams in the splice. E.g. they seamlessly spliced (aka merged) the proxyindicator data and the instrumental data.
No, that is not hard to understand.
So according to Greg Laden, Michael Mann is incapable of understanding The. Point. Of. The. Graph.
@RovingBroker
It’s Briffa himself whom I believe has made the quote about the divergence…
I believe it was discussed at CA back here:
And pre-climategate here:
It’s also ‘covered’ by Sks here: http://www.skepticalscience.com/Mikes-Nature-trick-hide-the-decline.htm
But JeanS (who brought up this same thing like 3 years ago) doesn’t look like he was directly responded to, despite being the first post.
I’ve been having trouble finding the relevant Briffa quote (because it’s actually been said more than once and in different ways), but here’s one…
—–
Briffa et al 1998a (Nature 391): During the second half of the twentieth century, the decadal-scale trends in wood density and summer temperatures have increasingly diverged as wood density has progressively fallen. The cause of this increasing insensitivity of wood density to temperature changes is not known, but if it is not taken into account in dendroclimatic reconstructions, past temperatures could be overestimated.
—–
One of the issues skeptics face in countering claims by the actual scientists that obtained and/or first analyzed the data, is that the way that these scientists enter the data into the record through peer-review ends up becoming more-or-less the standard for how it should be viewed and used. So, if Briffa declares his data is ‘less sensitive to temperature’ ONLY after 1960 or whatever and this should be discarded, then what can you say? What malfeasance can you impute to scientists that use the Briffa data and simply point to his own peer-reviewed sentiments on it as a deference without even getting into it on your own. It’s the same reason for the consternation of skeptics regarding all sorts of ice-core data that would appear to show a different temperature chronology– yet the ones who obtain/published it first declared at the outset that using it for temperature isn’t advisable (post-hoc or otherwise).
You can bet that Revkin is reading this.
How will he deal with it?
As it might be thought of as being representative of a specific body of paleoclimate science research, is there some specific version of the Hockey Stick — or possibly some specific combination of Hockey Stick versions which appear on a single graphical illustration such as TAR Figure 2-21 — which represents the most commonly accepted “state of the art” version which is now in use today?
For example, if one were to examine a collection of climate science textbooks used in preparing college students for careers in the climate science research community, how would the Hockey Stick most often be depicted in those textbooks? As an illustration similar to TAR Figure 2-21, or would it be some other kind of illustration?
Greg Laden has published yet-another absurd post. Somehow he is simultaneously recognizing that this post was written by me (with small edits by Steve), yet accusing Steve of mispresenting “climate research history”! Within his completely insane rant the pretty much only part relating to this post is this:
For that let’s quote the relevant parts of the letter #4456:
In the case he wanted to emphasize that Mann did not do it (Jones/Osborn did), I’d advice him to take a look at this MBH98 file:
http://www.meteo.psu.edu/holocene/public_html/shared/research/MANNETAL98/fig7-nh.dat or try to replicate the MBH9x smooths (instructions and tools here).
Jean S, your efforts in these technical reviews are much appreciated. I think that sometimes those who want to defend the indefensible will never look at all the evidence together but just isolated pieces of it in (unsuccessful) attempts to maintain some kind of plausible deniability.
An observation that is difficult to avoid in these matters is that in many, if not most, of these reconstructions, the need to clearly keep the observed and reconstructed evidence separate (and that goes beyond the issue of divergence) has not been observed. Any truly scientific discussion would point to these differences first and foremost as critical to the validity of using proxies as thermometers. What has transpired in this arena is more in line with advocacy getting the upper hand.
Greg Laden has a hilarious response to this post. I encourage everyone to read it:
http://scienceblogs.com/gregladen/2014/09/22/steve-mcintyre-misrepresents-climate-research-history/
Greg Laden appears to judge the scientific capabilities of others but then he states:
“Something similar is going on with the tree ring data Mann used. At around 1960 the ability of the tree ring data to represent regional temperature declines and the tree rings become useless. Prior to that time the data should be used. After that time the data should be discarded.”
Please tell me that Greg Laden is not (remotely) a scientist and I will feel a bit better.
Also Greg laden wrote this
A good example that Greg laden could have used for this is the Tijlander varve sediments which specialists interpret as being contaminated in later centuries by farming and yet were used as proxies.
@TAG
> A good example that Greg laden could have used for this is the Tijlander varve sediments
Yes, see Comment #14 (AMac) at the referenced post, and the responses at #18 (Greg Laden) and #22 (Dan Hughes).
It’s very difficult to converse with somebody who uses his moderation powers to disappear polite, on-topic posts.
In the thread of Greg Laden’s post, one Rob Honeycutt posed a question to me (#74). I responded (#76), prompting silly comments by Rob (#77, #78) and Greg Laden (#79).
What I wrote next is what failed moderation:
Until such people are willing to hold themselves to a higher standard of conduct, there seems little point to engaging them.
amac78, I definitely agree. I’m sure you’ve had the same problem at other places (and you were there when I had it at Chris Colose’s). Personally, I’ve found few forums where discussion without fear of capricious moderation is possible. I’m not sure if it means anything the ones where it has happened have all been “skeptical.”
Which isn’t to say capricious moderation is limited to one “side.” I’ve experienced it on both “sides.”
Overnight, Greg Laden decided to allow my comment (copied above) through moderation. Better late than never, but this debating technique is a home-field advantage that is invisible to readers, and to the record.
Steve: it was pioneered at real climate. It was offered to CRU in an email. They would tie up comments sometimes for several days, by which it was lost, except that they could after the fact point to it.
RE: TAG Posted Sep 22, 2014 at 1:00 PM
“A good example that Greg laden could have used for this is the Tijlander varve sediments which specialists interpret as being contaminated in later centuries by farming and yet were used as proxies.”
Yes, but (as I understand it) it’s O.K. if only shown upside down. There’s an old saying, ‘It’s only 99.9% of lawyers that give the rest of them a bad name.’
Sadly, I’m thinking there’s only 0.1% of climatologists that are giving the rest of them a bad name. Sadder still, it’s too bad the ‘rest of them’ aren’t willing to defend themselves – or better – part from those giving them a bad name.
This thread must be hitting home somewhere . . . or maybe I’m just hoping anywhere . . .
Kenneth,
“Please tell me that Greg Laden is not (remotely) a scientist and I will feel a bit better.”
I’m sorry to tell you this, but you are going to feel very bad.
The scientific method is a pre-modern idea. The modern method is: How do you feel about it?
I’m sorry about it, I think that you are correct.
“Greg Laden is a biological anthropologist and science communicator.”
http://scienceblogs.com/gregladen/author/gregladen/
And he still has nothing to say about the fact that Mann made a number of claims in his submission to the court which are dead wrong.Wilfully blind is perhaps the best description of his views.
It’s funny. PaulD is killing them, and they pretend he isn’t there. Laden needs to stop the bleeding. Ban PaulD! for the good of the cause.
re: Tuesday, November 16th, 1999 as “Black Tuesday”
Probably just a remarkable coincidence, but isn’t interesting that the first Climategate release came on virtually the same date a decade later?? Was the mystery Climategater thinking of this date?? Naaw, but fun to think about, I’d say.
Jean S, as always your incisive work is enormously appreciated by many! This is truly a masterful review of these issues.
As for the 10th Anniversary (Nov. 2009) of these infamous proceedings, it makes an amazingly fitting coda to the Jones-Mann-Osborn-Briffa machinations that the public release of Climategate files began exactly a decade later. Pure coincidence, we must assume, but still remarkably appropriate.
I tried to read Greg Laden’s post, but found it completely mystifying. Did it have anything at all to do with the post it purports to critique? Aside from that one line, where he says It Never Happened! – without bothering to justify that claim in any way.
I’m at a loss to understand who his post is written for. Obviously not for anyone who read this one.
There should be some rule against wasting electrons like this.
It honestly read like one of those spam blogs that string together a series of related words in order to attract hits and drive up page ranks. I know that it wasn’t that, but, it had the same feel.
Okay! I think I’ve got this scoped out.
1) Laden and Honeycutt feel sure that there is no problem with “hiding the decline”, as they are sure that the proxies are good. They cannot understand the issue even though people there and here have explained the problem many times. (And even though Mann and company understand the problem very well, as the CG emails show, and as is shown by the fact that Mann vehemently denies hiding it.)
2) Therefore, when they see the post here, which is all about “hiding the decline”, they cannot pay any attention to the details of the hiding, since that is no problem.
3) Therefore, they put up a post which in their minds takes care of this issue at its root, claiming that the decline is no problem and proxies are awesome.
4) Therefore, the rest of us, who understand clearly the problem with “hiding the decline”, think they are crazy or unable to read.
A fair analysis and quite plausible. Leaves open the possibility that Mann has sold them these ideas. IMO Mann is on the scout for true believers who will be of some use.
Steyn lately posted that Mann’s most recent move in court possibly signals his desire to wriggle out of this (has to do with SLAPP maneuvering). If Steyn is right, then Mann may have given up on his cause. Sorry for this speculation but Mann’s absurd posturing on these issues where he is nailed bang-dead fascinates me
mpainter: I try to follow Steyn on this issue. Where is he saying that Mann wants to wriggle out of this?
Bernie: he may be referring to the second to the last paragraph in this column:
http://www.steynonline.com/6565/the-lonesomest-mann-in-town
Correct, Potter Eaton.
Very interesting to compare Dr. Mann’s version of the events:
http://www.desmogblog.com/michael-mann-his-own-words-stolen-cru-emails
with the above timeline.
Context is indeed helpful. 😀
Thank you Jean S!
Bruce
As someone who, for the last thirty years has been obliged to read upwards of fifty lever arch files of court documents each year, I found this article by Jean S both easy to follow and convincing. Thanks
Incidentally Greg Laden’s post to which we were referred contains an interesting admission.
“A proxy is not a pre-calibrated consistent source of information. It is a method that uses measurements of recovered material that allow the reconstruction of an ancient process. But that requires understanding the process well enough to develop a way of determining when the proxy is being helpful and when it is providing noise.”
I interpret that as saying that if the proxy, or any part of it, does not help the preconceived hypothesis it may be discarded as “noise”. That appears to have been done and not just to “hide the decline” but on other occasions where samples do not provide helpful data.
Only tea leaf readers and occultists of the CliSci world are capable of distinguishing “good” proxy records from “noise” ….. outsiders are incapable of performing such feats of intellectual alchemy.
solomon,
You have hit the nail right on the head. Greg Laden has described and personified selection bias. he could be ‘Clever Hans’, in equine.
Your interpretation is correct, for there are a number of quotes from proxy reconstructionists that say essentially the same thing: in effect, you must have the expertise to be able to sort out the “true” signal. This approach, of course, allows any sort of proxy to yield the correct results.
Outside observers to the Hide the Decline story frequently miss its significance. Which is … if temperature proxies (tree rings etc.) fail to record current high temperatures then they couldn’t have recorded equally high (or higher) temperatures in the historical record. This means that it is impossible to say, “It is warmer now than at any time in the last (insert large number here) years.”
Put another way, it may have been warmer (insert large number her) years ago than it is today and we wouldn’t know it from the tree ring records.
Interestingly, Greg Laden (referenced above) writes, “At around 1960 the ability of the tree ring data to represent regional temperature declines and the tree rings become useless. Prior to that time the data should be used. After that time the data should be discarded.” I wonder what data or theory supports this view.
The facts set forth in this post certainly make it easier for Steyn to defend the use of the term “fraud.”
JD
Very telling is Phil Jones admission that he “oversold” climate reconstruction and so consequently voted against using the graph yet being outvoted 12-1. This is a most pregnant statement. Of the correspondents in this business only Kukla addressed propriety of what was done.
the timing of Jones’ admission of overselling is interesting. There are some other Climategate exchanges in which the paleos feel slighted at their work being insufficiently valued by modelers, with some barbs aimed at weaknesses in the models.
Readers will recall the remarkable exchange among IPCC authors in September 1999 following the Arusha meeting in which there was concern that the Briffa reconstruction “diluted the message” and Mann said that he did not want to give “fodder to skeptics”. A month later (October 27, 1999), the First Order Draft of the AR3 report was issued with the decline deleted from the Briffa reconstruction in the spaghetti graph. This was only 3 weeks before the WMO exchange. Mann referred to the graphic in the draft IPCC report in his correspondence with Jones.
There is also an interesting exchange occuring in April/May 1999, which haven’t had almost any coverage (I know, too much stuff too little time). It concerns Briffa & Osborn Science Perspective. Mann is trying to dictate what goes into the article to the effect that he sends his review to the editor, who comments it in a letter to Briffa & Osborn:
Finally, when the episode is over, we have the famous vomit-letter from Bradley to Briffa.
Ah, so the paleos felt the sting of being insufficiently appreciated. Now this is interesting because personal motivation is something quite apart from mere zealotry. I recall Phil Jones nervous fits that occurred in the early stages of the climate gate episode.
Jones surely remembered his part as given here. Those plaintive emails conceivably might fit in with this excellent collation of Jean S.
That is the first time I’ve read the vomit letter. Hilarious, and a wonderful example of oleaginous, self regarding Mann-Logic.
Interesting. I had always assumed that the “fodder for skeptics” comment was referring to those in the public generally skeptical of CAGW. Now as I consider the quote in context, Mann may very well have been referring to those within the scientific community that were underwhelmed by the claims coming from the paleotemp recon/ proxy researchers.
I may be mistaken but I don’t believe that there was much public skepticism surrounding AGW, in general, back in 1999. Therefore Mann would not be as concerned with outside scrutiny as he would be with that which came from within.
Of course, this is a trivial point but one I hadn’t considered before today. Maybe it’s best not to waste any more time than necessary trying to understand Mannian thoughts. 🙂
Interesting that Mann claims credit for the final wording in the vomit letter, but given the many inaccuracies Steve, Jean S and others have pointed out here, he may have to blame someone else for the content of his pleadings – his few defenders here have already argued that his lawyers are at fault.
Compare Mann in the vomit letter:
with Nick Stokes:
Jean S. composed a symphony that would have done his namesake proud!
Jean, really nice job with this summary.
And if you are out there reading, a huge thanks to CG “FOIA”. I really wish I could buy you a drink.
This post really seemed to hit the nerves somewhere. Someone opened a new Twitter account, whose first tweet gets immediately retweeted by Stephan Lewandowsky and the Mann himself (twice!). Funny coincidence that Mann is apparently in Bristol visiting Lew 🙂
Hanging curve ball, as we say here in the states. 🙂
wow that Twitter commentary is truly pitiful — peevish, angry, resentful, inept. Someone in CliSci world is really anxious about this sordid history….
the tweeter could be anybody. it could be the anti-loge of me. pitiful, yes. significant, no.
i doubt that mann and lewandowski *need* sick-o-phants. they can do it all by them selves.
I have a lot of pull! Just kidding.
It really is a nice summary which is completely impossible for them to reasonably refute. So it appears that like everything else that goes wrong for the team, they will unreasonably refute it.
Seems the current line is to focus on the words “text” and “said” and indicate all the agreement concerned those spheres, but (as the argument might go) implied no agreement to anything that was visual.
Perhaps someone who also helped get that graphic to press that wasn’t Michael Mann would step in here and discuss whether or not they felt agreement (as opposed to disagreement) was there..? It would be bizarre (to me) for Mann to remain silent through even Prof. Jones’ stated misgivings, just to agree only to legend text or whatnot, if in-the-end he also disagreed with the WMO graphic (that he put on his CV as having a significant role in getting to press). Presumably he was one of the 12 in the 12-1 WMO vote?
Jean S: Mann did not vote; he was in Venice.
Mann wrote that his version looks similar.
Laden correctly summarizes the twin focii of Jean’s article, “One is that one of the proxies, certain tree ring data, show cooling or at least a lack of warming. The other is that the graphic representation of 20th century warming uncritically combined proxy data and instrumental data.”
Alas it goes downhill from there and his supposed counter arguments to the first objection amount to “we can pick and chose whatever proxies we like to cover whatever periods we like and we do not have to be consistent in our decision rules for including or excluding a proxy.” He has no counters to the second argument except that Mann did not explicitly say “take the instrumental record and splice it onto the proxy series and do not tell anyone about it.” Given the work that Jean has done, I am pretty sure a Judge and jury will see the email string as doing expressly that.
All this said, I have to say I find Laden’s way of arguing in general and in this particular case, barely logical to the point of being creepy.
“The main events took place on Tuesday, November 16th, 1999.”
Also on this day, in 1938, LSD was first synthesized.
hah!
Is there not a little “hide the decline” in the splicing of the instrumental record to the Mann et al. 1999 line in the WMO graph? Comparing the 2nd and 3rd figures, it appears instrumental data was appended to the Mann and Jones lines. The proxy data is not pared back as much as with Briffa, but there is some cutting or shaping.
An April 2000 email states:
You will see that for the 3 multiproxy series this file has been extended to 1999 by adding in instrumental data for the season and region each was supposed to represent. The other attachment is a figure of the first 3 which has appeared on the front cover of the WMO statement for 1999.
It seems to me instrumental data was attached to all three of the “WMO statement,” and cropping of proxy data was not limited to the Briffa product. Whoever made the WMO graph cropped, or flattened, some decline in the Mann line.
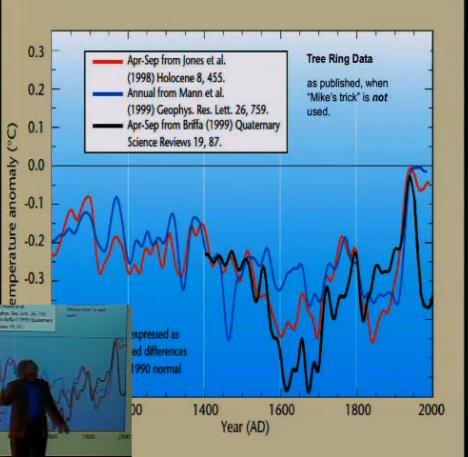
A little follow up to my comment on the “2nd and 3rd figures,” i.e. those seen in the screen shots from Richard Muller’s video lecture (above at end of main body). Muller does note that all three lines have been appended. “They added the same temperature data to three different plots, giving the illusion that there are three different sets going up. And they smoothed it.” Obviously the treatment on the Briffa product is most dramatic.
I question whether the Muller plot labeled “Mann et al 1999” actually represents data from Mann et al. 1998. The plots of Mann 1998 an 1999 are similar, except (noticeably to me at least) in the late 19th c. to 1980. The relevant Mann 1998 graph appears like the the Muller “Mann” version without added temps (Fig.. 2 above). But Mann 1999 shows a 20th c. with a dip and rise–similar btw to Jones et al 1998. Mann 1999 also adds designated instrumental record that rhetorically trends with the rise without a lurch. Muller says, “If they hadn’t smoothed it, you might have gone ‘So wait a minute, what’s the change going on, right there? Why is it abruptly different?'” I would respond that had he used Mann 1999, an abrupt difference where pure instrumental is attached would be much less, or near nothing at all.
So, perhaps, the reason for attaching “temperature data” to the Mann line in the WMO graph after 1980 is not so much with obscuring “an abrupt difference” apparent in Muller’ version, but something else. Why the WMO graph for Mann 1999 does not show the 20th century dip… I dunno. His 2oth c. Jones 1998 also differs some from other representations I have seen.
Reblogged this on Canadian Climate Guy and commented:
Hide the decline, yup, that’s what they did.
Jean S and Steve M – the world of science is indebted to you for your detailed and extraordinarily detailed forensic work in this murky matte. You both employ clear and uneqivocal English that even lay persons such as I can easily understand.
Greg Laden broadcasts obfuscation and general silliness.
Great work Jean S. It helps me to understand the various permutations of the tricks and graphs. I get the funny feeling that someone should be paying an orthopedic surgeon some cash for all of the graphing and splicing that’s going on up there. Did the patient survive?
I saw an interesting “response” to this post on Twitter (via one of the links above, I think):
It seems to be arguing Michael Mann was only involved with the text which went with this figure, not the figure itself. As though that wasn’t a strange enough position to advance, it further changes the statement “there is no objection to the graph” to “there is no mention of the graph.” This is strange because anyone who reads the e-mail will see the quoted portion is followed by a mention of the graph:
As the graph being discussed is the one Tim was producing. Mann clearly mentioned the graph this post is about, offering another graph to be used in comparison to it. That’s very strange. Even more strange is Michael Mann promoted it with this tweet:
Brandon, notice that the account is new, and it was the first tweet. Additionally, the tweet was not addressed to anyone. Still, within minutes both Mann and Lew retweeted and started following. So whoever is behind the account had pretty good behind-the-scenes connection to Mann (and Lew).
I agree, save I don’t know that they’d need a connection to both (as the two likely communicate about these sort of things). Even if there was a good connection to both, it might not be knowable from public information.
I only point this out because I think I know who created the account.
Sure, you only need the other one retweet and the other one sees it then. I was almost sure that you (or someone else who’s been closely following SkS) would have a guess of the author. There are only limited number of candidates, and typically graphs have their giveaways.
My guess is that Laden created the account. In his post we find “There is now a Tumblr for stuff like this.” with a link to:
http://justdenierthings.tumblr.com/
I wouldn’t be so sure about there being “only [a] limited number of candidates.” If I’m right, the person who made the account isn’t anyone I had heard of before. I don’t think there’s any particular reason to think it’s one of the “usual suspects.” Of course, I could be wrong 😛
AJ, I don’t think so. I don’t think someone like Greg Laden would make an account to post images he edited. It seems like too much work.
So you’re clearing Michael Mann as the owner?
Brilliant work Jean S – Loved it.
JeanS: this passage reads awkwardly: ‘…the “simplified” figure was produced the “large nontechnical audience” in the mind.’.
Perhaps: ‘…the “simplified” figure was produced with a “largely nontechnical audience” in mind.’
Jean S: Thanks.
Perhaps: ‘…the “simplified” figure was produced with a “largely nontechnical audience” in mind.’
I would really appreciate a response to my question on this statement:
“Im interested in the use of proxy data – can you expand upon this statement? – Many thanks.
“Prior to that time the data should be used. After that time the data should be discarded.””
Best
Michael
Michael,
I’m not sure what you are asking, but if you want to know more about the decline in the proxy curves, there is lots of good technical stuff on the web. Climate science moved on, with the dendros left to clean up the mess. It has been a couple years since I looked, but the decline appears to be related to age standardization curve artifacts, end effects, and other gremlins in the algorithm. The actual problems are O/T for a post about history because the scientists involved had not a clue as to what was causing the decline at the time the Climategate E-mails were written.
Steve: attribution to standardization was a concept from CRU, but I haven’t seen this established beyond a hypothesis. Further, if correct, it would require re-calculation of all chronologies, not just the ones that decline. My own take on their main “argument” is that “not all” chronologies go down – so they pick the ones that go up. The Climate Audit critique of this practice is that ex post picking is biased and unscientific, but this criticism is shrugged off by the dendros.
FWIW – Speaking as a distant observer, Jim Bouldin seems to me to be a notable exception in the field of dendro. His blog series on the “Severe analytical problems in dendroclimatology” is on my future reading list. Find them on his blog using the search term “severe” or start here with a smile and go to his other posts tagged “climate related”:
I think the idea that age standardization could be a factor was first described by Frank and Esper in their brief paper describing 7 or 8 potential causes of the divergence phenomenon. RCS standardization can indeed be a contributing factor as Matt states–my simulations as part of my PNAS submission definitely show this to so–although I much doubt that this is the only factor, given how strong divergence is at some sites. There’s some non-linear biological response(s) going on here, I’m pretty sure, i.e. the problem Loehle described in 2009.
curious: a number of us are aware of the big problems in dendroclimatology. It’s just that I’ve been the most vocal about it.
Steve: Jim, in retrospect, I look at the failure of contemporary specialists to squarely confront the different results of the two 1998 large-population studies (Mann et al 1998; Briffa et al 1998) as a sort of original sin in these controversies. While someone sufficiently interested could locate the discrepancy within the literature, it was papered over in comparisons (spaghetti graphs) by hide-the-decline, thereby leaving the divergence problem under-exposed to specialists. And it is amazing that so many specialists (as frustrates you) think that saying that it is an answer to say that “not all” trees are divergent and that it is valid practice to ex post pick non-divergent sites. Multiproxy studies that used samples that were too small and too data-snooped to shed fresh light also contributed to papering over the problem. Esper et al 2012 ( an interesting study that I’ve regrettably not analysed in depth) raises important issues on long term variability in tree ring chronologies as well, as you are aware.
Steve, I might take that one step further and consider the “original sin” the very idea that one could make reliable large scale reconstructions from tree ring widths *in the first place* (which probably dates to Harold Fritts, if not earlier). This field had very clearly not worked out basic biological and stat/math issues necessary to make reconstructions even at single sites, except in a few cases (mostly those with sub-fossil specimens having good overlap through time), let alone widespread collections thereof, almost none of which met that criterion.
The idea that only the diverging sites (or trees) need to be discarded, either entirely or only for the years after which divergence is claimed to have begun, is just patently wrong, and shows a profound lack of grasp of the implications of Loehle’s argument.
The thing I’ve slowly realized, is that those with the real biological and mathematical understanding of tree growth, needed to put the kaibosh on various claims made in various papers, just never did, for whatever reason. Furthermore, some of the dendro people just simply don’t even *understand* these issues; they’ve apparently never taken the time to learn some fundamentally critical biological concepts. They just get mired down in all kinds of data details, addressed by ad-hoc or poorly evaluated procedures, over and over. Whenever you have a field in which the analytical framework/fundamentals have not been properly worked out, this is what you get. A mess.
The Esper etal 2012 paper is outstanding, one of the best ever published in the field, I’m convinced.
Jim Bouldin wrote:
“…those with the real biological and mathematical understanding of tree growth, needed to put the kaibosh on various claims made in various papers, just never did, for whatever reason.”
That is exactly right, the dendros would have had the chops to challenge, but apparently they lacked the moxie. I have previously referred to this as “the silence of the dendros.” If we are in the mood to give them the benefit of the doubt, we should recognize that funding for dendro work has probably been at an all time high. But I also remember that Steve got disinvited to a dendro conference after being invited and preparing a talk, that is just pure cowardice.
Could someone explain this to me? Because it reads awfully like, ‘It was a bad idea, so we abandoned it, but we don’t want to admit we made a mistake.’
I’m sure that’s not correct though, so perhaps someone can explain what is meant by “moved on”.
modelers and people like Myles Allen tend to discount paleo work more now, so as not to be burdened by the problems of that troubled field… Myles Allen had some remarks here and at Bishop Hill awhile ago which seemed to say the field had moved beyond any reliance on the paleoclimate proxies (however dubious the assertion may be)
people within paleoclimate like Mann and acolytes say they have “moved on” in a different way, claim that they have better substantiations of proxy hockey sticks than in 1999-2001 (however dubious that assertion is!)
I think that you are touching ‘the boundaries’ with your ‘moved on’ question.
Like ‘sustainability’ it means all things to all men.
Moved on – in the sense that Paleo has moved on since the 90’s? (we know more now than we did back then)
Moved on – in the sense that Paleo is just no longer supporting the agenda? (it has become a liability to the ’cause’)
At the risk of getting ‘bombed’ by some – Briffa did seem, to me at least, to be one of the few individuals who did not appear to be happy with the way Paleo was heading. A kind of “last week we were an office in the Geography dept with no money. This week we are the Geography dept. Now what’s wrong with this picture?”
I really would love Briffa to retire and then be able answer some questions without ‘backlash’.
Jim: As clear and as concise a statement as any here could want. I would not be surprised if you get a call from Steyn’s lawyers.
“Zealots”, “incompetents” and “crooks” are not mutually exclusive categories. Like other commenters here, I thank Jean, Steve and others for their work that turned hypotheses about the antics of the global warmongers into stone cold facts.
Fantastic post, Jean. many thanks for the time you spend revealing this much detail.
A couple of things come to mind thinking about this post and seeing Mann tweet about it. First, the facts laid out in the post squarely place the issue of Mann’s potential actual fraud before the trial court, if the matter does come to trial. However, since the deception by Mann is so obvious, it gives Steyn’s actual malice defense (I hope he actually raises it)a big boost. It is very understandable from a number of perspectives to characterize Mann’s actions as fraudulent, no matter what the actual judgment on the precise issue of fraud would be. That being the case, it makes it much easier to demonstrate lack of malice.
Second, Mann’s tweeting is supremely stupid in terms of its ramifications for his defamation case. Essentially, the way the law works is that your previous out of court statements which have a tendency to help you, are not admissible. However, to the extent that they hurt you, they are permissible on cross-examination. This is why most clients go incommunicado prior to trial. Mann’s lawyer has undoubtedly told Mann to keep quiet, but Mann is not smart enough to do so. I expect that Williams is pulling out his hair when he discovers that Mann is tweeting on matters relevant to his trial. It will be interesting to see whether there will be subtle signs of Williams’ potential exasperation with Mann in the future.
JD
What effect this post on Steyn’s countersuit do you see? If you would you care to comment on that.
I don’t know DC law in particular, but according to the standards of most states Steyn doesn’t have a countersuit. Going by memory and not checking again, I believe his countersuit is in the nature of malicious prosecution. One typical statement of what constitutes malicious prosecution is this: “Malicious prosecution is a common law intentional tort, while like the tort of abuse of process, its elements include (1) intentionally (and maliciously) instituting and pursuing (or causing to be instituted or pursued) a legal action (civil or criminal) that is (2) brought without probable cause and (3) dismissed in favor of the victim of the malicious prosecution.” You can see there are a number of hurdles to overcome. In my view, Mann, being accused of fraud, and Steyn not having shown that Mann altered actual records (they were deceptively presented) it is hard to say that Mann has no right to seek a trial on the issue of defamation.
My gut personal opinion is that Steyn has no case against Mann, and this latest clarification of the facts by Jean wouldn’t affect that. One reason for my opinion is that if there was a valid countersuit to be filed, his first lawyers would have filed it and NR and CEI would have also filed one. What a lot of people don’t understand is that any doofus can file a trillion dollar lawsuit with a $150 filing fee and three printed pages. Just because it was filed doesn’t mean that it is going anywhere. (The clerk of courts who receives the lawsuit doesn’t screen its merits at all.)
JD
I think Mann is trying to have the countersuit thrown out on SLAPP grounds. The countersuit is more an issue of putting focus on the tactics being used by Mann.
I agree with JD’s assessment. I was,however, very impressed by Steyns lawyers reply to Mann’s motion to dismiss. Although I think it was and is a lost cause, Steyn lawyers arguments were creative, resourceful and aggressive.
Interesting analysis! Brits have been eliminated by grammar usage and Americans by spelling.
Leaves Canadians and Aussies. Oh – New Zealanders are still in the running also.
Re: Political Junkie (Sep 23 15:41), it’s not unusual for reviewers to fake spellings/grammar from the other side of the pond to help mantain anonymity, so it’s unwise to read too much into details.
I used to wilfully spell “colour” the wrong way in school in England. I think I only once got a teacher to bight.
Several heartfelt thanks are due here:
1) to Jean S. for this admirable, clear and direct summary.
2) to Richard Muller for being perhaps the first to put the “Hide the Decline” vs. “Actual data” graphs side-by-side. As several have observed, makes the faking pretty obvious, doesn’t it.
3) to whoever did the transcript of Muller’s talk:
https://sites.google.com/site/mytranscriptbox/home/20101001_m3
Muller’s anecdote of his colleagues trusting use of this faked graph is revealing. Not many people (besides Greg Laden) would really try to defend this, once they see the “A-B” comparison/
4) and of course to Our Host, who’s been tirelessly pursuing this bit of research fraud for many years now. Steve, I know you don’t like the word, and I doubt that these clowns really *intended* fraud — but that’s what came out. And it’s *still* out there….
Peter D. Tillman
Professional geologist, amateur climatologist
Steve: the impact of hide-the-decline was shown at CLimate AUdit long before Muller’s talk. Muller’s coverage of the issue was timely and appreciated.
Not wishing to detract from the work that Jean S and Steve have presented, it is very detailed.
Since 2005 or so I’ve been interested in the wider question of whether dendro work has the innate ability to provide for a temperature proxy at all. I know that Craig L has written on this, as have others, but the way I regard it follows from an inspection of the graph that heads this essay. You will see that the graphs ‘shafts’ vary between -0.1 and -0.6 deg C. with individual graphs showing textural wriggles corresponding to about 0.02 C. That performance is better than thermometers alone can produce in conventional use for temperatures 100 years ago.
These graphs show a conversion from a tree ring response to a temperature proxy through a calibration step. The calibration had an input temperature that is not accurate better than (arguably) +/- 0.5 C. Even if temperatures applicable to the sites could be measured to +/- 0.1 C (doubtful) the resulting hockey sticks still have texture at a fifth of that level. In other words, the attribution of texture is false because it has character more fine than the data input to it.
As well as challenging the truth of the texture, I also challenge the ability to place the whole of each of the graphs accurately in the Y-axis setting. That is, I would claim that there is a potential for bias that could disallow the congruence shown, of the tree record with the temperature record. The whole of each tree graph could properly move up or down a few tenths of a degree from uncertainty. It seems merely artistic to make it a smooth union and not a gap.
Although the alleged dishonesty here is from hiding the decline, I allege more fundamentally that the basic use of dendro as a temperature proxy is invalid and that this should have been known to the researchers reporting it. You cannot make a silk purse from a sow’s ear by believing that wriggles produced by a computer treatment of data are of necessity connected to any physical, natural effect.
How many readers have ever seen the formative studies for dendrothermometry, where actual tree data are compared with temperature data along with proper estimates of bias and precision? I can’t recall any that pass, but my reading is not comprehensive.
David Rind
Reblogged this on I Didn't Ask To Be a Blog.
I must confess a grudging admiration for Jones and Mann. Where most mortals (those with scruples and capable of shame) would have acknowledged error for the sake of “the science,” these two boldly double down. I can’t tell if they’re maniacally opportunistic or simply bad scientists, or both.
Has a comparison chart been done of what the end of MBH looks like without Mike’s Nature Trick?
Picking cherries and only using data that agrees with the premise to bake that pie is what GL supports it seems. 🙂
The CEI has posted its final reply brief and it is a scorcher. Here is the money quote:
“Mann’s discussion of these materials is so misleading as to seriously call into question his and his counsel’s candor to the Court. In these circumstances, it would be well within the Court’s discretion to order Mann and his counsel to show cause why they should not be sanctioned for misrepresentation of the record and for unreasonably imposing litigation costs on Defendants. See Bredehoft v. Alexander, 686 A.2d 586, 589 (D.C. 1996) (citing Chambers v. NASCO, Inc., 501 U.S. 32, 4546 (1991)) (sanctions within Court’s inherent authority); Rule 30(b)(2). ”
Watts up with that has the link that for some reason I haven’t been able yo copy. (Steve: http://cei.org/sites/default/files/Mann%20-%20Think%20Tank%20Defendants%20Reply.pdf )
By the way,as a lawyer I can assure you this is not the type of charge lawyers make lightly and it is extremely rare to see such language in brief. This goes far beyond the heated rhetoric that is common place in legal arguments
Considering that previous court review had sided with Dr. Mann, taking their previous argument(s) with reflexive acceptance, might such an ‘extremely rare’ move backfire?
The reason such language is rare is because seldom engage in the type of conduct Mann’s lawyers have engaged in and opposing won’t make that type of accusation unless they are certain it is warranted. I don’t think it will backfire. JD Ohio has observed here and elsewhere that Mann’s lawyers have been pushing ethical boundaries. Cei is calling them out.
CEi certainly seems to have taken a similar position to mine on the importance of Mann’s false claims about the exonerations – I think that my size-up of this as a central point in the pleadings is bearing up. CEI has always been more aware of this than National Review and raised this issue right from their first response to Mann’s lawyer letter, but their emphasis on Mann’s misrepresentations is hugely increased from their December 2012 brief and, in my opinion, correctly so. I presume that they’ve read the CA posts on the “exonerations”, but, for the record, I wasn’t involved in any aspect of its preparation or comment on any drafts. This is the first that I’ve seen of their brief which is online here . (If I’d proofread the brief, there are a couple of factual details that should be corrected.)
I think it’s a safe bet they are closely following CA/blogs:
I’d say my net surfing two weeks ago while waiting my lastborn to get sleep was relatively well spent time 🙂
Jean: I’ll bet the attorneys are grateful that you are “always happy to help,” to quote you in another context.
Seriously, it would be interesting to find out how many billable hours are being spent reading ClimateAudit.
Generally, I thought that CEI’s brief was excellent, but have a lower opinion of NR’s brief.
First, CEI effectively pointed out Mann’s hypocrisy, stating”
“Mann’s own statements show that Simberg’s commentary is typical of that debate. In 2005, Mann deemed a paper by two scientists with whom he disagrees to be “pure scientific fraud” and stated that this view would be “reinforced by just about any legitimate scientist in our field you dis-
cuss this with.” In response to claims that this was part of a campaign by Mann and his allies to suppress dissenting scientific views, the U.S. Environmental Protection Agency explained that Mann’s use of the word “fraud” was not defamatory but simply “reflect[ed] his scientific judgment
that the…paper was flawed” and that it is “entirely acceptable and appropriate for scientists to ex-press their opinions and challenge papers that they believe are scientifically flawed.” As the EPA recognized, Mann was just airing his opinion in the context of a contentious debate.”
Then, it effectively hit the exoneration issue, stating:
Not One of the Post-Climategate Reports “Exonerated” Mann
Of the eight reports that Mann says “exonerated” him, three do not even mention his name once, and six involved no investigation at all of his research or conduct. Of the two reports that do concern Mann, one did not investigate the charge for which he claims to be “exonerated”—
falsifying data—and the other dropped its investigation of that charge at an early stage, without ex-amining Mann’s research or practices.”
Thus, I believe that CEI’s brief is very good. It directly and simply addresses the factual point that, in no sense of the word, did any true investigation exonerate Mann. It also simply and clearly points out Mann’s hypocrisy.
On the other hand, I didn’t think that the NR brief was worth the $100,000 that NR probably paid for it. (Just guessing as to the bill) I really didn’t like the short shrift they gave to rebutting Mann’s exoneration claim. Here is all that NR argued:
“Second, Dr. Mann argues that National Review must be aware that its statements were false
because some investigations have “exonerat[ed]” him. Mann Br. 42. To the extent the investigations
found that he did not “falsify data,” id., that is irrelevant because National Review obviously did not
accuse him of that. And to the extent the investigations opined that his actions should not be
characterized as “misconduct,” “manipulation,” or “misleading” id., that is the type of subjective
opinion with which National Review is free to disagree. ”
This gives Mann the opportunity to argue that he was “exonerated” in some meaningful way, whick I don’t agree with.
To summarize, I am happy that CEI hit the exoneration issue in a straightforward and simple manner. This is a major reason that I have been posting here. Have been hoping that law firms would read blog posts (I believe CEI lawyers did) and that that would improve the accuracy and effectiveness of the briefs and save the defendants money. I thought NR’s legal arguments were intellectually interesting. Whether they will be effective depends on the makeup and predilictions of the DC Court of Appeals.
JD
I was also disappointed by the National Review brief, which also incorrectly described some of the factual matters. I agree with your conclusion that CEI counsel have been reading here, but it doesn’t look like NR counsel have.
Re: pauldd (Sep 25 08:52),
A question for pauldd, Joseph W., and/or JD Ohio … Suppose NR and CEI succeed in their appeal and Mann’s lawsuit against these two defendants is thrown out. If that happens, what options for subsequent legal moves should Mark Steyn and his lawyers be considering?
BB “Suppose NR and CEI succeed in their appeal and Mann’s lawsuit against these two defendants is thrown out. If that happens, what options for subsequent legal moves should Mark Steyn and his lawyers be considering?”
If Steyn is totally off the hook, if I was him (with his intense dislike of legal proceedings), I would take my marbles and go home. As I have said before, I am not impressed with Steyn’s countersuit.
JD
JDO and Pauldd, it seems to me that the paragraph highlighted by Paulldd offers an alternative route to what Steyn’s countersuit was seeking i.e. a finding that they should be “sanctioned for misrepresentation of the record and for unreasonably imposing litigation costs on Defendants.” See quote in pauldd’s comment.
The citation, Bredehoft v. Alexander, 686 A.2d 586, 589 (D.C. 1996) is a case where side was seeking damages for supposed failure of opposing counsel to do “reasonable” investigation into the cause of action of their client (though the defendant was found to have done enough investigation. It is hard to see how any “reasonable” investigation of “exonerations” where Mann is not even mentioned could have concluded that they had investigated or exonerated Mann himself. So if counsel has a duty to the court to do some investigation of matters pleaded (and I don’t know whether US counsel have such a responsibility), then I can definitely see a cause of action against Mann’s counsel – one which CEI seems to be setting up.
SM “JDO and Pauldd, it seems to me that the paragraph highlighted by Paulldd offers an alternative route to what Steyn’s countersuit was seeking i.e. a finding that they should be “sanctioned for misrepresentation of the record and for unreasonably imposing litigation costs on Defendants.”
I agree that it does give Steyn some opportunity to recover for the misstatements made in Mann’s pleadings and briefs. However, before he could get compensated, a substantial amount of additional litigation would probably be required. Also, courts are generally reluctant to impose sanctions and you never know what they will do. If someone less legal averse than Steyn were involved, I might suggest that a motion seeking compensation for sanctions be filed.
Also, there is the issue of whether there are any legal grounds for Steyn’s countersuit. If Steyn formally files for sanctions, Mann will almost certainly seek sanctions for the filing of the countersuit, assuming that there are substantial holes in his legal theories, which I expect that there are.
JD
JD: Shades of Jarvis vs Jarvis?
Jarndyce v Jarndyce??
Absolutely. I should have checked. 😦
I have been reading the pleadings as they have been filed, but somewhat casually and not keeping careful notes. At this point the case has grabbed my attention, but I don’t have time to reread everything. I do have two questions that perhaps could be answered by someone who has been a bit more diligent–perhaps Steve or JDOhio.
1. My recollection is the trial court relied exclusively on the so-called exonerations for its finding that Mann was likely to prevail on a showing of actual malice. Likewise, Mann seemed to rely on them exclusively. Did either the trial court or plaintiff rely on anything else? I think this argument has been pretty well gutted. Is there anything else regarding actual malice that could be used by the COAs to salvage Mann’s case?
2. This case is strange to me because everyone has presented arguments that rely on facts outside the pleadings, but it is not obvious to me that any factual record was developed by testimony or even affidavits in the trial court. This observation was raised in an earlier thread. For example CEI has cited Mann’s CV, but I doubt that it has been stipulated in the record or presented in evidence. The legal standard “likely to prevail on the merit” is identical to one prong of the standard typically used to issue a preliminary injunction. This usually requires some type of summary evidentiary hearing, usually with testimony, and/or stipulations. I am not an expert on SLAP cases, but it seems to me that it would be appropriate to remand the case to more formally develop a factual record. Any thoughts by someone familiar with how SLAP cases are typically litigated?
Finally, Steve: would it make sense to promote this discussion to its own thread?
Steve: Yes.Started. I don’t know how to transfer comments en bloc but will copy this one. Readers, please continue comments on this topic at new thread.
Pauldd,
If this “money quote” succeeds, will it not provide ammo for Steyn in his countersuit? That is to say Mann is shown to put forth in his brief that which he knew was not true.
I think you pose a very interesting question that would take more time to fully analyze than I have time for now.
My very off the cuff answer right now would be:
1. If the CAP reverses the trial court (a possibility that I view as increasingly likely) and 2) If the cout of appeals sanctions Mann’s attorneys (a much bigger question mark), then I think that Steyn would have a good chance of obtaining sanctions under the civil rules that could include an award of his attorney fees.
I have been very skeptical about the likelihood of Steyn prevailing on his countersuit after a cursory review of it because I didn’t think he met the requirements to plead malicious prosecution and I thought his other theories were very novel. I would leave a more definitive answer to an attorney who examined these issues much more carefully.
Wow. And they fight, fight, fight to keep their little money machine printing away.
5 Trackbacks
[…] I just want to post a link to an excellent summary of hide the decline by Jean S at Climate Audit. […]
[…] Full post […]
[…] Read the entire post here: https://climateaudit.org/2014/09/22/black-tuesday-of-climate-science/ […]
[…] be a lot of confusion among Mann’s few remaining supporters as to why Phil Jones credited the “trick of adding in the real temps” to Mann’s Nature article (MBH98). Today I will review that […]
[…] https://climateaudit.org/2014/09/22/black-tuesday-of-climate-science/ […]