Many of you read Moberg. Some of you probably saw the following diagram showing the re-combination from wavelets to yield the final reconstruction. It looks like an even more complicated method than MBH98 – "science moves on".
Moberg Figure 2.
So if I offered to show you plots of the wavelet decompositions of all 11 low-frequency series used in Moberg, none of you would probably think that it would be very helpful to you to see a whole lot of diagrams looking Moberg’s Figure 2. However, I’ve plotted out the 11 series using a discrete wavelet transform, instead of a continuous wavelet transform and you’ll find the results accessible and interesting.
UPDATE: qqnorm plot added for the 11 low-frequency proxies. Continue reading →
When Moberg [2005] first came out, I posted up some first comments on it. I haven’t done anything on it since then, partly because of the amount of time responding to comment on our MBH articles, partly because I got stuck on some missing data sets. Hans Erren has a really neat method for digitizing graphics from pdf’s and kindly digitized a couple of series for me. I just re-plotted them against the original data and there appears to be an extremely peculiar discrepancy in the Lauritzen stalagmite series, which also shows the irritating aspect of people using "grey" and unarchived data. See what you think. Continue reading →
Although Science has nice policies on paper requiring data archiving, in practice, its climate authors are singularly poor about doing so. Esper et al [2002] has enough missing data to make it very difficult to get traction on it. Here’s a letter that I sent today to Science requesting that they take steps to get Esper’s data archived. Continue reading →
What is the standard deviation (variance) of an autocorrelated series? Sounds like an easy question, but it isn’t. This issue turns out to affect the spurious regression problem, so I’m posting up a short note on the problem. These issues are well-known in econometrics, where they have led to “heteroskedastic-autocorrelation consistent” estimators. There’s an interesting discussion in Percival [1993], who’s involved in climate, who says:
the effect of not knowning the process mean can be rather large: whereas s is an unbiased estimator of à?à’ when µ is known, the commonly used s can severely underestimate à?à’ when µ is unknown.
Percival gives an example where small-sample methods are biased by a factor of 100!
Continue reading →
Miller et al. [2004] studied fossil evidence of forest levels in 9 locations in the western U.S. over the past 3500 years, including Whitewing Mountain and San Joaquin Ridge, Inyo Craters Chain in the eastern Sierra Nevadas, near the bristlecones of the White Mountains (about which I’m going to post an interesting graphic on their altitude changes), reporting that:
A volcanic eruption of the Glass Creek vent (Inyo Craters chain, eastern Sierra Nevada) during medieval times buried forests in the adjacent region under several meters of tephra. Large, mostly downed, dead trees on nearby Whitewing Mtn (3052m) and San Joaquin Ridge (3105m) appear to have been killed by the eruption and preserved in arid, cold environments; tentative radiocarbon analysis (Univ AZ, Lab of Tree Ring Research, 1980) gave dates in the eruption era. The presence of these stems suggests a tall forest existed at the time the trees were alive. Conditions at this time were warm with two 150-200 year dry periods between AD 900-1350 in the Sierra Nevada (Stine 1994). The dead stems contrast with current conditions of these habitats, which are treeless or have only occasional krummholz whitebark pine. Live forests of whitebark pine downslope suggest cycles of shifting treeline in more recent centuries, during the cool centuries known as the Little Ice Age. No previous studies have examined the paleoecological, climatic, or eruptive-sequence implications of the downed logs or downslope contemporary forests….Medieval-age (AD 900-1350) forest composition, structure, and growth on summits were typical of forests currently 300-500m lower, suggesting an effectively warmer climate during medieval times
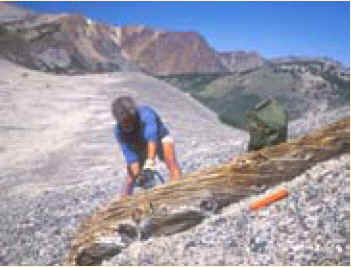
Figure 1. Subfossil log on Whitewing Mountain. Continue reading →
I’ve modified the Cascading Style Sheet (CSS) for the Weblog Theme so that the comment box is no longer the width of the screen, but is 80% of it. I’ve also fixed the irritating look of the font size of the subcategories being bigger than the categories.
Let me know in the comments below if these changes make your experience of the weblog better or worse as a result
One of the reasons for my recent focus on Thompson is that he was one of the 20 "wise" [my term] men (and women) who wrote here to the Barton Committee deeply concerned about your approach and expressed their "hope that as a community, we can help your committee shape public policy in the light of the best available scientific knowledge. " Some of their comments bear a little consideration. Continue reading →
It has been brought to my attention that Science has formal policies on data archiving. The author of the email, who requested confidentiality, argued that this disproved my statement:
Having acknowledged that, the underlying issue is that Science does not seem to either have policies that require authors to archive data or administration practices that ensure that their policies are applied. Since NSF then relies ( a reliance which seems to me to be an abdication of their own separate responsibilities) on journals like Science, with either inadequate policy or inadequate administration, there’s a knock-on effect.
Given that Thompson had not archived anything on Dunde, Guliya or Dasuopu until I started pressing last year, I fail to see how the existence of stated policies at Science contradicts my claim. For unique data sets like Thompson’s (for the collection of which Thompson has been justly praised), nothing but complete archiving of all sample measurements will be adequate. Problems with archiving with climate articles published in Science by Cook have been reported here before; Hans Erren has experienced problems with Luterbacher as well. Continue reading →
I’va added a number of new categories in the frame at right and have indexed a lot of old postings. For example, I’ve indexed comments pertaining to Jones et al; Crowley; IPCC; bristlecones; geological proxies; modeling; satellite and gridcell temperatures and a few others. The format needs to be tidied a little.
It’s pretty hard to have a blog on climate issues and not comment on Hurricane Katrina and the devastation of New Orleans and Mississippi. On the other hand, most comments to date emanating from climate circles seem very tasteless and suggest any comment from someone interested in climate will be pretty risky.
Continue reading →


