Please note: The author of this post is Ryan O . . . not Steve. As people have lately displayed a tendency to attribute what I write to Steve, I figured the disclaimer was appropriate.
Steve: Feb 9, 2011 – some of Ryan’s language, including the original title, breached blog policies and has been edited accordingly.
***
Some of you may have noticed that Eric Steig has a new post on our paper at RealClimate. In the past when I have wished to challenge Eric on something, I generally have responded at RealClimate. In this case, a more detailed response is required, and a simple post at RC would be insufficient. Based on the content, it would not have made it past moderation anyway.
Lest the following be entirely one-sided, I should note that most of my experiences with Eric in the past have been positive. He was professional and helpful when I was asking questions about how exactly his reconstruction was performed and how his verification statistics were obtained. My communication with him following acceptance of our paper was likewise friendly. While some of the public comments he has made about our paper have fallen far short of being glowing recommendations, Eric has every right to argue his point of view and I do not begrudge his doing so. I should also note that over the past week I was contacted by an editor from National Geographic, who mentioned in passing that he was referred to me by Eric. This was quite gracious of Eric, and I honestly appreciated the gesture.
However, once Eric puts on his RealClimate hat, his demeanor is something else entirely. Again, he has every right to blog about why he feels our paper is something other than how we have characterized it (just as we have every right to disagree). However, what he does not have the right to do is to defend his point of view by [snip] misrepresenting facts.
In other words, in his latest post, Eric crossed the line.
Let us examine how (with the best, of course, saved for last).
***
The first salient point is that Eric still doesn’t get it. The whole purpose of our paper was to demonstrate that if you properly use the data that S09 used, then the answer changes in a significant fashion. This is different than claiming that this particular method (whereby satellite data and ground station data are used together in RegEM) provides a more accurate representation of the [unknown] truth than other methods. We have not (and will not) make such a claim. The only claim we make is – given the data and regression method used by S09 – that the answer is different when the method by which the data are combined is properly employed. Period.
The question about whether the proper use of the AVHRR and station data sets yield an accurate representation of the temperature history of Antarctica is an entirely separate topic. To be sure, it is an important one, and it is a legitimate course of scientific inquiry for Eric to argue that our West Antarctic results are incorrect based on independent analyses. What is entirely, wholly, and completely not legitimate is to use those same arguments to defend the method of his paper, as the former makes no statement on the latter.
Unfortunately, Eric does not seem to understand. He wishes to continue comparing our results to other methods and data sets (such as NECP, ERA-40, Monaghan’s kriging method, and boreholes). We did not use those sets or methods, and we make no comment on whether analyses conducted using those sets and methods are more likely to give better results. Yet Eric insists on using such comparisons to cast doubt on our methodological criticisms of the S09 method.
While such comparisons are, indeed, important for determining what might be the true temperature history of Antarctica, they have absolutely nothing to do with the criticisms advanced in our paper. Zero. Zilch. Nada. Note how Eric has refrained from talking about those criticisms directly. I can only assume that this is because he has little to say, as the criticisms are spot-on.
Instead, what Eric would prefer to do is look at other products and say, “See! Our West Antarctic trends at Byrd Station are closer than O’Donnell’s! We were right!” While it may be a true statement that the S09 results at Byrd Station prove to be more accurate as better and better analyses are performed, if so, it was sheer luck (as I will demonstrate, yet again). The S09 analysis does not have the necessary geographic resolution nor the proper calibration method to independently demonstrate this accuracy.
I could write a chapter in the Farmer’s Almanac explaining how the global temperature will drop by 0.5 degrees by 2020 and base my analysis on the alignment of the planets and the decline in popularity of the name “Al”. If the global temperature drops by 0.5 degrees by 2020, does that validate my method – and, by extension, invalidate the criticisms against my method? Eric, apparently, would like to think so.
If he wishes to argue that our results are incorrect, that’s fine. To be quite honest, I would hope that he would do exactly that if he has independent evidence to support his views (and he does, indeed, have some). But if he wishes to defend his method, then it is time for him to begin advancing mathematically correct arguments why his method was better (or why our criticisms were not accurate). Otherwise, it is time for Eric to stop playing the carnival prognosticator’s game of using the end result to imply that an inappropriate use of information was somehow “right” because – by chance – the answer was near to the mark.
***
The second salient point relates to the evidence Eric presents that our reconstruction is less accurate. When it comes to differences between the reconstruction and ground data, Eric focuses primarily on Byrd station. While his discussion seems reasonable at first glance, it is quite misleading. Let us examine Eric’s comments on Byrd in detail.
Eric first presents a plot where he displays a trendline of 0.38 +/- 0.2 Deg C / decade (Raw data) for 1957 – 2006. He claims that this is the ground data (in annual anomalies) for Byrd station. While there is not much untrue about this statement, there is certainly a [material] [snip] omission. To see this [material omission], we only need look at the raw data from Byrd over this period:

Pay close attention to the post-2000 timeframe. Notice how the winter months are absent? Now what do we suppose might happen if we fit a trend line to this data? One might go so far as to say that the conclusion is foregone.
So . . . would Eric Steig really do this? [snip]
Trend check on the above plot: 0.38 Deg C / decade.
Hm.
By the way, the trend uncertainty when the trend is calculated this way is +/- 0.32, and, if one corrects for the serial correlation in the residuals, it jumps to +/- 0.86. But since neither of those tell the right story, I suppose the best option is to simply copy over the +/- 0.2 from the Monaghan reconstruction trend, or the uncertainty from the properly calculated trend.
When calculated properly, the 50-year Byrd trend is 0.25 +/- 0.2 (corrected for serial correlation). This is still considerably higher than the Byrd location in our reconstruction, and is very close to the trend in the S09 reconstruction. However, we’ve yet to address the fact that the pre-1980 data comes from an entirely different sensor than the post-1980 data.
Eric notes this fact, and says:
Note that caution is in order in simply splicing these together, because sensor calibration issues could means that the 1°C difference is an overestimate (or an underestimate).
He then proceeds to splice them together anyway. His justification is that there is about a 1oC difference in the raw temperatures, and then goes on to state that there is independent evidence from a talk given at the AGU conference about a borehole measurement from the West Antarctic Ice Sheet Divide. This would be quite interesting, except that the first half of the statement is completely untrue.
If you look at the raw temperatures (which was how he computed his trend, so one might assume that he would compare raw temperatures here as well), the manned Byrd station shows a mean of -27.249 Deg C. The AWS station shows a mean of -27.149 . . . or a 0.1 Deg C difference. Perhaps he missed a decimal point.
However, since computing the trend using the raw data is unacceptable due to an uneven distribution of months for which data is present, computing the difference in temperature using the raw data is likewise unacceptable. The difference in temperature should be computed using anomalies to remove the annual cycle. If the calculation is done this (the proper) way, the manned Byrd station shows an average anomaly of -0.28 Deg C and the AWS station shows an average of 0.27 Deg C. This yields a difference of 0.55 Deg C . . . which is still not 1 Deg C.
Maybe he’s rounding up?
Seriously, Eric . . . are we playing horseshoes?
Of course, of this 0.55 Deg C difference, fully one-third is due to a single year (1980), which occurred 30 years ago:
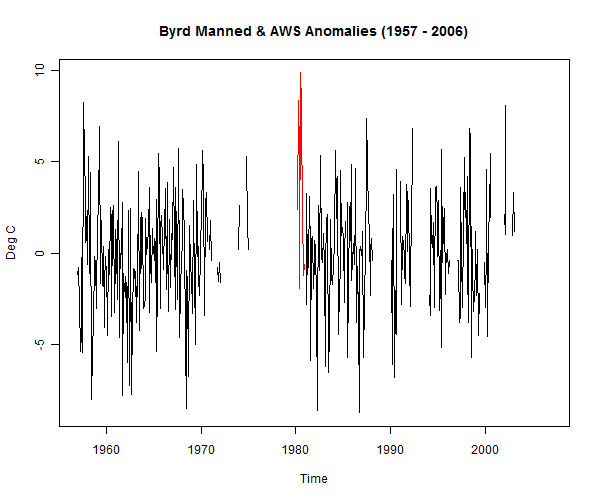
Without 1980 – which occurs at the very beginning of the AWS record – the difference between the manned station anomalies and the AWS anomalies is 0.37 Deg C.
Furthermore, even if there were a 1 degree difference in the manned station and AWS values, this still doesn’t tell the story Eric wants it to.
The original Byrd station was located at 119 deg 24’ 14” W. The AWS station is located at 119 deg 32’ W. Seems like almost the same spot, right? The difference is only about 2.5 km. This is the same distance as that between McMurdo (elev. 32m) and Scott Base (elev. 20m). So if one can willy-nilly splice the Byrd station together, one would expect that the same could be done for McMurdo and Scott Base. So let’s look at the mean temperatures and trends for those two stations (both of which have nearly complete records).
McMurdo: -16.899 Deg. C (mean)
Scott Base: -19.850 Deg. C (mean)
That’s a 3 degree difference for stations at a similar elevation and a linear separation of 2.5 km . . . just like Byrd manned and Byrd AWS.
So what would the trend be if we spliced the first half of Scott Base with the second half of McMurdo?
1.05 +/- 0.19 Deg C / decade.
OMG . . . it is SO much worse than we thought!
Microclimate matters. Sensor differences matter. The fact that AWS stations are likely to show a warming bias compared to manned stations (as the distance between the sensor and the snow surface tends to decrease over time, and Antarctica shows a strong temperature gradient between the nominal 3m sensor height and the snow surface) matters. All of these are ignored by Eric, and he should know better.
Eric goes on to state that this meant we somehow used less available station data than he did:
On top of that, O’Donnell et al. do not appear to have used all of the information available from the weather stations. Byrd is actually composed of two different records, the occupied Byrd Station, which stops in 1980, and the Byrd AWS station which has episodically recorded temperatures at Byrd since then. O’Donnell et al. treat these as two independent data sets, and because their calculations (like ours) remove the mean of each record, O’Donnell et al. have removed information that might be rather important. namely, that the average temperatures in the AWS record (post 1980) are warmer — by about 1 Deg C — than the pre-1980 manned weather station record.
In reality, the situation is quite the opposite of what Eric implies. We have no a priori knowledge on how the two Byrd stations should be combined. We used the relationships between the two Byrd stations and the remainder of the Antarctic stations (with Scott Base and McMurdo – which show strong trends of 0.21 and 0.25 Deg C / decade – dominating the regression coefficients) to determine how far the two stations should be offset. By simply combining the two stations without considering how they relate to any other stations, it was Eric who threw this information away.
With this being said, combining the two station records without regard to how they relate to other stations does change our results. So if Eric could somehow justify doing so, our West Antarctic trend would increase from 0.10 Deg C / decade to 0.16 Deg C / decade, and the area of statistically significant trends would grow to cover the WAIS divide, yielding statistically significant warming over 56% (instead of 33%) of West Antarctica. However, to do so, Eric must justify why it is okay to allow RegEM to determine offsets for every other infilled point in Antarctica except Byrd, and furthermore must propose and justify a specific value for the offset. If RegEM cannot properly combine the Byrd stations via infilling missing values, then what confidence can we have that it can properly infill anything else? And if we have no confidence in RegEM’s ability to infill, then the entire S09 reconstruction – and, by extension, ours – are nothing more than mathematical artifacts.
However, to guard against this possibility (unlike S09), we used an alternative method to determine offsets as a check against RegEM (credit Jeff Id for this idea and the implementation). Rather than doing any infilling, we determined how far to offset non-overlapping stations by comparing mean temperatures between stations that were physically close, and using these relationships to provide the offsets. This method yielded patterns of temperature change that were nearly identical to the RegEM-infilled reconstructions, with a resulting West Antarctic trend of 0.12 Deg C / decade.
Lastly, Eric implies that his use of Byrd as a single station somehow makes his method more accurate. This is hardly true. Whether you use Byrd as a single station or two separate stations, the S09 answer changes by a mere 0.01 Deg C / decade in West Antarctica and 0.005 Deg C / decade at the Byrd location. The characteristic of being entirely impervious to changes in the “most critical” weather station data is a rather odd result for a method that is supposed to better utilize the station data.
Interestingly, if you pre-combine the Byrd data like Eric does and perform the reconstruction exactly like S09, the resulting infilled ground station trend at Byrd is 0.13 Deg C / Decade (fairly close to our gridded result). The S09 gridded result, however, is 0.25 Deg C / Decade – or almost double the ground station trend from their own RegEM infilling, and closer to our gridded result than to theirs.
(Weird. Didn’t Eric say their reconstruction better captures the ground station data from Byrd? Hm.)
Stranger yet, if you add a 0.1 Deg C / decade trend to the Peninsula stations, the S09 West Antarctic trend increases from 0.20 to 0.25 – with most of the increase occurring 2,500 km away from the Peninsula on the Ross Ice Shelf – the East Antarctic trend increases from 0.10 to 0.13 . . . but the Peninsula trend only increases from 0.13 to 0.15. So changes in trends at the Peninsula stations result in bigger changes in West and East Antarctica than in the Peninsula! Nor is this an artifact of retaining the satellite data (sorry, Eric, but I’m going to nip that potential arm-flailing argument in the bud). Using the modeled PCs instead of the raw PCs in the satellite era, the West trend goes from 0.16 to 0.22, East goes from 0.08 to 0.12, and the Peninsula only goes from 0.11 to 0.14.
(Weird. Didn’t Eric say their reconstruction better captures the ground station data from Byrd? Hm.)
And (nope, still not done with this game) EVEN STRANGER YET, if you add a whopping 0.5 Deg C / decade trend to Byrd (or five times what we added to the Peninsula), the S09 West Antarctic trend changes by . . . well . . . a mere 0.02 Deg C / decade, and the gridded trend at Byrd station rises massively from 0.25 to . . . well . . . 0.29. The Byrd station trend used to produce this result, however, clocks in at a rather respectable 0.75 Deg C / decade. Again, this is not an artifact of retaining the satellite data. If you use the modeled PCs, the West trend increases by 0.03 and the gridded trend at Byrd increases to only 0.26.
(Weird. Didn’t Eric say their reconstruction better captures the ground station data from Byrd? Hm.)
Now, what happens to our reconstruction if you add a 0.1 Deg C / decade trend to the Peninsula stations? Our East Antarctic trends go from 0.02 to . . . 0.02. Our West Antarctic trends go from 0.10 to 0.16, with almost all of the increase in Ellsworth Land (adjacent to the Peninsula). And the Peninsula trend goes from 0.35 to 0.45 . . . or the same 0.1 Deg C / decade we added to the Peninsula stations.
And what happens if you add a 0.5 Deg C / decade trend to Byrd? Why, the West Antarctic trend increases 160% from 0.10 to 0.26 Deg C / decade, and the gridded trend at Byrd Station increases to 0.59 Deg C / decade . . . with the East Antarctic trends increasing by a mere 0.01 and the Peninsula trends increasing by 0.03.
(Weird. Didn’t Eric say their reconstruction better captures the ground station data from Byrd? Hm.)
*** You see, Eric, the nice thing about getting the method right is that if the data changes – or more data becomes available (like, say, a better way to offset Byrd station than using the relationships to other stations), then the answer will change in response. So if someone uses our method with better data, they will get a better answer. If someone uses your method with better data, well, they will get the same answer . . . or they will get garbage. This is why I find this comment by you to be particularly ironic: ***
At some point, yes. It’s not very inspiring work, since the answer doesn’t change [indeed; your method is peculiarly robust to changes in the data it supposedly represents], but i suppose it has to get done. I had hoped O’Donnell et al. would simply get it right, and we’d be done with the ‘debate’, but unfortunately not.—eric
(emphasis and bracketed text added by me)
Eric’s claims that his reconstruction better captures the information from the station data are wholly and demonstrably false. With about 30 minutes of effort he could have proven this to himself . . . not only for his reconstruction, but also for ours. This is likely to be less time than it took him to write that post. You would think that if he felt strongly enough about something to make a public critique that he would have taken the time to verify whether any of his suppositions were correct. This is apparently not the case. On that note, I found this comment by Eric to be particularly infuriating:
If you can get their code to work properly, let me know. It’s not exactly user friendly, as it is all in one file, and it takes some work to separate the modules.
Here’s how you do it, Eric:
- Go to CRAN (http://cran.r-project.org/) and download the latest version of R.
- Download our code here: http://www.climateaudit.info/data/odonnell
- Open up R.
- Open up our code in Notepad.
- Put your cursor at the very top of our code.
- Go all the way to the end of the code and SHIFT-CLICK.
- Press CTRL-C.
- Go to R.
- Press CTRL-V.
- Wait about 17 minutes for the reconstructions to compute.
Easy-peasy. You didn’t even try.
I am sick of arm-waving arguments, unsubstantiated claims, and uncalled-for snark. Did you think I wouldn’t check? I would have thought you would have learned quite the opposite from your experience reviewing our paper.
Oops.
Did I let something slip?
***
I mentioned at the beginning that I was planning to save the best for last.
I have known that Eric was, indeed, Reviewer A since early December. I knew this because I asked him. When I asked, I promised that I would keep the information in confidence, as I was merely curious if my guess that I had originally posted on tAV had been correct.
Throughout all of the questioning on Climate Audit, tAV, and Andy Revkin’s blog, I kept my mouth shut. When Dr. Thomas Crowley became interested in this, I kept my mouth shut. When Eric asked for a copy of our paper (which, of course, he already had) I kept my mouth shut. I had every intention of keeping my promise . . . and were it not for Eric’s latest post on RC, I would have continued to keep my mouth shut.
However, when someone makes a suggestion during review that we take and then later attempts to use that very same suggestion to disparage our paper, my obligation to keep my mouth shut ends.
(Note to Eric: unsubstantiated arm-waving may frustrate me, but [snip] is intolerable.)
Part of Eric’s post is spent on the choice to use individual ridge regression (iRidge) instead of TTLS for our main results. He makes the following comment:
Second, in their main reconstruction, O’Donnell et al. choose to use a routine from Tapio Schneider’s ‘RegEM’ code known as ‘iridge’ (individual ridge regression). This implementation of RegEM has the advantage of having a built-in cross validation function, which is supposed to provide a datapoint-by-datapoint optimization of the truncation parameters used in the least-squares calibrations. Yet at least two independent groups who have tested the performance of RegEM with iridge have found that it is prone to the underestimation of trends, given sparse and noisy data (e.g. Mann et al, 2007a, Mann et al., 2007b, Smerdon and Kaplan, 2007) and this is precisely why more recent work has favored the use of TTLS, rather than iridge, as the regularization method in RegEM in such situations. It is not surprising that O’Donnell et al (2010), by using iridge, do indeed appear to have dramatically underestimated long-term trends—the Byrd comparison leaves no other possible conclusion.
The first – and by far the biggest – problem that I have with this is that our original submission relied on TTLS. Eric questioned the choice of the truncation parameter, and we presented the work Nic and Jeff had done (using ridge regression, direct RLS with no infilling, and the nearest-station reconstructions) that all gave nearly identical results.
What was Eric’s recommendation during review?
My recommendation is that the editor insist that results showing the ‘mostly [sic] likely’ West Antarctic trends be shown in place of Figure 3. [the ‘most likely’ results were the ridge regression results] While the written text does acknowledge that the rate of warming in West Antarctica is probably greater than shown, it is the figures that provide the main visual ‘take home message’ that most readers will come away with. I am not suggesting here that kgnd = 5 will necessarily provide the best estimate, as I had thought was implied in the earlier version of the text. Perhaps, as the authors suggest, kgnd should not be used at all, but the results from the ‘iridge’ infilling should be used instead. . . . I recognize that these results are relatively new – since they evidently result from suggestions made in my previous review [uh, no, not really, bud . . . we’d done those months previously . . . but thanks for the vanity check] – but this is not a compelling reason to leave this ‘future work’.
(emphasis and bracketed comments added by me)
And after we replaced the TTLS versions with the iRidge versions (which were virtually identical to the TTLS ones), what was Eric’s response?
The use of the ‘iridge’ procedure makes sense to me, and I suspect it really does give the best results. But O’Donnell et al. do not address the issue with this procedure raised by Mann et al., 2008, which Steig et al. cite as being the reason for using ttls in the regem algorithm. The reason given in Mann et al., is not computational efficiency — as O’Donnell et al state — but rather a bias that results when extrapolating (‘reconstruction’) rather than infilling is done. Mann et al. are very clear that better results are obtained when the data set is first reduced by taking the first M eigenvalues. O’Donnell et al. simply ignore this earlier work. At least a couple of sentences justifying that would seem appropriate.
(emphasis added by me)
So Eric recommends that we replace our TTLS results with the ridge regression ones (which required a major rewrite of both the paper and the SI) and then agrees with us that the iRidge results are likely to be better . . . and promptly attempts to turn his own recommendation against us.
There are not enough vulgar words in the English language to properly articulate my disgust [snip].
The second infuriating aspect of this comment is that he tries to again misrepresent the Mann article to support his claim when he already knew [or ought to have known] otherwise. [snip] In the response to the Third Review, I stated:
We have two topics to discuss here. First, reducing the data set (in this case, the AVHRR data) to the first M eigenvalues is irrelevant insofar as the choice of infilling algorithm is concerned. One could just as easily infill the missing portion of the selected PCs using ridge regression as TTLS, though some modifications would need to be made to extract modeled estimates for ridge. Since S09 did not use modeled estimates anyway, this is certainly not a distinguishing characteristic.
The proper reference for this is Mann et al. (2007), not (2008). This may seem trivial, but it is important to note that the procedure in the 2008 paper specifically mentions that dimensionality reduction was not performed for the predictors, and states that dimensionality reduction was performed in past studies to guard against collinearity, not – as the reviewer states – out of any claim of improved performance in the absence of collinear predictors. Of the two algorithms – TTLS and ridge – only ridge regression incorporates an automatic check to ensure against collinearity of predictors. TTLS relies on the operator to select an appropriate truncation parameter. Therefore, this would suggest a reason to prefer ridge over TTLS, not the other way around, contrary to the implications of both the reviewer and Mann et al. (2008).
The second topic concerns the bias. The bias issue (which is also mentioned in the Mann et al. 2007 JGR paper, not the 2008 PNAS paper) is attributed to a personal communication from Dr. Lee (2006) and is not elaborated beyond mentioning that it relates to the standardization method of Mann et al. (2005). Smerdon and Kaplan (2007) showed that the standardization bias between Rutherford et al. (2005) and Mann et al. (2005) results from sensitivity due to use of precalibration data during standardization. This is only a concern for pseudoproxy studies or test data studies, as precalibration data is not available in practice (and is certainly unavailable with respect to our reconstruction and S09).
In practice, the standardization sensitivity cannot be a reason for choosing ridge over TTLS unless one has access to the very data one is trying to reconstruct. This is a separate issue from whether TTLS is more accurate than ridge, which is what the reviewer seems to be implying by the term “bias” – perhaps meaning that the ridge estimator is not a variance-unbiased estimator. While true, the TTLS estimator is not variance-unbiased either, so this interpretation does not provide a reason for selecting TTLS over ridge. It should be clear that Mann et al. (2007) was referring to the standardization bias – which, as we have pointed out, depends on precalibration data being available, and is not an indicator of which method is more accurate.
More to [what we believe to be] the reviewer’s point, though Mann et al. (2005) did show in the Supporting Information where TTLS demonstrated improved performance compared to ridge, this was by example only, and cannot therefore be considered a general result. By contrast, Christiansen et al. (2009) demonstrated worse performance for TTLS in pseudoproxy studies when stochasticity is considered – confirming that the Mann et al. (2005) result is unlikely to be a general one. Indeed, our own study shows ridge to outperform TTLS (and to significantly outperform the S09 implementation of TTLS), providing additional confirmation that any general claims of increased TTLS accuracy over ridge is rather suspect.
We therefore chose to mention the only consideration that actually applies in this case, which is computational efficiency. While the other considerations mentioned in Mann et al. (2007) are certainly interesting, discussing them is extratopical and would require much more space than a single article would allow – certainly more than a few sentences.
Note some curious changes from Eric’s review comment and his RC post. In his review comment, he refers to Mann 2008. I correct him, and let him know that the proper reference is Mann 2007. He also makes no mention of Smerdon’s paper. I do. I also took the time to explain, in excruciating detail, that the “bias” referred to in both papers is standardization bias, not variance bias in the predicted values.
So what does Eric do? Why, he changes the references to the ones I provided (notably, excluding the Christiansen paper) and proceeds to misrepresent them in exactly the same fashion that he tried during the review process! [SM Update Feb 9- Steig stated by email today that he did not see the Response to Reviewer A’s Third Review; the amendment of the incorrect reference in the Third Review to the correct references provided in the Response to the Third Review was apparently a coincidence.]
And by the way, in case anyone (including Eric) is wondering if I am the one who is misrepresenting, fear not. Nic and I contacted Jason Smerdon by email to ensure our description was accurate.
But the B.S. piles even deeper. Eric implies that the reason the Byrd trends are lower is due to variance loss associated with iRidge. He apparently did not bother to check that his reconstruction shows a 16.5% variance loss (on average) in the pre-satellite era when compared to ours. The reason for choosing the pre-satellite era is that the satellite era in S09 is entirely AVHRR data, and is thus not dependent on the regression method. We also pointed this out during the review . . . specifically with respect to the Byrd station data. Variance loss due to regularization bias has absolutely NOTHING to do with the lower West Antarctic trends in our reconstruction . . . and [snip].
This knowledge, of course, does not seem to stop him from implying the opposite.
Then Eric moves on to the TTLS reconstructions from the SI, grabs the kgnd = 6 reconstruction, and says, “See? Overfitting!” without, of course, providing any evidence that this is the case. He goes on to surmise that the reason for the overfitting is that our cross-validation procedure selected the improper number of modes to retain – yet again without providing any evidence that this is the case (other than it better matches his reconstruction).
So if Eric is right, then using kgnd = 6 should better capture the Byrd trends than kgnd = 7, right? Let’s see if that happens, shall we?
If we perform our same test as before (combining the two Byrd stations and adding a 0.5 Deg C trend, so an initial Byrd trend of 0.75 Deg C / decade), we get:
Infilled trend (kgnd = 6): 0.45 Deg C / decade
Infilled trend (kgnd = 7): 0.52 Deg C / decade
Weird. It looks as if the kgnd = 7 option better captures the Byrd trend . . . didn’t Eric say the opposite? Hm.
These translate into reconstruction trends at the Byrd location of 0.42 and 0.45 Deg C / decade, respectively (you can try other, more reasonable trends if you want . . . it doesn’t matter). I also note that the TTLS reconstructions do a poorer job of capturing the Byrd ground station trend than the iRidge reconstructions, which is the opposite behavior suggested by Eric (and this was noted during the review process as well).
Perhaps Eric meant that we overfit the “data rich” area of the Peninsula? Fear not, dear Reader, we also have a test for that! Let’s add our 0.1 Deg C / decade trend to the Peninsula stations, shall we, and see what results:
Recon trend increase (kgnd = 6): Peninsula +0.08, West +0.02, East +0.02
Recon trend increase (kgnd = 7): Peninsula + 0.11, West +0.03, East +0.01
Weird. It looks as if the kgnd = 7 option better captures the Peninsula trend with a similar effect on the East or West trends . . . didn’t Eric say the opposite? Hm.
By the way, Eric also fails to note that the kgnd = 5 and 6 Peninsula trends, when compared to the corresponding station trends, are outside the 95% CIs for the stations. I guess that’s okay, though, since the only station that really matters in all of Antarctica is Byrd (even though his own reconstruction is entirely immune to Byrd).
As far as the other misrepresentations go in his post, I’m done with the games. These were all brought up by Eric during the review. Rather than go into detail here, I will shortly make all of the versions of our paper, the reviews, and the responses available at http://www.climateaudit.info/data/odonnell.
***
My final comment is that this is not the first time.
At the end of his post, Eric suggests that the interested Reader see his post “On Overfitting”. I suggest the interested Reader do exactly that. In fact, I suggest the interested Reader spend a good deal of time on the “On Overfitting” post to fully absorb what Eric was saying about PC retention. Following this, I suggest that the interested Reader examine my posts in that thread.
Once this is completed, the interested Reader may find Review A rather . . . well . . . interesting when the Reader comes to the part where Eric talks about PC retention.
Fool me once, shame on you. But twice isn’t going to happen, bud.