Over the past year or so, Mann’s “ClimateBall” defenders have taken an increasing interest in trying to vindicate Mannian principal components, the flaws of which Mann himself has never admitted. Indeed, in Mann’s self-serving Hockey Stick Wars, Mann once again claimed that the defective method was simply an “alternative centering convention”. So far, I’ve taken little interest in such efforts because, as far as I’m concerned, the defectiveness of Mannian principal components is established beyond any reasonable cavil. My attitude towards such efforts is probably not unlike Andrew Lacis’ attitude towards skydragons and their supposed slayers.
But the rhetoric of such efforts has increased in both volume and intensity. In recent comments at at Judy Curry’s (here), Kevin O’Neill accused the Wegman Report of “real fraud”, citing, as one of his major counts, its supposedly “deceptive display of only upward-pointing ‘hockey sticks’ – though half of them would have had to be downward pointing” . O’Neill challenged Curry for her supposed failure to recognize “real fraud”. O’Neill’s explanation for the supposed “fraud” was that it was “pretty obvious that a downward sloping hockey stick wouldn’t look like MBH. The Wegman Report was a political hatchett job.”
However, the 2006 NAS Panel also showed only upside-up simulated PC1s in their figure 9-2 illustrating the bias in Mannian principal components, explaining that the sign of a principal component series is arbitrary (a point previously made in MM05) and therefore selecting the arbitrary sign to align the PC1s to be upward-pointing. In addition, the coauthors of Juckes et al 2007 (including Briffa, Osborn, Myles Allen) similarly observed that the sign of PC series is arbitrary and re-oriented them to match the 20th century trend. So, if the technique is “real fraud”, as O’Neill alleges, the supposed “fraud” reaches far beyond the walls of the Wegman report, including both the NAS panel and the coauthors of Juckes et al 2007, a conspiracy of Lewandowskian proportions.
Further, Mann himself flipped over the downward-pointing MBH99 PC1 not just in the regression, but for the calculation of the Mannkovitch bodge illustrated in MBH99 Figure 2. Jean S has ably exposed the Mannkovitch bodge, but even Jean S did not take exception to Mann re-orienting the MBH99 PC1 to be upward pointing. But if O’Neill is correct in characterizing such re-orientation as “deceptive” and as “fraud” (on which I firmly disagree), he would, ironically, be providing an additional reason for Steyn to have used the term “fraudulent” to describe the MBH99 hockey stick.
But, in fact, far from being “deceptive”, the technique used by the NAS Panel (and Wegman) is not only legitimate, but more appropriate than displays that fail to allow for the fact that the sign of a PC series is arbitrary.
MM05
In my opinion, MM05 (GRL) stated that simulated PC1s occurred in both upside-up and upside-down orientations about as clearly as one could possibly wish for.
The hockey sticks were upside-up about half the time and upside-down half the time, but the 1902-1980 mean is almost never within one sigma of the 1400-1980 mean under the MBH98 method.
We also showed a histogram showing a bifurcated distribution of the difference between 1902-1980 means and 1400-1980 means divided by standard deviation (a simple measure of what we termed “Hockey Stick Index” (HSI) ): about half the values were positive (upside-up) and half were negative (upside-down.) We observed that PCs had “no inherent orientation”and that any apparent orientation of a PC1 was washed out in the regression step anyway, also pointing out that the archived MBH99 PC1 pointed down and was inverted in the regression step:
PC series have no inherent orientation and, since the MBH98 methodology uses proxies (including the NOAMER PC1) in a regression calculation, the fit of the regression is indifferent to whether the hockey stick is upside-up or upside-down. In the latter case, the slope coefficient is negative.
Because of this property, we considered the absolute value of the HSI in observing that Mannian PCs “nearly always” produced a HS-shaped PC1: we reported that the HSI was greater than 1 more than 99% of the time using Mannian PCs.
This property also entailed that graphical representation of the hockeystick-ness of PC1 series was most appropriately demonstrated by choosing the arbitrary sign of an individual PC series so that the hockeysticks pointed up.
While we did not show a 12-panel figure corresponding to Wegman Figure 4.4 in our two contemporary articles (MM05-GRL or MM05 -EE) or (to my recollection in any contemporary presentations), we did show a four-panel figure of this type in contemporary presentations, e.g. in one of the earliest CA posts here. In addition, MM05 Figure 1 is a two-panel figure showing one simulated PC1 upside-up, with the following covering text:
The simulations nearly always yielded PC1s with a hockey stick shape, some of which bore a quite remarkable similarity to the actual MBH98 temperature reconstruction – as shown by the example in Figure 1.
Because Wegman’s Figure 4.4 has also attracted controversy, I will discuss it separately in a follow-up post.
The 2006 NAS Panel
The 2006 NAS Panel likewise observed that principal components have an “arbitrary sign” (a statement that is equivalent to our prior statement that they had no “inherent orientation”) and, for their Figure 9-2 illustrating the bias from Mannian principal components, they selected the sign so that “the last 100 values [was] higher on average than the remainder” (a positive HSI):
The figure [Figure 9-2] shows the first components from five such simulations overlaid. Principal components have an arbitrary sign, which was chosen here to make the last 100 values higher on average than the remainder.
This procedure ensured that all hockey sticks pointed up in their Figure 9-2 as shown below. If O’Neill’s accusation against Wegman is valid (which it isn’t), then the NAS panel was guilty of the same offence, a conspiracy of Lewandowsky-size immensity.
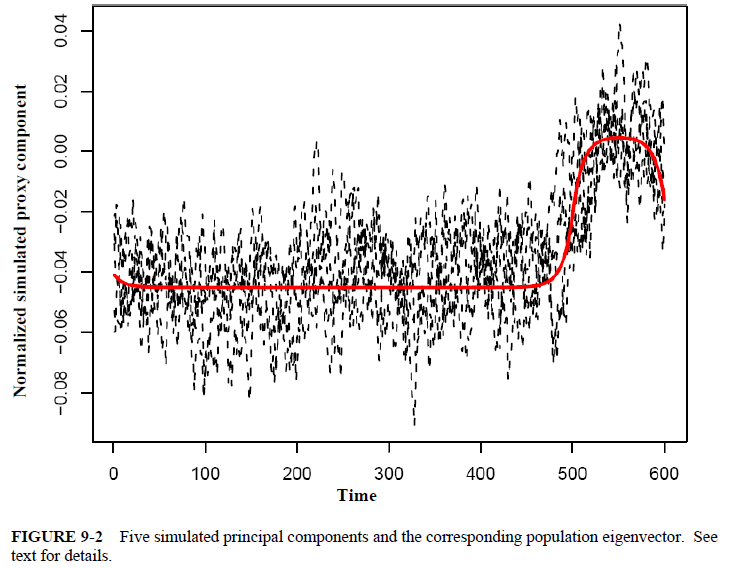
Figure 1. NAS Panel 2006 figure 9-2, demonstrating bias in Mannian “principal components”. Recognizing the “arbitrary sign” of PC series (but they could also have invoked the subsequent regression), the NAS panel oriented all five PC series upside-up to demonstrate the bias.
Juckes et al 2007
Juckes et al 2007 likewise observed that the sign of principal components is “arbitrary” and reversed the sign to yield a positive correlation:
for the proxy principal components in the MBH collection the sign is arbitrary: these series have, where necessary, had the sign reversed so that they have a positive correlation with the Northern Hemisphere temperature record).
If O’Neill is correct and this practice is “real fraud”, offending coauthors of Juckes et al included prominent IPCC scientists Myles Allen, Briffa, Esper, Hegerl, Moberg, Osborn, Nanne Weber (now deceased) and Juckes himself.
MBH99 and the Mannkovitch Bodge
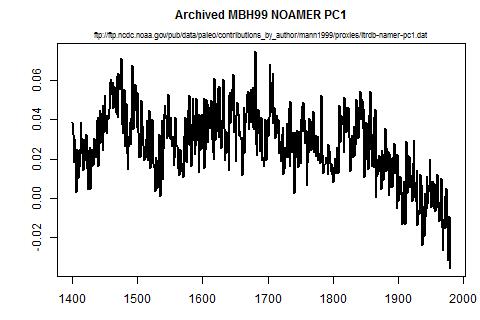
As noted above, in MM05, we observed that the archived MBH99 PC1 was an upside-down hockeystick. (The post-1400 archive is plotted in the left panel below).
the North American PC1 of Mann et al. [1999] is an upside-down hockey stick, as shown at ftp://ftp. ngdc. noaa. gov/ paleo/contributions_by_author/mann1999/proxies/itrdbnamer- pc1. dat.
In Mann’s calculation of the Mannkovitch bodge, ably exposed by Jean S several years ago here, Mann inverted the orientation of the MBH99 PC1 so that it pointed up, as shown in MBH99 Figure 1a (right panel below.) Mann also rescaled the PC1 from the PC scale (sum of squares equals 1) to “relative amplitude”. While I regard the Mannkovitch bodge as a prime example of “data torture”, I do not take exception to Mann’s selection of a sign for the PC series so that it points upward, a protocol that, as noted above, was also adopted by the NAS panel. If, 0n the other hand, selecting the arbitrary sign to orient a PC upside-up constitutes “real fraud” – as O’Neill alleged – then its original perpetrator was Mann himself, adding more ammunition to Steyn’s case.
 |
|

Figure 2. left – plot of archived MBH99 PC1 in downward orientation from NOAA archive; right – MBH99 Figure 1a, showing MBH99 AD1000 PC1 from 1400-1980 in upward orientation; .
Conclusion
Over the past year or so, Mann’s “ClimateBall” defenders have taken an increasing interest in trying to vindicate Mannian principal components, the flaws of which Mann himself has never admitted. Indeed, in Mann’s self-serving Hockey Stick Wars, Mann once again claimed that the defective method was simply an “alternative centering convention”. So far, I’ve taken little interest in such efforts because, as far as I’m concerned, the defectiveness of Mannian principal components is established beyond any reasonable cavil. I’m not talking here about efforts to demonstrate that the modern warm period is warmer than the medieval warm period – which I regard as an entirely legitimate enterprise – but on efforts to vindicate Mann on the narrowest issue of his erroneous principal components method. . It is with more than a little reluctance that I’m pushing back on a topic on which there ought to be no dispute.
Brandon Shollenberger previously discussed some of these issues in his sensible comments to O’Neill in the original thread at Judy Curry’s and in a followup post at his own blog, but overlooked the NAS panel diagram, which ought to clinch the issue even for O’Neill and Nick Stokes (a protagonist in the ClimateBaller counterattack and active participant in the thread).
On O’Neill’s specific allegation that the display of simulated PCs only in an upward orientation is “deceptive” and “real fraud”, O’Neill’s allegation, if true, would condemn not only Wegman, but the NAS panel, the coauthors of Juckes et al 2007 and even Mann himself. In fact, the technique used by the NAS Panel (and Wegman) is not only a legitimate method of illustrating the hockeystick-ness of Mannian principal components, but more appropriate than failing to recognize that the sign of a PC series is arbitrary – an error made in a figure by Nick Stokes that is heavily relied upon by ClimateBallers and which I will discuss in a forthcoming post.
While I’ve started with O’Neill’s allegation of deception and “real fraud” related to sign selection, I intend to cover several other ClimateBaller disputes, including allegations that our MM05 simulations were defective because they failed to first remove the “climate signal” (and that the simulated networks were therefore not “trendless”) and the false claim that HS-shaped Mannian PC1s are not “typical”, but actually “rare” and merely the result of “100:1” cherrypicking.


94 Comments
A link to Jean S’s description of the Mannkovitch bodge is missing from “ably exposed by Jean S several years ago here”
Steve: added.
The last sentence before the MM05 section appears to be incomplete:
“the technique used by the NAS Panel (and Wegman) is not only legitimate, but more appropriate than displays that fail to allow for the fact that the sign of a PC series.”
Perhaps an Intergovernmental Principal Components Committee should be formed to establish a consensus on how PCA should be done. Mann can then be identified as a PCA denier.
Steve [is arbitrary] fixed.
Your caption for figure 2 uses an alternative left/right convention. The MBH99 figure is on the right. Also, it’s MBH99 figure 1a, not 2a.
Steve: proofreaders are on form today. Fixed.
The first paragraph up to “cavil” is also repeated in the first paragraph of conclusions.
I read the exchanges at Brandon Shollenberger’s blog and can see that this debate has become futile.
The comments there reminded me of a review from one reviewer of a conference paper that The reviewer was challenged by the points made in my paper but did not (I suppose could not) provide any direct response to them. Instead he found one inconsequential typographical mistake in a object diagram ( a 1 instead of a 0) and fulminated for paragraph after paragraph about how the thrust of the paper couldn’t be correct and the 1 instead of 0. He even provided a section about the conference having standards and how my paper fell far beneath them. Anyway the other three reviewers liked the paper and it was accepted and the paper’s conclusion’s have been borne out by reality so that review is just fodder for anecdotes now.
The point of all this is that some people will never be convinced and will continually strive to find anything, however trivial, to maintain their beliefs. Debates with them are futile as can be seen at Shollenberger’s blog. Even if their points are conclusively refuted, they will not accept it. They simply withdraw into irrelevant minutiae and then return to reassert their original refuted point over and over again.
TAG, if Mark Steyn ever manages to corner Michael Mann in a courtroom, the work Steve McIntyre, Brandon Shollenberger, Jean S, and others have done in documenting the specific details of Mann’s suspect research methods will become crucial to the outcome of the trial.
We can think of this work as being pre-trial investigative research which documents the Principle Components of Mannian Methods.
If nothing else, compiling this body of pre-trial investigative research is good practice for dealing with the kinds of scientific and methodological issues Mann’s lawyers might choose to raise in the course of a jury trial — if his lawyers were foolish enough to go down that path; which, as their most recent brief seems to indicate, they well might be.
Nick Stokes has already resorted to saying he never argued about the sign, just the selection process. However, even his random sample which Brandon posted as Nick’s claimed correct figures, looked so close to the original that I thought he had only avoided reorienting.
Steve: I attributed the fraud allegation to Kevin O’Neill, not Nick Stokes. Nick Stokes’ figure here, upon which much ClimateBall commentary rests, shows PC1s in both upside-up and upside-down orientation, yielding a very different impression than a panel plot with consistent orientation. On other occasions, Stokes has argued the importance of moving only one part at a time. So if he wasn’t contesting the validity of consistent orientation, then he should have shown a panelplot with consistent orientation. His failure to do so has misled ClimateBall readers of his blog. I’ll write more on this in my forthcoming post.
I was referring to the commentary for Brandon’s post, which he summarized here. It appears that that is not Nick’s figure but DeepClimate’s.
Steve: link to commentary in question?
MikeN, which figure do you think was DeepClimate’s, not Nick Stokes’s? The figures I posted were all taken from Stoke’s blog. The point was to show if we take the figure from the Wegman Report he criticized as dishonest:
http://hiizuru.files.wordpress.com/2014/09/9-14-wegman_version.jpg?w=377&h=377
And compare it to the figure we get without the problem he was complaining about:
http://hiizuru.files.wordpress.com/2014/09/9-14-stokes_version_flipped.png?w=377&h=377
The difference is very minor. I created that last figure by simply flipping over the negatively oriented graphs in the figure Stokes said was “right”:
http://hiizuru.files.wordpress.com/2014/09/9-14-stokes_version.jpg?w=387&h=387
You can even see almost the entire disparity between the “right” and “dishonest” figures is that Stokes chose to show graphs with a negative orientation. Had he flipped the negative hockey sticks, which this post shows everyone in the climate science field does, he wouldn’t have had a case. It was only by singling the Wegman Report out for doing what’s considered standard in the field that Stokes was able to act like there was a meaningful problem.
And to hide that fact, he tried his hardest not to discuss the orientation issue in conversations because doing so would prevent him from conflating the effects of the non-random sample and re-orientation issues.
(And when pressed on this, he got made and stormed off.)
Should samples be flipped to show upward orientation in the end, or should the extreme value be at the top of the graph?
MikeN, the HSI used by MM compares the average of 1902-1980 to the average of the series in general. That means what matters is where the far right end winds up. As long as an extreme value is not in the last ~80 or so points, it should usually be on the bottom side.
You linked it above, from Brandon’s blog.
So people don’t have to read all the comments, here are some highlights from Nick Stokes in our exchange:
The mistakes have to be hidden in preparation for the trial. If they can discredit Wegman, and the other critics of Mann’s work, then it makes it easier to disprove fraud.
I do not think they can, either in a court or the scientific world. But that will not stop them from trying.
Your conclusion is repeating much of the beginning. I suggest instead you replace it with the following:
CONCLUSION
Allegation of upside-down usage is bizarre. Regression algorithms are blind to the sign of the indicator.
That is always the first thing that comes into my mind when I hear this argument. Mann himself said that thr regression was blind ti the sign of the indicator.
You have to understand that we are dealing with people who think they are smart but are just educated welk beyond their natural intelligence. They simply don’t understand what it means and the more their super ego begins to realize that they were wrong the more their ego fights back.
I await Kevin O’Neill’s response. Perhaps John Mashey will also lower himself for a moment and offer some corrections to the above. I’m sure Nick will be along shortly.
Where one ends up by not facing the faults in your position further down and earlier. This came home strongly in Mann’s talk, Lew’s choice of questioners and the first discussion I had at the event at Bristol last night.
I had completely forgotten the NAS panel did the same thing. That’s definitely a good point. I know I pointed out NOAMER PC1 was upside down and flipped by Mann et al in a comment responding to Kevin O’Neill, but I forgot to comment on that in the post. It’s pretty strange to claim something is dishonest when one specific person did it if much everyone else did it as well.
By the way, Nick Stokes didn’t use accusations of fraud, but he has claimed using only one orientations was dishonest. It’s actually quite funny. When I discussed that issue, he insisted I was missing the point (even though he went on to repeat the claim it was dishonest). He seemed to get upset that I discussed the orientation issue instead of the one he wanted to discuss.
I’m not sure how Stokes can claim using only one orientation is dishonest, say orientation is irrelevant, and show a graph whose visual impact is almost entirely dependent upon using both orientations instead of just one.
Nick Stokes (h/t Brandon), Racehorse to the end, denied that Mann flipped the MBH99 hockeystick. Stokes has plotted the MBH99 archived PC1 – so he knows that it points down. He knows that MBH99 PC1 points up, but nonetheless claims that Mann “didn’t flip anything”:
Brandon also observed at his blog that IPCC (AR4) flipped the MBH99 PC1. (It’s in their spaghetti diagram of 1000-year proxies.) So O’Neill’s “fraud” extends past the NAS panel, past the authors of Juckes et al, past Mann himself and even includes the IPCC.
😉 Evidently they are all following Mann in extending flipping to flip-flopping.
When I first read your comment, I thought you were parodying the chorus from Rapper’s Delight. I’m sad you weren’t.
Steve: in some earlier CA posts, there were occasional citations to “conference” presentations by K.D. Jones. Also in response to Hansen, a workshop presentation by Knowles et al.
Popcorn time!
‘ is established beyond any reasonable cavil’
but your dealing with unreasonable , were belief is more important than fact.
you’re dealing
unreasonable people
where belief
Oof. Spelling and malapropisms count.
Typical of KNR. Proofreading a short post is anathema to him/her/it.
On the contrary, it’s a clever way of getting you to read every word (like you did!) so that you take on board the substance of what he’s saying.
I don’t know who Kevin O’Neill is or why anyone would care to know his opinion about the Wegman Report. Sorry.
Jeff Normam, the point isn’t that Kevin O’Neill’s opinions in particular matter. The point is many people have adopted a particular attitude and set of views which O’Neill exhibits. By highlighting what O’Neill said, we can discuss the issue in general.
Patton Boggs seems to have deleted O’Neill’s CV.
Missing a single colon causes havoc. The URL is http://www.pattonboggs.com/professional/kevin-oneill
Steve: why does anyone think that fraud-alleging blog commenter Kevin O’Neill is this lawyer as opposed to some other Kevin O’Neill.
It almost certainly is not him. The profile has some correlating factors: lobbying for funding space research, bike lanes, alternative energy, environmental mitigation, research parks, generally helping people with bureaucracy and regulations, plus ‘the federal government can be your best ally’. However, this is outweighed by his primary political activity being a PAC for the interests of college students, and a fundraiser for Romney/Ryan as well as a Republican Congressional candidate.
It’s my impression he’s a software engineer.
In a Lewandowski like ambush, Kevin O’Neill waits 8 years to point out this, to him, obvious fraud. Where was he in 2006 when this was fresh in everyone’s mind and the parties were available to knowledgeably respond? I for one have no recollection of such allegations in 2006 or 2007 by O’neill, I can only recall the diversionary and inconsequential allegations of plagiarism traced to a student who assisted with Wegman’s report. Wegman was right! Climate Science in 2006 had consisted primarily of a “team” of 43 who reviewed, assisted and collaborated uncritically with each other. Jean S in her post on Black Tuesday indicates the results of that collaboration.
Steve: our articles on MBH in 2003 and 2005 were 5 and 7 years afterwards, but the issues were still fresh. I don’t agree with your point here.
Jean S. is not a ‘her!’
Ah, more’s the pity. That’s my kinda gal.
This post reveals yet again why Mann’s enthusiastic promotion of the latest alleged vindication of his life’s work is so important: the Marcott 2013 “super hockey stick” (as swoosh gesture described by a coauthor to NY Times reporter Revkin over video chat) didn’t use a statistical black box laypeople (or lawyers, judges and policy makers) simply cannot understand so must rely on authority to asses, something skeptics simply lack. There was no visually significant blade in *any* of the input data, and the blade was due to bizarre re-dating of some data to create a publication-worthy blade as a pure artifact of sudden spurious data drop-off at the end of their averaging. I hope Steyn’s lawyers are aware of it.
Willis’ plots of the data are here, along with a collage of mathematician Mann’s Snoopy Dance about it on Facebook:
I may have to retract my theory that the source of the paranoid conspiracy ideation among climate anti-skeptics is due to an undiagnosed psychiatric disorder, a simpler explanation may be that there is an underlying but as yet undiagnosed READING DISORDER prevailing among the anti-skeptic community. As scientists we should always prefer the simpler hypothesis – until more definitive data can be discovered.
If O’Neill cannot [correctly] parse the statement that Steve quoted from the NAS panel:
he would probably be unlikely to be able to make the correct logical deduction, which was that the NAS panel was trying to demonstrate that this method *could* produce ‘Mann like’ upward pointing hockey sticks if so desired.
If such poor fellow really cannot understand standard written English it’s no wonder that he may be exhibiting signs of paranoia. Public education officials should be notified so that remedial reading programs can be instituted for the anti-skeptic population.
Of course I cannot exclude the possibility that there is a more generalized learning disorder at work here that impacts other areas of learning such as mathematics and arithmetic – though I defer to others more qualified than me to make that diagnosis.
I only wish I was being entirely sarcastic with what I just wrote.
W^3
This post is following Brandon’s strategy of “Look over there”. Kevin spoke about Wegman orienting the profiles.
The orientation is just a symptom – it shows something is wrong. What is wrong is the underlying selection, which was Kevin’s main point. Choosing 100 out of 10000 ranked by hockey stick appearance and claiming them as typical. As I pointed out, both centered and non-centered PCA produce hockeystick profiles when subject to this selection.
I don’t know whether this comment will appear. All my comments seem to go to spam now. This is my third try.
I’ve commented in more detail http://www.moyhu.blogspot.com.au/2014/09/climateball-at-climate-audit.html
As I understand it, Principal Component Analysis finds the closest lower-dimensional subspace (of a given number of dimensions) to a set of points in a higher-dimensional space. The Principal Components are basis vectors of the found lower-dimensional subspace. The sign of any basis vector is irrelevant, since if you negate it, you can simply also negate the corresponding coefficient. So any kind of complaint saying that someone “flipped” a basis vector is based on some kind of misunderstanding.
Steve: as I observed in the post, in our earliest articles, we said that the PC series had “no inherent orientation”. The issue at hand is Nick Stokes’ insistence on showing PCs both up-pointing and down-pointing, thereby giving a rhetorical impression of inconsistency. While Stokes claims that he is criticizing alleged cherrypicking and not contesting orientation – and in other circumstances has criticized others for moving more than one part at a time – Stokes is being amazingly stubborn in his refusal to show his panelplot in one consistent orientation as NAS and Wegman had done. If he does the plot in the requested form, it will show that the series have HS shapes. Stokes has been getting away with this trick for several years now and it’s time to call him on it.
“Stokes is being amazingly stubborn in his refusal to show his panelplot in one consistent orientation”
The plot is as produced by your program (MM05 GRL fig4.r) with selection of the top 100 out of 10000 removed. There is no provision in the code for inverting curves of unsatisfactory HS status. Wegman’s caption said:
“One of the most compelling illustrations that McIntyre and McKitrick have produced is created by feeding red noise [AR(1) with parameter = 0.2] into the MBH algorithm. The AR(1) process is a stationary process meaning that it should not exhibit any long-term trend. The MBH98 algorithm found ‘hockey stick’ trend in each of the independent replications.”
It didn’t mention that the MBH algorithm has to be modified in accord with the MM05 HS index. I graphed them as they were produced.
Nic Stokes, this response is disingenuous. By restricting one’s sample to the top x results, one guarantees only positive results will be chosen. As such, there is no need to explicitly invert anything. It is inherent to the code as produced. By removing the step which selects the results, you remove the inherent inversion which was present in the code.
That you introduced this change is easy to demonstrate by refactoring the code. One can produce results identical to what the code currently produces by making just two changes:
1) Generate 5,000 series instead of 10,000.
2) Invert any graphs with a negative hockey stick.
The results will be identical, and the inversion step will be explicit. In this case, changing the code which handles the selection will not change the code which handles the inversion. That means if one made the same change you made to the current code, the results would not match the results given with your current change.
A methodology should not produce different results simply because it is expressed in a different way. Your approach to studying this problem does. That shows it is wrong. Had you actually reworked the methodology in the code, you would not have ended up with upside down hockey stick.
As it stands, you are effectively arguing a step in creating the graph was not explicitly coded, thus you can ignore it at will.
Brandon,
“That you introduced this change is easy to demonstrate by refactoring the code. One can produce results identical to what the code currently produces by making just two changes:
1) Generate 5,000 series instead of 10,000.
2) Invert any graphs with a negative hockey stick.”
Not true. You’ve left out the bit about selecting the top 100, which is the part you are smoke-screening with all your talk about sign. The issue isn’t the omission of, say, 5000 curves with negative sign. That might have some symmetry. It’s the omission of the other 4900 which had positive HS index, but not enough for display.
Nick Stokes, your response is silly. I listed two changes one could make to the code to produce the same results. You say:
Even though this “bit” is part of the code I was discussing. I didn’t suggest that “bit” would be changed so I had no reason to mention it. If I say, “Change only Steps 1 and 2,” I don’t need to then say, “Don’t change Step 10.” It doesn’t matter what Step 10 is. Everyone can understand when I say to change “only Steps 1 and 2,” I mean you do, in fact, leave Step 10 unchanged.
Either you made a boneheaded mistake, or you are trying very hard to not understand what I said. My point was quite simple. Your claim to merely be graphing results as produced wouldn’t hold true had the methodology been expressed in a different way. Had we refactored the code (in the simple way I described above) before applying your change, you would have gotten different results.
I’ve shown there are two equivalent ways of expressing the same results. If we apply your change to both, the two no longer produce the same results. That means your change, when applied to two equivalent expressions, results in inequivalent expressions. That shows your change is the source of a methodological difference you don’t account for in your discussions.
Brandon,
“I didn’t suggest that “bit” would be changed”
Why would you do any of that if the code was selecting top 100 by HS index and producing only positive curves?
Nick Stokes, you made what appears to be a bonehead mistake. Why won’t you address that? Why should I answer your question when you grossly misrepresented what I said and now simply “move on” rather than correct your error?
As for your question, it’s silly. I provided a thought experiment to show the effect of the change you made. There’s no reason I should have to justify actually using a hypothetical example. Thought experiments don’t require the hypothetical situations you consider be ones you’d actually use.
It would help if you would try directly addressing what I say for a change, preferably without cherry-picking tiny portions so you can focus only on the topics you want to discuss. It would also help if you would admit when you say things about people’s comments that are completely untrue.
Nick,
my advice what is worth is to you is to concentrate now on this sign “issue” at hand. Steve is preparing a post on the selection “issue”, so you will have your say on that also.
Brandon,
“Why won’t you address that?”
It makes no sense. You’ve said you’d keep the selection. Fine, you’ll get all positive curves, and orientation isn’t an issue.
It’s only an issue if you remove the selection. That lets in about 100 that were as HS-like but upside down. But it lets in 9800 of the original 10000 that didn’t look so good (HS) in any orientation. So just restoring the orientation won’t give the same result, however you do it.
Nick Stokes:
If you were on the other side of this issue, willard would give you all sorts of grief for this remark.
It’s only an issue if you remove the selection.
If you pay any attention to my example, you’ll see orientation doesn’t need to be an issue “if you remove the selection.” You know both Wegman and McIntyre implicitly inverted series for display purposes. You know your change to their code removed this implicit inversion step. You know your removal of this implicit inversion step is the dominant cause of the visual discrepancy you displayed. As such, you know the non-random sampling done in their code is largely irrelevant to what you displayed save in that it selects series with only one orientation.
To put it more simply, you know your displayed results depend largely upon showing upside down hockey sticks. You know the intention of the people using the code was to show only rightside up hockey sticks for visual comparison purposes. You know this intention would remain whether or not their sample was representative.
You could easily create a representative sample of rightside up hockey sticks. You could easily compare this to the results published in the Wegman Report. If you did, you would find there is very little difference. It is only by adding in the issue of rightside up/upside down hockey sticks that you could claim there was a meaningful impact.
The orientation issue does not need to be combined with the selection issue. The two were combined in the code, as written, but that does not mean the two must be combined when discussed. I demonstrated this by showing the code could have been written with the orientation and selection issues kept separate.
Er. The second blockquote in my last comment should obviously end after the second line. I must have forgot to close the tag.
John A: Fixed (I think)
Nick Stokes, Brandon is saying you should change
make 5000
flip inverted
take top 100
to
make 5000
flip inverted
and that the first part is equivalent to the original.
MikeN, it’s actually “make 10000” in the original. You have to change 10,000 to 5,000 though because selecting the series with the highest HSI means you’re only selecting positive series,* basically discarding the ~5,000 series with negative hockey sticks. It doesn’t change anything, but people like Nick Stokes seem to enjoy taking any point which isn’t perfectly clear as a chance to divert the discussion.
*Technically, this is only true if you the sample you take is less than half the size of the total population. If it isn’t, you are no longer doubling your effective sample size. That’s obviously irrelevant here as 100 is only 1% of 10,000, but I wouldn’t put it past someone to make an issue of it.
Didn’t MBH graph PC1 in accord with the MM05 HS index?
So much to get my head around. I just was not seeing it. I finally went back and reviewed your reference to Jean S’ piece on the Mannkovitch Bodge and Jean’s sub references to the three prior articles you wrote on CO2 adjustments,as well as their comments, plus these threads.
I am finding that the work you are doing is becoming quite persuasive. I am beginning to think that the complexity may be more of an advantage than a disadvantage.
Great stuff!
Barclay,
I believe that the certain “complexity” (in lack of a better word) of Mann’s work is one of the reasons why he should never have gone to the court. Years ago, when the original findings where done here, the complexity kind of prevented people to really understand what had been done. It allowed Mann to make all these non-meaningful defences as not only his supportors but many other who were truly interested could not really understand the issues. Now this is backfiring to Mann. We can now use CG letters to backup our results, we have experience on what was people hard to understand in the original articles and we can additionally show how none of Mann’s previous (often self contradictory) explanations really do not hold water.
Hi Jean:
I of course would have to do much a more thorough and complete analysis Than I have done, as indicated above.I would further have to do the analysis in the context of the “burden of proof” and the “defenses” that will be required of each party, and The level and allocation between the parties of the burden of proof varies from jurisdiction to jurisdiction and depends on the case and its issues. In short I don’t really know much yet.
That being said and at that incomplete level of understanding, I believe your summary above may very well be on the right track. I don’t disagree with any of your points. There appears to be extensive supporting evidence for what you are saying just in the few posts we are discussing here. As you point out, the impressive complexity of the subject matter makes it quite easy to completely confuse and mislead a layman such as myself, unless I have the patient assistance of someone like yourself and Steve and other contributors to CA.
But, as to Mr Steyn, in the context of the endless complexity of the subject matter to a layman, I’m wondering if it doesn’t make it far more difficult to prove Mr Steyn had actual malice or was even negligent, when we can be easily and cluelessly fooled.
PS: sorry about the errant pronoun in my above post. And I do know who you are! I am certain that I must have a faulty “post comment” button:) Consistently, as soon as I push it, numerous errors appear:)
The “regression algorithms are blind to the sign of the indicator” led many scientists to declare that McIntyre and others simply didn’t understand the issue at all.
Lets not forget that the reason Mann claimed that “regression algorithms are blind to the sign of the indicator” was that he had used the Tiljander proxy upside down. It was essentially an answer to a question which was never asked.
While “regression algorithms are blind to the sign of the indicator”, physical measurements most certainly are not. He used an uptick in the proxy that was the result of contamination to assert anomalous warmth when the physical interpretation of the proxy would have asserted anomalous cold. He has never corrected or admitted this mistake, AFAIAA, even though some of his colleagues have.
Yes, that’s why it misinformed so many, they assumed that the answer was responsive. On the other hand, Martin Vermeer thought it was a valid response, because regression algorithms ARE blind to the sign of the indicator.
Nick Stokes,
Assuming you can still comment (WordPress issues):
It is unclear to me exactly what you are claiming. Since the Mann method automatically “flips” the orientation of proxies to best correlate with the temperature history, I don’t see how you can complain about the flipping of orientation of synthetic data…. I mean, in the original Mann et al publications the same thing happens. Where do you see a problem with flipping synthetic (noise generated) proxy series? Isn’t that what is supposed to be done?
With regard to selecting the synthetic proxies, that too seems to be an automatic consequence of the Mann et al method; Mann et al weight the contributions of the individual proxies to generate a best correlation to the temperature history during the instrumental period. If I remember correctly, they started with ~95 proxy series, and the final hockey stick shape was the result of significant contributions from only a few of those 95. Now you could argue that a 1:100 selection rate is not a fair comparison with a ~3:100 selection (a la Mann et al), but I don’t think that selection based on correlation with a specified target is a reasonable objection, since (once again) that is part and parcel of the entire Mann et al method. All you are really talking about is how many strands of spaghetti are selected from the bowl….. and clearly the large majority (if not all!) of the spaghetti strands convey no useful information.
Am I missing something obvious here?
Lastly, it strikes me as more than a little disingenuous for people to be using words like ‘fraud’ when everything (source code, methods, data, everything) has been made available. Considering the complete availability of information about what was done, do you really think that fraud is a suitable description, and if so, why?
Steve FItzpatrick:
Thanks Steve—that’s a good observation. I wonder if this occurred to Steve McIntyre when he added it to his code?
I was arguing on Nick’s blog that selecting out the hockey sticks by largest hockey stick index (HSI) value is just a sensible approach for validating the hockey stick index. That is… do the samples with the largest HSI look like hockey sticks?
Some dude named “Ned W” was arguing that one should also look at other ranges of absolute value of HSI. That seems reasonable to me, because it gives you some idea about how well sorting by HSI is really capturing the feature you want to look at, but I don’t see that it is essential that it be done. Or that there’s even a flaw in choosing not to do so:
I argued there that Figure 2 of M&M 2005 GRL is much more informative in that respect.
It seems clear that if HSI were not informative of the “hockey-stick-like” nature of the PS1s generated by Mann’s short-centered PCA algorithm, then you’d see more similarity in the distributions.
I also commented there that,
Also, is it just me, or are M&M flipping off Mann in this figure?
For my forthcoming post on this topic, I’ve done a plot of randomly selected hockeystick PCs in three columns, one with 10-30 percentile, one with 40-60 and one with 80-95. All three columns look hockeystick-ish. Nick’s panelplot of high-HSI centered PC1s have HSI of about 1.5-1.6, about 40-50th percentile. Even Nick said that they had a strong HS appearance.
For all the ClimateBaller handwringing, the most remarkable thing is that HSI of 1.6 doesn’t look materially different than HSI of 1.9. But after all, the HSI is only 15% less, not enough to make a dramatic difference.
Mashey uses the analogy of basketball players and general population. Figure 2 shows the comparison between 10000 centered and 10000 Mannian PC1s – which would be equivalent to comparing 10000 NBA players and 10000 ordinary population. There is no cherrypicking. Nick Stokes knows this, but has never said a word of opposition to Mashey and those guys. Disgraceful.
In retrospect, for the single PC illustrated in MM05 Figure 1, I would have chosen a PC with near-median HSI of 1.62, but I didn’t think of that at the time. However in reading NBA webpages on average heights, they picked Jason Richardson one year as the closest to an “average” NBA player in size, weight and experience. However, in their 2007 Survey of Heights, which showed the average NBA height as 6′ 7+”, but their color picture for the graphic is Yao Ming, who was then the tallest player in the league. But illustrating their article with a picture of a tall basketball player is not the proof that NBA players are taller than average people. That comes from looking at the height distributions through tools like histograms.
SteveF,
“I don’t see how you can complain about the flipping of orientation of synthetic data”
For the umpteenth time, I don’t. That’s a smokescreen that Brandon has put up. The fact that the HS orientation displayed is uniform is a clear indicator that selection, or something artificial has happened. It is the artificial selection that is the complaint, not the clue
“With regard to selecting the synthetic proxies, that too seems to be an automatic consequence of the Mann et al method; Mann et al weight the contributions of the individual proxies to generate a best correlation to the temperature history during the instrumental period.”
The weighting is generated by the principal components method. PCA use for dendro goes back at least to Fritts, 1971. There is no way that choosing 1% of the most HS-like output in any way models that. And the weighting is in no way special to the decentering, which was Wegman’s topic.
“Considering the complete availability of information about what was done, do you really think that fraud is a suitable description, and if so, why?”
I haven’t used that description.
Steve: Nick, you say that you are not arguing about orientation and yet you have stubbornly refused to produce a graphic showing randomly selected Mannian PC1s in consistent orientation. Now that I’ve learned that this is an issue, I’m going to present such a graphic. I think that you should have done so long ago and that your refusal to do so is like Mann’s withholding of verification r2, because you have not wanted to show the results.
Nick,
So then I assume if Mann’s PC method of generating weightings were applied to 95 unselected synthetic series, using the instrument record as a target, and that method generated a synthetic hockey-stick, then you would be convinced Mann’s method is biased. Have I got that right?
I asked “do you really think that fraud is a suitable description?” But you did not answer the question I asked, instead you threw in an orthogonal reply to a question I did not ask…. that YOU haven’t used that description. Damned right, and neither did Barack Obama, Tony Abbott, or Her Majesty the Queen of England. All equally informative observations. So let me rephrase: Do you think anyone (including Kevin O’Neill) is justified in using that description?
Steve,
I follow the policy of our host in using this terminology. I don’t think it is helpful.
Good grief Nick. Such obtuse replies to simple questions lead to the use of ‘nick-names’ like ‘Racehorse’. Seems to me you are quite willing to critique the use of such terms when you disagree with the other person’s politics, but not so willing when you agree with their politics. Reflects poorly on you my friend.
Steve,
“Such obtuse replies to simple questions”
Well, as I say, I think my policy there is similar to that of our host. I’m sure he’s given similar answers many times.
He is not asking you to use it.
Kevin used it. Do you agree Kevin used it?
Brandon has already flipped Nick’s graph.
Nick has conceded hockeystickishness when he posted his figure, but I think if flipped, his argument disappears.
Nick:
But we already know that selection occurred and exactly how, without resorting to the sign. What then does discussing the sign add?
Why do you persist in bringing it up at all?
Moreover, I think I have a first grasp on why one would select for exemplars from a data set when studying the efficacy of a feature selection algorithm. It’s something I would do myself, even if I wouldn’t regard it as a “primary test”. [Again I think the PC1 histograms are much more informative in that respect.]
I’m afraid this is one of these one-sided complaints of yours that ends up having no substance.
The problem really seems to be more of the meaning you’ve conferred on the selection process, rather than to any overarching issues with Wegman’s handling of the computational data.
You said:
I haven’t tried implementing his method (though I routinely use PCs in my own code and have done so since before Mann was a grad student). And I’m a firm believer that the only way to really understand something is to replicate it yourself (which is why I am a firm believer in sharing code that can be used for replication, even if it’s not the “original” code).
But from what I’ve read, what you are saying here is inaccurate. In particular, see this comment of Brandon’s
If Brandon is correct, the method you are describing cannot possibly be the method used by Mann.
That term was used by Kevin O’Neill, who I think has since retracted it.
do you have a link to O’Neill’s retraction?
I am pretty sure Carrick’s memory is off on this one. I don’t believe Kevin O’Neill retracted anything, and I certainly don’t believe he retracted his accusations of fraud.
Here it is:
http://www.moyhu.blogspot.com/2014/09/climateball-at-climate-audit.html
“Kevin O’NeillSeptember 25, 2014 at 11:48 AM
I completely agree that Wegman was simply incompetent in his work. I only threw ‘fraud’ in there because of JC’s injudicious use of the term in her post. Hell, if a mistake or use of a suboptimal method is akin to fraud, then we’re all frauds.”
JD
Steve, Kevin retracted it on Nick’s website. Look in your spam folder. I think he posted here, but he may have linked to his statement on that blog (and that may be landing people in the spam folder.)
Ah, that explains why I didn’t know about it. I don’t usually look in new locations for retractions of what was said in other locations. I think if you’re going to retract what you said somewhere, you ought to at least post a note in the original location.
Nick, if your figure is plotted with same orientation throughout, I don’t see an issue of something different. Indeed, at Brandon’s I originally misunderstood your version as the same selection of top 100 as MM05 but with a few figures flipped.
Steve McIntyre, I find Nick Stokes’s behavior remarkable. The most surprising thing to me is I wrote my post on this in response to a very specific claim by Kevin O’Neill, one which specifically argued showing only one orientation was dishonest. Stokes promptly showed up to say I was completely missing the point. Now he keeps referring to the orientation issue as a “smokescreen” I’ve created, implying I’m trying to mislead people.
According to Stokes, discussing the issue predominantly responsible for the visual discrepancy he highlighted, in direct response to a person bringing up that issue, is wrong and misleading.
I can’t know whether he actually believes that, but it is remarkable either way.
Steve: it sort of reminds me of upside-down Tiljander. Think of the contortions that Gavin Schmidt went through to be wilfully obtuse to requests for a no-bristlecone no-Tiljander Mann 2008 reconstruction – all the time pretending that the request was unreasonable. When one looks at the undeniable HS-ness of randomly selected PC1s plotted in consistent orientation, it’s hard not to speculate that this is the reason why Stokes has refused to show this graph for so long. I’d hope to finish my post on this today, but most likely tomorrow.
I don’t know why anyone who’s spent any significant time around the forums would be surprised at Stokes’ behaviour. He is intelligent, obstinately stupid and both, depending on whether sceptical inquiry needs derailing or “team” misdeeds require obfuscating. He will hang onto a lost argument until the bitter end and then disappear.
Brandon, the smokescreen is Nick’s.
Frankly, I anticipate nothing much changing at all after Steve’s post tomorrow. Nick’s argument as far as I can tell, ignores everything you all are doing because he a much more subtle point that you all are overlooking.
This is my interpretation on what Nick is actually saying: The HSI has an even distribution of positive and negative. To show that what MM did is correct in their method, you must show a random selection of all these graphs as-is, which will show an even distribution of positive and negative. To only show positive results is wrong, in that it isn’t a representative sample of the results, which should show positive and negative. To flip them (as Steve has show doesn’t matter) is to do something extra and beyond what the method did, therefore it is inappropriate for the purpose of displaying the method validation to flip them (because the method did not flip them at this point, and you are showing the method to this point, so any change to the graph is extra from the method at this point and shouldn’t be done, if you did you are not showing the actual results of the method at this point).
Yes, he admits that individually these things don’t actually matter. However, he has found a method to display results that help his cause and reasoning that sounds plausible to those who don’t really understand the issue (like me prior to yesterday). So because they want to attack Wegman and have found some little way to do so, they will insist that the overall effect is what matters, the purpose of the display matters, and that intent behind the display was dishonest.
Just like in the past, Nick has sided with Scientists using the easiest to understand display of a graph as the better use instead of the most accurate because it helped the cause, in this case, it is reversed and he is arguing that the easiest to understand display is misleading and Wegman should have used the most accurate. It’s wrong because it is.
I find it rather ironic that I am being excoriated for using the term ‘fraud’ in the comments to a post by Judith Curry titled “Fraudulent(?) hockey stick.” This is not a singular point of irony. Granted Brandon Shollenberger’s post that I commented on was titled ‘Dishonesty’ – but the post Brandon wrote preceding that was “MICHAEL MANN COMMITTED FRAUD”. Some might call into question our host’s motives in writing about my use of the word in the comments, while neglecting the blog authors to whom I was responding. Especially given my non-entity status, whereas both Judith Curry and Brandon Shollenberger have recognizable names to anyone following the subject matter.
My post at JC’s began:”
It is also instructive to read what I’ve actually written – as opposed to our host’s attempts at mind-reading. When our host writes: “Kevin O’Neill accused the Wegman Report of “real fraud”, citing, as one of his major counts….” Really? I wrote the post and I know that I neither listed them in any particular order nor divided them into categories major, minor or any other categorical description. In fact, as our host probably knows, since he seems familiar with my comments at Brandon’s, I specifically addressed this, writing:
In fact, in my preceding comment I wrote:
I will admit that what was obvious to me apparently isn’t obvious to others. I’m sure part of that is due to writing rushed responses, but as became clear in the comment thread at Brandon’s and as I have tried to make clear at Nick Stoke’s Moyhu, orientation is a clue that Wegman didn’t do due diligence. Referring to Wegman’s Fig 4.4 I wrote:
Now, I may serve as a convenient target of opportunity for our host (i.e., punching down), but let’s be clear that my use of the term ‘fraud’ was in response to authors who had already injudiciously used the term. For, as I have written elsewhere:
KTO
just located this in spam as Carrick suggested to look
See my take on Kevin’s comments (which he kept spamming on different blogs) located here.
I think I was pretty spot on in general, but I retract the statements I made about DeepClimate on that thread. I should have gone back and looked at what DC had to say instead of being flip about it [okay, I was baiting Kevin, but that’s still not a fair thing to do.]
Note that Kevin has re-imagined the sequence of his comments. In his apologia, he says that he presented his list of accusations first, but his comment accusing Wegman of “fraud” and “decepti[on]” had already been posted.
In addition, I do not agree that selecting the (arbitrary) sign of PCs to show them in a consistent orientation was “incompetent”. This was what the NAS panel, the coauthors of Juckes et al 2007 and Mann himself did, as well as Wegman. So if Wegman was “incompetent” for doing this, then Kevin has to explain why the NAS panel was not also incompetent in doing so. Seems to me that Kevin still ends up throwing mud around at.
Question for kevin – do you know anything about the technical subject matter or are you just throwing spitballs and repeating talking points?
PS – I apologize to Kevin for his comment going to spam. I am adamant that people being criticized here have the right to defend themselves.
Steve McIntyre, you’re wrong about Kevin O’Neill re-imagining the sequence. He said:
But that only claims he wrote the list preceding the comment he was discussing just prior to the remark. That is a true statement. It just has no bearing on what he said prior to either comment he quoted.
There’s something I believe to be a far more powerful response. O’Neill says:
This does not fit what he’s said before. One of the two comments from O’Neill I read which led to me responding to him, and eventually writing my post, said:
O’Neill explicitly claimed displaying the graphs with only one orientation was deceptive. There is no way to reconcile that with him now claiming he merely meant to say it was a “clue that Wegman didn’t do due diligence”
Steve, the issue that smacks of a lack of competency is Wegman apparently not understanding how the curve was generated. Certainly his description is wrong. He obviously had access to the code and should have been able to accurately describe it, had he understood fully what the code was doing.
I fully agree that the figure wasn’t explained properly there was a responsibility on Wegman’s part for it to have been. As I’m sure you would agree, recognition of when errors are made is important for making progress in science. I even agree with Kevin that the problems with the wording that accompany this figure demonstrate a lack of due diligence on Wegman’s part.
But I would agree with Brandon that one of the big interests for third parties to this dispute is the brazen double standards being shown This figure is a minor detail at best in the over all story. Had it been explained properly at the beginning, I think it would never have gotten the attention it did.
Kevin,
You say that you have been “excorciared” here but in fact the purpose is to examine your claim of fraud in regard to what you presented as a justification for the term fraud.
Now you seem to be saying that you “threw fraud in there
Because of JC’s injudicious use of the term in her post”
Does this mean that withdraw your assertion of fraud that you made regarding Wegman?
Kevin O’Neill,
You need better reading comprehension skills. You are being “excoriated” not for using the term ‘fraud’ but for using it rather stupidly in an obviously false manner.
On one point I do agree with you- you are a “non-entity” (your terminology), so I am a bit lost at the point of this whole post and why Steve feels it necessary to take down a random, and rather silly, blog commentator. It feels like unnecessary overkill – like opening a tin can with dynamite.
SteveM – Did you not read my comment? Why is it important to point out the use of the word ‘fraud’ in a comment by a non-entity when two of the Blog authors you refer to both used the word in their post titles? Isn’t that a more interesting question than rehashing for the thousandth time the tit-for-tat on M&M or the Wegman Report or the CDSA paper? Unless you’re willing to address why it’s OK for Judith and Brandon to throw around the word ‘fraud’ – but somehow Wegman and the CDSA paper don’t count as real fraud – then I don’t see the point of any further discussion.
BTW, if Wegman had simply reoriented the images for his figure 4.4 for consistency that would be one thing – and defensible. But we KNOW that Wegman in putting together the images for Fig 4.4 *never* had to reorient any of them. So that defense, whether it’s proper, improper, OK with text explaining, etc, etc, ad nauseum is MOOT. Wegman DIDN’T reorient them, he only saw 12 upward sloping images.
Now, what are the odds of that?
I have heard some posters at CA and other blogs asked about the general state of proxies when specific proxies like the Briffa/Schweingruber MXD series with divergence were being discussed. I am plotting all of the 1209 Mann (2008) proxies (originals without infilling) individually and standardized in blocks of 40. I have other graphs showing (a) the #1 and #2 eigenvectors and (b) the #1, #2, #3 and #4 eigenvectors from a singular spectrum analysis (SSA). You can see divergence in a number of the individual proxy series and also note that the frequency domain of these proxies of the same kind and as near neighbors can have very different spectrum patterns.
By using synthetic series with various levels of white noise and autocorrelation the SSA of the eigenvector combinations noted above one can obtain a signature curve shape for proxy series with mainly white noise and no secular trend and those with white and red noise with no secular trend. Further one can use synthetic series to determine the cutoff for a red/white noise combination that makes detection of a secular trend of a given magnitude difficult to impossible to detect with SSA.
I’ll have a link to all these proxy series and the singular spectrum analysis (SSA) discussed above. The question could come back from those not familiar with the individual proxies: What magic was used to obtain a hockey stick from these individual proxy data? You will see many random appearing patterns, note poor correlations among even those proxies that come from the same time period and geographic region, see patterns of white noise and white and red noise with no discernible secular trends and secular trends that peak at random points in the series with no biasing to the modern warming period. Of course, there are 70 historical/instrumental proxies (Luterbacher) which have the modern instrumental record attached to the end that should never be part of a true proxy reconstruction. There are the 105 MXD proxies (Schweingruber) that are truncated at 1960 to avoid dealing with the divergence issue and then the much talked about 4 Tiljander upside down proxies that never should have been used.
The Excel file is about 48 Mb and will take a few minutes to download. It has 5 work sheets.
https://www.dropbox.com/s/9ktq5gsk25jrvlh/mann2008dataoriginal.xlsx?dl=0
I have a comment in moderation for which I see no reason – other than a link to some data and analyses.
Nick Stokes has a new post, “There’s more to life than PC1.” He argues the PCA issue doesn’t matter for MBH’s results by focusing on the difference between centered and de-centered PCA. Strangely, he does this while saying:
If Stokes wants people to not conflate the PC calculation with the reconstruction’s results, I’m not sure why he focuses his discussion entirely upon the PCA issue. It seems he is arguing the old RealClimate position: You can “get” a hockey stick with proper PCA if you include more PCs. He even says:
I submitted a comment pointing out none of this is new. Here’s an excerpt:
This is a minor matter, but since this post is about Kevin O’Neill’s accusations, I have to share something funny from my blog. He had said:
I called this “complete BS” because the NAS using AR(.9) does not mean they showed you have to use AR(.9) to get a set of results. Showing one possibility does not prove it is the only possibility. O’Neill responded by showing the NAS panel used AR(.9), a point which was never in dispute. I explained why he was wrong, and he said:
Where he continued to pretend the use of AR(.9) was the issue. This would be a minor thing not worth commenting except he tried this same argument at Nick Stoke’s blog, and Stokes responded:
It’s amusing to think O’Neill will make arguments even Nick Stokes isn’t willing to try.