CSIRO and Stock Promotions

Here’s another interesting aspect to the exchange between David Stockwell and CSIRO, which provides an interesting example of a promotional press release, that would daunt the most adventurous stock promoter, followed by mealy-mouthed and untrue excuses by the government department.

Again, let’s start with David’s request for data supporting the Australian drought report:

I am interested in obtaining the supplementary information for the Exceptional Circumstances Report. In particular, I would like to obtain the results for the individual 13 models used in the summary tables 4, 7, and 9. If possible, I would like information on the tests that were conducted to determine the statistical significance of projected increases in % area of temperature, rainfall and soil moisture, supporting such statements as follows: http://www.abc.net.au/rural/news/content/200807/s2296263.htm

“A new report is predicting a dramatic loss of soil moisture, increased evaporation and reduced ground water levels across much of Australia’s farming regions, as temperatures begin to rise exponentially.”

CSIRO replied by blaming the media for the reports. But is this transfer of blame appropriate.

Secondly, some of the media reports have misinterpreted the findings of the report. We have little control over this.

Obviously, they could send letters notifying the media of errors. Scientists seem to have been quick enough to object to media interpretations and characterizations that they objected to. So standing idly by when the mischaracterization is on the other side is not an ethically supportable alternative. But did the media even mischaracterize the report?

The release referred to by David Stockwell is here . It says, for example:

The joint CSIRO and Bureau of Meteorology report was commissioned by the Federal Government as part of a review of national drought policy. It says droughts are likely to occur twice as often, cover twice the area and be more severe in key agricultural production areas.

Is this one of the “misinterpretations” of the report in the media? Well, here’s what the government said in its own press release:

Australia could experience drought twice as often and the events will be twice as severe within 20 to 30 years, according to a new Bureau of Meteorology and CSIRO report.

Minister for Agriculture, Fisheries and Forestry Tony Burke today released the report commissioned by the Rudd Government as part of a review of national drought policy.

The news article almost exactly tracks the wording of the government press release. Yes, there are slight differences in the form of expression, but surely this cannot be the “misinterpretation” that is mentioned here.

The article referred to in David’s letter also said:

“A new report is predicting a dramatic loss of soil moisture, increased evaporation and reduced ground water levels across much of Australia’s farming regions, as temperatures begin to rise exponentially.”

Why would they think that? Well, later in the press release, they quote report coauthor, Mark Howden:

Report co-author, the CSIRO’s Dr Mark Howden, says water availability will be affected.

“Soil moisture is a function of how much rain falls, how much water is lost through runoff, evporation and through-flow into the groundwater system,” he says.

“And with increased temperatures, if everything else stays the same, there will be increased evaporation and increased loss of water through that evaporation component, which means less on average for run-off and less on average for putting into the groundwater systems.”

So when Hennessy said that

some of the media reports have misinterpreted the findings of the report

this seems extremely unjustified in relation to the article that David cited. I find it difficult to understand exactly where he thinkgs this article went astray. But if he did, as noted above, CSIRO has an obligation to write the agency and set the record straight about exactly what they think the news agency misinterpreted.

Climate Science behind Kidney Stones and Global Warming

A new study in PNAS links global warming with an increase in cases of nephrolithiasis. From one of the many press releases: UK Telegraph

Researchers say that as temperatures rise, the driest parts of the US could see a 30 per cent increase in kidney stone disease…warmer temperatures could extend America’s existing “kidney stone belt”, an area of the South East where men have been found to be twice as likely to develop kidney stones as in the North East.

Margaret Pearle, professor of urology at U of Texas Southwestern is the third author on the paper (but apparently wrote it) and is quoted,

“This study is one of the first examples of global warming causing a direct medical consequence for humans. When people relocate from areas of moderate temperature to areas with warmer climates, a rapid increase in stone risk has been observed. This has been shown in military deployments to the Middle East for instance.

Eric Berger quotes Dr. Paul Epstein of Harvard Medical School as saying the new study is “an elegant piece of work.” He isn’t kidding.

kidney stone

Image copyright PNAS.

There is little doubt about the relationship between kidney stones and weather/climate. That is not the point of this post, most of us are not urologists and have no interest in making light of a very painful experience. However, what is important to us is just how scientists, who do not do climate science as their day job, approach a problem such as this. What are their data sources, explanations for methodology choices, and justification for conclusions? Moreover, do their methods stand up to the same “rigorous” standards of climate scientists so often discussed here at Climate Audit?

The PNAS paper has a nice (and very short) section dedicated to materials and methods, which I will liberally quote/paraphrase for consumption — just make sure not to dehydrate yourself along the way.
Data

GCM’s have shown an increase of about 1 degree C in Mean Annual Temperature (MAT) over the past 30 years. The UN IPCC AR4 model data is chosen (SRESa1b scenario, 850 ppm by 2100), and the annual MAT across the US was determined from the mean of the 19 IPCC SRESa1b scenario GCMs. The expected rises in midcontinent US MAT are on the order of 4-7°C by 2100.

Mean monthly surface air temperatures (TAS) were computed for each model and regridded to a 0.5°x0.5° mesh over North America. To minimize GCM bias, monthly model increments of TAS (model departure from the mean of 20th-century model, 20c3m, results) were determined, and the annual average increment was calculated for each model. These were downscaled to U.S. climate divisions (1–10 of these per state) by using intersection–area weighting, and future TAS values were computed by adding the increment to observed temperature normals (1895–2006) for each division.

When you have coarse atmospheric datasets like the UN IPCC AR4 data and want to combine them in some sort of bias-corrected weighted mean fashion, regridding to finer resolution would seem to add some unwanted artifacts. But, you may settle for knowing about these 1895-2006 climate normals?

The climate normals represent an instrumental record that is effectively population weighted within each division (weather stations are near people) and therefore most closely indicate the temperature experienced by the population. This can be important in areas with significant topographic relief.

I could not find a reference for the above reasoning. Fortunately, the authors provide an example to clear the fog:

Las Vegas, NV, has an observed divisional normal TAS (mean monthly surface air temperature) of 17.4°C. A direct average of SRESa1b TAS for that division at 2050 predicts an unreasonably low 15.4°C, which reflects an average of mountain and desert temperatures. The 2050 mean TAS increment of 2.8°C added to the normal gives a predicted MAT of 20.2°C, more consistent with expected temperatures in the populated desert valleys in that climate division.

That’s it folks. Somewhere in the middle of the paper, they go into uncertainties (couple token sentences) in the UN IPCC climate models but only to say that the other scenarios, A1B and SRESa2, the warming is even more severe (=kidney stones from the Sixth Circle).

But in the next paragraph, it turns out that the current kidney stone dataset is not so good for a variety of reasons. These include undiagnosed, asymptomatic stones, lack of correct documentation of recurring events, or those who just plain don’t go to the hospital. In fact, there could be up to a 35% error in the baseline prevalence of kidney stone disease! See, reconstructing climate records is nothing compared to ascertaining a census of those suffering of kidney stones.

There are of course countless medical conditions that are related to temperature and climate. If this is the first such study connecting possible medical conditions to potential warming, then it surely won’t be the last. The press coverage throughout the mainstream media and blogosphere is clearly adding well-deserved attention to the plight of stone sufferers, perhaps too much.

PS. The SE United States has actually undergone slight cooling over the past century.

It sounds like Hippocrates was expecting this exact situation to develop when he discussed the ethical practice of medicine. An interpretation of one of the points is highlighted in Wikipedia entry with plenty of irony attached:

I will not use the knife, not even on sufferers from stone, but will withdraw in favor of such men as are engaged in this work. … interpretation … To avoid attempting to do things that other specialists can do better. The “stones” referred to are kidney stones or bladder stones, removal of which was judged too menial for physicians, and therefore was left for barbers (the forerunners of modern surgeons). Surgery was not recognized as a specialty at that time. This sentence is now interpreted as acknowledging that it is impossible for any single physician to maintain expertise in all areas. It also highlights the different historical origins of the surgeon and the physician.

Couldn’t invent a better parallel.

CSIRO adopts Phil Jones’ Stonewall Tactic

David Stockwell has been providing an interesting report at his blog on his efforts to obtain for a recent lurid report on Australian drought, only to be stonewalled on grounds of “Intellectual Property Rights”, a pretext familiar to CA readers.

For a full account, consult David’s always excellent blog. Briefly the new drought report proclaimed:

A new report is predicting a dramatic loss of soil moisture, increased evaporation and reduced ground water levels across much of Australia’s farming regions, as temperatures begin to rise exponentially.

The joint CSIRO and Bureau of Meteorology report was commissioned by the Federal Government as part of a review of national drought policy.

David wrote to the author asking politely for the data:

Dear Kevin, Thank you for your explanation and summary of the results of your significance tests. Sweeping other issues to the side, I would simply like to check the significance of your results of increasing droughts in Australia. To do this I think it would be sufficient to have:

1. The individual 13 values for areal % used to obtain each of the mean and extreme values in tables 4, 7 and 9. 2. The data you used in the significance tests you quote below. Delimited text files are best. 3. A description of the method you used to determine your significance.

I am assuming that the return period is a deterministic function of areal % and so additional tests of significance will be redundant. If not, the respective data for return period would also be of interest.

The results you quote below were interesting and I would like to resolve any conflicting results that arise. I note that your quoted significances reconcile with your claims that “more declarations would be likely, and over larger areas, in the SW, SWWA and Vic&Tas regions, with little detectable change in the other regions.”

Many thanks in advance.

In the most recent episode, CSIRO stated:

I’m not able to hand over the data from the 13 models, due to restrictions on Intellectual Property, but I can describe the methods used to determine statistical significance.

whereupon he gave what seems to be a typically lousy description of the methodology. (I promised Jud Partin not to make sarcastic comments about ‘climate scientists’, but this is getting ridiculous.)

David’s opposite conclusions – but hampered by the inability to consult either the data or a proper exposition of the methodology:

If this is the case, then it is highly likely the confidence intervals were grossly underestimated and so it is also likely that only one or two regions (SWWA) show statistically significant increase in predicted droughts, not 3 or 4 as claimed by the authors. I am more confident in my original assessment that the results show no significant increase in drought due to greenhouse warming in almost all regions of Australia

I wonder whether stonewalling techniques are discussed behind closed doors at Team conferences. [Note to literal minded readers: this sentence is meant sarcastically. I do not think that Monty Python-esque conferences are held in which Team scientists have learned discussions of the latest masonry techniques of FOI legislation. Though I have been told that the issue of CA criticism of failing to archive data has been discussed and Briffa for one decided to stay the course in refusing data.]

We first heard “IPR” as a meme with Phil Jones, now supposedly re-incarnated as the lead author of the PR Challenge, who famously said:

We have 25 or so years invested in the work. Why should I make the data available to you, when your aim is to try and find something wrong with it. There is IPR to consider.

This policy appears to have been adopted by CSIRO as well.

The policy is absurd. If authors want to keep their data private, then don’t publish articles and, especially, don’t issue press releases. If you’re going to publish articles – especially articles the results of which are going to be disseminated to the public, as here – then forget about “IPR” in the data. Let people look at the data. Who knows – maybe they’ll agree.

Briffa et al 2008

Briffa et al (Phil Trans Roy Soc London 2008) is a relatively new emanation from the Team, not previously discussed here, which is another example of the discrepancy between what the Team professes at its PR challenge and what they actually do.

While AGU journals (for example) have a category for “data” papers in which data sets are published, this cannot be said to be a data paper since no data is archived. It discusses 5 data sets (3 familiar to connoisseurs of Team multiproxy studies – Tornetrask, Yamal and Taimyr; and two not “traditionally” incorporated into Team multiproxy studies – Finnish Lapland (Helama et al 2002) and Bol’shoi Avam (Sidorova et al 2007). None of these 5 data sets are archived at ITRDB (or, to my knowledge, elsewhere), other than a very small subset of Tornetrask archived by Schweingruber some years ago. I’ve expressed my frustration on the unavailability of measurement data used over and over again and have tried to have journals require Briffa to disclose data used in his reports, but so far he’s resolutely refused. (Briffa’s typical excuse is that the data belongs to the Russians or some other excuse; as far as I’m concerned, who cares? The journal needs to ensure that he has permission to archive the data before they permit him to publish.)

The criteria for data selection- as so often in Team publications – are nowhere stated. His section 3 is entitled “Selected Eurasian Tree Ring Chronologies”. and merely notes that the paper is about “selected” long chronologies. Why, example, is the Bol’shoi Avam data set merged in with the Taimyr data set, while the Polar Urals update is not merged with the Yamal data set? (Readers of CA know that the Polar Urals update) had a very elevated medieval period.) It would be one thing if Briffa presented arguments why the Polar Urals data was no good, but he doesn’t. So what were Briffa’s selection criteria?

One only has to think of prior statements by Briffa and his PR challenge coauthors to motivate a little concern. PR Challenge coauthor D’Arrigo told an astonished NAS panel that you have to pick cherries if you want to make cherry pie. PR Challenge coauthor, Esper (in Esper et al 2003):

this does not mean that one could not improve a chronology by reducing the number of series used if the purpose of removing samples is to enhance a desired signal. The ability to pick and choose which samples to use is an advantage unique to dendroclimatology.

Indeed. But I, for one, find these little cherry picking exercises increasingly absurd. So why isn’t the Polar Urals update used? For that matter, why isn’t the Indigirka River chronology used? Could its elevated MWP be a factor?

There are typically frustrating inconsistencies between the information on the data sets in the citations and in Briffa’s compilation. For example, Briffa reports that Bol’shoi Avam, citing the very recent Sidorova et al (Russ J Ecol 2007), had 178 samples yeilding a chronology from 851 to 2003. On the other hand, Sidorova et al 2007 states that “a total of 118 samples” were taken, of which 81 were cross-dated yielding a chronology from 886-2003. Is there a typo in Briffa et al or did they use a version different than the one reported in Sidorova et al 2007? Who knows.

While Briffa does not even archive digital versions of his three regional chronologies, his Figure 3 shows that the only series with a strikingly anomalous 20th century is Yamal – which we’ve discussed over and over at this site.

briffa2.gif
Original Caption: Briffa et al 2007 Figure 3. Regional curve standardized (RCS) chronologies (thin lines) and smoothed chronologies, the sum of the first three components of singular spectrum analysis of each RCS chronology (thick lines), for the regions: (a) Fennoscandia, (b) Yamal and (c) Avam–Taimyr. The grey shading represents the changing number of samples that go to make up the chronology through time.

While it becomes difficult to make definitive statements in the absence of proper data archiving, Briffa et al 2007 (which includes Grudd as a coauthor) has a different appearance than Grudd’s 2007-2008 update of Tornetrask, previously discussed at CA here, where Grudd contrasted his present chronology to the Grudd et al 2002 version in the figure shown below.


Original Caption Grudd 2008 Figure 11. In the lower panel (b), Reconstruction IV is compared with two previously published temperature reconstructions based on tree-ring data from Tornetrask: The thin curve is from Briffa et al. (1992) and based on TRW and MXD. The hatched curve is from Grudd et al. (2002) and based on TRW. All three reconstructions have been smoothed with a 100-year spline filter and have a common base period: AD 1951- 1970.

The present Briffa version merges Torntrask with Helama’s (unarchived) Lapland data – is it the merging that causes the difference or is it different handling of the Tornetrask measurement data by Briffa as compared to Grudd? Who knows. No data is archived.

It’s also hard to reconcile Briffa’s Taymyr-Avam composite with prior images. Here is a smoothed version of Briffa’s Taymyr series from Briffa (2000). Briffa et al 2007 shows a relatively more elevated 20th century. Sidorova et al doesn’t show an elevated 20th century. Did Briffa re-calculate the results from Sidorova et al 2007 using his own method of adjusting tree rings? Who knows. No data is archived.

briffa3.gif
briffa4.gif
Taymyr chronology re-calculated in Briffa 2000 (smoothed).

Briffa et al 2007 introduces methodological variations in its handling data that differ somewhat from prior dendro articles. For example, to supposedly provide an “objective picture” of lone time-scale variations, they filtered the three RCS regional chronologies using singular spectrum analysis (SSA) filtering. Later, “in order to assess the changing nature of large-scale average tree-growth variability”, they analyze trends and means from 101-year time windows. Then “in order to quantify the degree of correspondence in tree-growth trend changes on time scales ranging from multi-decadal to centennial, we have compared
the temporal growth patterns across all RCS chronologies using the Kendall’s (1975) concordance coefficient, applied over different moving time windows” etc. If this is a “correct” way to analyze tree ring data, then shouldn’t they publish some sort of methodological package at http://www.r-project.org or the equivalent or otherwise show that these methodological variations have some validity relative to other plausible choices.

“Unprecedented”
There is an interesting bit of sleight-of-hand on the “unprecedented” front. The article abstract states:

Using Kendall’s concordance, we quantify the time-dependent relationship between growth trends of the long chronologies as a group. This provides strong evidence that the extent of recent widespread warming across northwest Eurasia, with respect to 100- to 200-year trends, is unprecedented in the last 2000 years.

But followed by the next odd sentence in the Abstract:

An equivalent analysis of simulated temperatures using the HadCM3 model fails to show a similar increase in concordance expected as a consequence of anthropogenic forcing.

Here’s what’s going on. Here’s the middle panel of Briffa’s Figure 8 showing the “concordance coefficient” reaching supposedly “unprecedented” levels. Note that this figure, which supposedly motivates the caption, does not show “unprcedented” ring widths, but supposedly “unprecedented” concordance coefficients, not something that we’ve heard about previously as a “fingerprint”. This is described as follows:

In the unsmoothed concordance series, except for the shortest (51 years) window results which clearly show high concordance approximately 900, there is evidence of rising and unprecedented similarity in tree growth across northwest Eurasia in the most recent century. This is accentuated in the smoothed series for 101- and 201-year window lengths.

briffa8.jpg
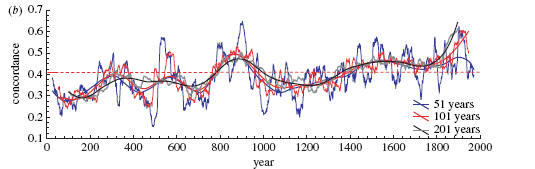
Briffa et al Figure 8. (b) Kendall’s concordance coefficients … for the unfiltered RCS chronologies calculated for moving windows of 51, 101 and 201 years, and the same data smoothed using the negative-exponential weighted least-squares method;

Briffa then discusses whether such concordance results are model “finger prints” reporting that their experiment driven with AGW failed to yield “unprecedented” concordance. Indeed, it barely reached “significant” concordance.

a simple analysis of one such experiment, under natural and GHG forcing for the last 250 years, while showing consistently increasing concordance between simulated temperatures in the regions of our chronologies, failed to produce results that could be distinguished from the results of a similar experiment driven only with natural (i.e. non-anthropogenic) forcings.

The concordance values clearly increase steadily throughout the duration of the all forcings simulation, but the magnitude of the values is low, even by the end of the experiment. Indeed even the maximum concordance values calculated for the series 101-year windows reach only just above 0.3, barely significant, while values approaching 0.4 occur in the naturally forced experiment. These results imply either that an interpretation of strong external forcing of recent widespread high warmth over northern Eurasia, perhaps the consequence of increased atmospheric GHGs, cannot be supported or, alternatively, that this particular GCM simulation of the last 250 years is not consistent with the observational temperature and dendroclimatically implied evidence of unusual warming that has been experienced in the real world.

a simple analysis of one such experiment, under natural and GHG forcing for the last 250 years, while showing consistently increasing concordance between simulated temperatures in the regions of our chronologies, failed to produce results that could be distinguished from the results of a similar experiment driven only with natural (i.e. non-anthropogenic) forcings

How did they go from this statement to the statement in the abstract that:

Kendall’s concordance … provides strong evidence that the extent of recent widespread warming across northwest Eurasia, with respect to 100- to 200-year trends, is unprecedented in the last 2000 years.

Makes no sense whatever. Of course, we’ve already seen Briffa’s Cargo Cult explanation of divergence, so why wouldn’t we expect another cargo cult jump in logic?

Briffa et al. (1998b) discuss various causes for this decline in tree growth parameters, and Vaganov et al. (1999) suggest a role for increasing winter snowfall.” In the absence of a substantiated explanation for the decline, we make the assumption that it is likely to be a response to some kind of recent anthropogenic forcing. On the basis of this assumption, the pre-twentieth century part of the reconstructions can be considered to be free from similar events and thus accurately represent past temperature variability. [Briffa et al. 2002]

As the poets say:

Cherry trees have tasty fruit;
And pickers need dexterity;
But not as much as paleos,
Who claim unprecedentity.

Reference:
Briffa, K.R., T.M. Melvin, E. A. Vaganov, et al. 2008. Trends in recent temperature and radial tree growth spanning 2000 years across northwest Eurasia. Philos Trans Roy Soc Lond B.

PR Challenge: the Briffa-Cook “White Paper”

The Trieste PR Challenge conference has an interesting “White paper on tree rings submitted by Keith Briffa and Ed Cook, entitled “What are the Sources of Uncertainty in the Tree-Ring Data: How can They be Quantified and Represented?

Good questions. I urge readers to read this candid paper in full. I detect a lot of Cook’s influence in this paper – among the senior authors in this field, I find myself placing considerably more weight on Cook’s articles, which are usually pretty thoughtful.

Among their observations:

Low-frequency tree-ring variance [centuries to millennia] is virtually unresolved in all but a few chronologies worldwide. In many multi-century-length series it is undefined or random!

Curve fitting methods suffer from ‘segment length curse’. They can also suffer from “end-effect bias” when recent growth forcing signal is increasing (Melvin and Briffa paper in press). Some methods for processing tree-ring data (Regional Curve Standardisation and Age-Band Decomposition) do preserve more medium and long-timescale evidence of growth forcing changes, but they very prone to bias associated with non-homogenous samples and potential end-effect bias (Briffa and Melvin paper in press).

I like this one:

A fundamental problem is that tree-ring data from a site/region can produce very different chronologies according to specific sampling and processing – this is confusing for secondary users and other non-dendroclimatologists.

Here’s a point about Hansen and similar adjustments, originally raised in connection with the adjustments to the Dawson series used in tree ring calibration – which was actually a departure point for some of my interest in surface station records:

The way in which the climate data [i.e. station temperatures] have been pre-processed (i.e, homogenized) is also an issue that can profoundly affect interpretations of tree-ring data. This makes it doubly hard to identify and assess the signal(s) in the tree rings because it all may not be the tree rings fault!

Now for a real dagger:

There exists very large potential for over-calibration in multiple regressions and in spatial reconstructions, due to numerous chronology predictors (lag variables or networks of chronologies – even when using PC regression techniques). Frequently, the much vaunted ‘verification’ of tree-ring regression equations is of limited rigour, and tells us virtually nothing about the validity of long-timescale climate estimates or those that represent extrapolations beyond the range of calibrated variability.

Using smoothed data from multiple source regions, it is all too easy to calibrate large scale (NH) temperature trends, perhaps by chance alone.

Other comments:

Many chronologies need updating, but existing data sets need additional sampling (especially in ‘proven’ areas) to improve replication and allow improved standardisation methods to be used and enable longer calibration/verification and to explore responses of tree growth to recent climate trends in many areas of the world (i.e. just as stressed by IPCC AR4 Chapter 6).

The ITRDB is a great resource. It needs to be continually improved to allow easy storage of other than “usual” tree-ring width data. Improved meta data should be sought for all submissions, including tree dimensions and architecture and information on context of measurements (routinely including estimates of missing rings to pith). When standardised indices are archived, precise details of standardisation options should always accompany them.

An issue not mentioned at CA but for which I have complete sympathy:

Major crisis looming here are the physical samples. We are loosing the trees. Steady can tell you about his efforts in SE-Asia. In NZ, we have 40,000 year old ancient kauri being mined. I reckon it will be exhausted within 10 years. The holocene sites in 5 years. Saw-millers are already starting to buy farms so that they can secure some future supply. We have set-up an archive at a local museum for biscuits of kauri for future research programs. In other words I have adopted a fire-fighting approach – save as many samples as I can and hope there might be funding to work on them later. Steady has funded me over the last 5 years to collect silver pine (Halocarpus biformis) from the West Cost. We have multi-millennial chronos thanks to that investment – but some sources have been completely destroyed by the land being converted to dairy pastures. The other area is now a kiwi habitat sanctuary so the permit process for further sampling has become much harder. So, data archiving is vital, but I’m first trying to save samples!

Another issue that Pete and I ran into with Graybill in terms of poor archiving of samples, an issue that is under the control of the dendro community and all the more critical if the forests themselves are being lost through reasons out of the control of the dendros:

as old dendrochronologists whither away, their sample collections often disappear with them!

All in all, the Briffa-Cook White Paper reads a bit like a manifesto from Climate Audit. I wonder whether they even intended that this paper circulate to the public – it’s presently online only at the conference center facilities rather than at any of the author’s websites and I wonder whether they realized this.

I’m not even sure what, if anything, I disagree with in this paper. It’s hard to reconcile Briffa’s comments to a private community with his comments to the public in his capacity as the author of the corresponding section of AR4. I guess the problem that they have with Climate Audit is not so much with anything that we say, but that it’s said in public.

The “PR Challenge”

The multiproxy world has been a little quiet since AR4. Eerily quiet. But the Team has plans to liven things up in the June 2008-9 year with plans for a:

Broad announcement of [PR] Challenge to paleo, modeling and statistics communities (e.g., EOS, BAMS, PAGES, CLIVAR, PaleoList, AmStat, EGGS, Nature Reports).

They didn’t mention Climate Audit on their list. But we here at CA are always happy to help the Team. So allow me to notify the CA community that Caspar Ammann and other organizers have announced the Paleoclimate Reconstruction Grand Challenge, which has what appear to be a new website here unveiling its new website here. In theirstatement of goals, the Team stated:

The “PR” component of the name doubles for Public Relations (PR).

Continue reading

Unthreaded #36

Bull dogs have little dogs

Lewis Richardson’s famous 1920 climate science paper ‘The supply of energy from and to Atmospheric Eddies’ was neatly summarized by the poem:

Big whorls have little whorls
That feed on their velocity,
And little whorls have lesser whorls
And so on to viscosity.

Isn’t that a brilliant description of turbulence? So climate scientists have, from time to time, had a nice way with words.

When Tamino announced that he had become Hansen’s bull dog, this little poem came to my mind. The idea of Hansen or Mann, bull dogs themselves, needing their own bull dog seemed redundant. And didn’t Hansen already have his own bull dog, Gavin? (For those in doubt, see how often Gavin has rushed to defend Hansen from any slight.) But redundant or not, it seemed that bull dogs had little dogs.

So here is a modern version of Lewis Richardson’s famous doggerel:

Bull dogs have little dogs
That feed on their ferocity
And little dogs have lesser dogs
And thus to animosity.

Osborn et al 2008 (submitted)

Yesterday, in a passing comment, I mentioned an article by Osborn et al, Annually resolved patterns of summer temperature over the Northern Hemisphere since AD 1400 from a tree-ring-density network, as an example of abuse of terms like “rigorous” or “conservative” to arm-wave through proper methodological description. Here’s an example of their use of “rigorous”:

Such infilling is only accepted if it passes a rigorous verification procedure.

But what is the “rigorous verification procedure”? People in the field – be they editors or reviewers – don’t even notice such sentences. That’s the point of the Riemann Hypothesis article. Imagine the consternation if Li had merely said on page 29 that he used a “rigorous” infilling procedure to go from ideles to adels. He would have been laughed in scorn out of the mathematical community. In the Osborn, Briffa et al case, the exact form of the infilling procedure probably doesn’t even “matter”, but the sloppiness of thought and expression grates on me.

It even happens in Nature. MBH98 itself says, without any editor, reviewer or reader apparently objecting:

[RE} is a quite rigorous measure of the similarity between two variables,

This adjective is applied over and over to the RE statistic [in this case, “over and over” is not merely “countable” but “finite”], but what exactly is a “rigorous” statistic and how do we know this about the RE statistic. If one follows the lengthy discussion of the RE statistic where we’ve been active participants, it’s hard to emerge with a good impression of defenders of the position that an RE statistic above 0.0 demonstrates model validity or of the editorial process acquiescing in things like Wahl and Ammann 2007.

I’m not sure why I picked Osborn et al 2008 as an example for inclusion in my rigorous-robust list. I think that I just remembered that it was a particularly boring article and thus a pretty good candidate for use of robust, conservative, rigorous. (And no, I’m not advocating a general hypothesis of a genetic association between the use of these terms and articles being boring.)

However, after I mentioned it in a comment, I had some second thoughts because I only had a preprint and, thinking about it, I couldn’t remember when it had actually appeared. So I searched for the publication particulars and, at Tim Osborn’s list of publications, located the following under the Submitted category:

Osborn TJ, Briffa KR, Schweingruber FH and Jones PD (2008) Annually resolved patterns of summer temperature over the Northern Hemisphere since AD 1400 from a tree-ring-density network. Submitted to Global and Planetary Change.

For your edification, here is a copy of the title page of the version of this article that I have, dated June 2004. Not that I’m a particular support of Osborn, Briffa et al, but, in fairness, I think that after over 4 years, they are entitled to a reject-or-accept decision from Global and Planetary Change.

submit7.gif

NOAA Response to March 2007 FOI Request

I received the following response today from Tom Karl regarding my 2007 FOI request (See here):

As previously indicated in my e-mail last Thursday, NCDC did indeed put together a response to your official FOIA request, but due to a miscommunication between our office and our headquarters, the response was not submitted to you. I deeply apologize for this oversight, and we have taken measures to ensure this does not happen in the future. Attached for your reference is the actual response to your inquiry that was provided on April 4, 2007. Please let me know if I or my office may assist you further. Thank you.

Sincerely,

Tom Karl

My original request was:

NOAA FOIA 2007-00225

Re: Jones, P.D., P.Y. Groisman, M. Coughlan, N. Plummcr, W.C. Wang and T.R. Karl, 1990, Assessment of urbanization effects in time series of surface air temperature over land, Nature 347,169-172. I

I request the following information in connection with this article co-authored by NCDC scientist Thomas Karl.

A) the identification of the stations used in the following three Jones et al 1990 networks:

1. the west Russian network
2. the Chinese network
3. the Australian network

B) identification of the stations used in the gridded network for comparison

C) the data as used by Jones et al for each of the above stations

Here is their response: Continue reading