Jacoby #1: A "Few Good" Series

Jacoby is on the Hockey Team. His treeline temperature reconstruction was made by picking the 10 most "temperature-influenced" of 36 sites studied. Only these 10 sites were archived. I sought information on the other 26 through Climatic Change, the publishing journal. Jacoby refused, stating:

The inquiry is not asking for the data used in the paper (which is available), they are asking for the data that we did not use.

Imagine this argument in the hands of a drug trial. Let’s suppose that they studied 36 patients and picked the patients with the 10 "best" responses, and then refused to produce data on the other 26 patients on the grounds that they didn’t discuss these other patients in their study. It’s too ridiculous for words. Yet Climatic Change saw no problem with this refusal. Jacoby went on to say that his research was "mission-oriented" and that:

As an ex- marine I refer to the concept of a few good men. A lesser amount of good data is better without a copious amount of poor data stirred in.

Imagine ex-marines with this philosophy in charge of drug trials. Maybe they already are.


Jacoby Response to Data Request

Jacoby and d’Arrigo [Clim. Chg. 1989], together with d’Arrigo and Jacoby [1992], is a temperature reconstruction, which is applied in many multiproxy studies (e.g. Jones et al [1998], 11 series used individually in MBH98, as an "adjustment" to the North American PC1 in MBH99, Jones and Mann [2004]). Jacoby is a member of the Hockey Team.

Jacoby and d’Arrigo [1989] states on page 44 that they sampled 36 northern boreal forest sites within the preceding decade, of which the ten "judged to provide the best record of temperature-influenced tree growth" were selected. No criteria for this judgement are described, and one presumes that they probably picked the 10 most hockey-stick shaped series.

I have done simulations, which indicate that merely selecting the 10 most hockey stick shaped series from 36 red noise series and then averaging them will result in a hockey stick shaped composite, which is more so than the individual series. The process is not dissimilar to what happens in the MBH98 PC1. In the MBH98 PC1, the 14 most hockey stick shaped series account for over 93% of the variance. There is very little difference in appearance between a simple average of these 14 series and the EOF-weighted composite (PC1).

I was interested in testing whether Jacoby’s selection process imparted a bias to the data set under consideration. In order to test whether Jacoby’s selection of the 10 most "temperature-influenced" series had any significance relative to comparable selection from red noise series, I looked for the archived information of the 36 sites. I had previously located the 10 most "temperature-influenced" sites at WDCP archives (and have elsewhere discussed inconsistencies between this archive and the versions used in MBH98), but was unable to locate archived versions of the other 26 series.

As a result of some previous exchanges with Climatic Change (which I will probably discuss on another occasion), they adopted a policy in which authors were required to provide supporting data, but decided not to adopt a policy requiring authors to provide source code. Under this policy, I asked them to obtain the other 26 series from Jacoby (since I had had no success directly).

Jacoby refused to provide the 26 series and I found his reasoning as set out to Climatic Change quite interesting (my bolds).

The inquiry is not asking for the data used in the paper (which is available), they are asking for the data that we did not use. We have received several requests of this sort and I guess it is time to provide a full explanation of our operating system to try to bring the question to closure.

Speaking for myself and immediate colleagues who have been involved with my research: Most of our research has been mission-oriented, dendroclimatic research. That means to find climatically-sensitive, old-aged trees and sample them in order to extend the quantitative record of climatic variations. Also, to relate these records to the real world and investigate the climate system and its functioning.

The first part produces absolutely-dated time series of tree-ring variations. We try to sample trees at sites where there is likely to be a strong climatic signal, usually temperature or precipitation. Sometimes we are successful, sometimes we are not. We compare the tree-ring series to climate records to test what the climate signal is. We sample latitudinal treeline and elevational treeline looking for temperature-sensitive trees with both a high-frequency and low-frequency response to temperature. A high-frequency temperature response to summer is most frequently found at these extreme locations. However, trees have much more information if one finds trees with a good communal high and low frequency variations that correspond or correlate to local or regional temperatures for longer seasons. There is abundant information to explain the physiological processes in cooler seasons and why trees can respond to more than just summer season. The sampling and development of a tree-ring chronology is an investment of research energy, time, and money.

The best efforts in site selection and sampling do not always produce a good chronology. It is only as the samples are processed and analyzed that the quality, or lack thereof becomes evident. First is the dating: this is enabled by high-frequency common variation among the trees. The dating is achieved and tested by various methods. Then the chronology is developed from the correctly dated ring-width measurements and evaluated. Testing: Is there a common low-frequency signal among the trees? At a good temperature- sensitive site with good trees, there is. We conduct common period analyses of the low- frequency variation within the cores samples from a site.

Sometimes, even with our best efforts in the field, there may not be a common low-frequency variation among the cores or trees at a site. This result would mean that the trees are influenced by other factors that interfere with the climate response. There can be fire, insect infestation, wind, or ice storm etc. that disturb the trees. Or there can be ecological factors that influence growth. We try to avoid the problems but sometimes cannot and it is in data processing that the non-climatic disturbances are revealed.

We strive to develop and use the best data possible. The criteria are good common low and high-frequency variation, absence of evidence of disturbance (either observed at the site or in the data), and correspondence or correlation with local or regional temperature. If a chronology does not satisfy these criteria, we do not use it. The quality can be evaluated at various steps in the development process. As we are mission oriented, we do not waste time on further analyses if it is apparent that the resulting chronology would be of inferior quality.

If we get a good climatic story from a chronology, we write a paper using it. That is our funded mission. It does not make sense to expend efforts on marginal or poor data and it is a waste of funding agency and taxpayer dollars. The rejected data are set aside and not archived.

As we progress through the years from one computer medium to another, the unused data may be neglected. Some [researchers] feel that if you gather enough data and n approaches infinity, all noise will cancel out and a true signal will come through. That is not true. I maintain that one should not add data without signal. It only increases error bars and obscures signal.

As an ex- marine I refer to the concept of a few good men.

A lesser amount of good data is better without a copious amount of poor data stirred in. Those who feel that somewhere we have the dead sea scrolls or an apocrypha of good dendroclimatic data that they can discover are doomed to disappointment. There is none. Fifteen years is not a delay. It is a time for poorer quality data to be neglected and not archived. Fortunately our improved skills and experience have brought us to a better recent record than the 10 out of 36. I firmly believe we serve funding agencies and taxpayers better by concentrating on analyses and archiving of good data rather than preservation of poor data.

I guess I won’t be getting the data. It would be my position that, if they picked 10 of 36 sites, they used all 36 sites in their study. Imagine this argument in the hands of a drug trial. Let’s suppose that they studied 36 patients and picked the patients with the 10 best responses, and then refused to produce data on the other 26 patients on the grounds that they didn’t discuss these other patients in their study. It’s too ridiculous.

Bre-X #2: the Skeptical Geologist

Here is an interesting contemporary report from a stock market observer about a Bre-X skeptic:

I

n our Stockex Issue 6/96 of October – November last year we wrote as follows, at about the time Bre-X was being asked to go on a blind date with Barrick.

“Remarkably, given the involvement of groups like Kilborn in the intermediate feasibility study defining proven, probable and possible ore, there are still skeptics out there – on 30.11.96, an anonymous senior geologist in Jakarta was quoted as saying about Busang:"They haven’t proved a thing to me yet." We also recall skeptics of a few months ago who were saying that BreX in some way or another were fudging the assay results; Stockex feels that unless we are looking at the one of the great scams of the 20th Century, can $20 million in exploration costs, 2 years work by 15 geologists and 7 drill rigs, be anything but Kosher?”

It seems there is at least one still anonymous senior sceptical geologist in Jakarta, and all power to him or her if their reservations of October 1996 prove correct. Since the above data were published, Bre-X have gone on to claim anywhere from 70 to 200 million ozs of gold may be present at Busang, and the Indonesian glitterati and power brokers have all scratched and broken their fingernails in getting a seat inside the Aladdin’s Cave that is Busang.

It would indeed be one of the world’s great ironies if this avaricious mob have ended up with 4/5 of 2/3 of stuff-all. (We’ll come to the Canadians later.) By providing some historical overview of Busang and its main players, we can update events to about 7th April 1997. From March 26th 1997, Strathcona Mineral Services were retained by Bre-X to audit both the Bre-X program and the Freeport due diligence programs. It was Strathcona who tapped Chairman David Walsh on the shoulder and told him that there was "strong possibility that the gold resource was overstated because of invalid samples and assaying of those samples."

STOCKEX REPORT 1/9 Pierpont May 1997

Bre-X #1: the March 1997 P.D.A. Convention

In 1996, Bre-X, a speculative exploration company, claimed to have found the biggest gold discovery in the history of the world. At the 1997 Prospectors and Developers Association Convention held between March 10-16, 1997 in Toronto, John Felderhof, Vice President of Bre-X, received an Award as Man of the Year; I’m pretty sure that Michael de Guzman of Bre-X received an award as well. I attended the convention and, in retrospect, the most striking aspect of the award was the tremendous pride that both men took in this recognition by their peers. On March 19, 1997, de Guzman "jumped" from an airplane in Indonesia – a harsh form of peer review. Or maybe he arranged his disappearance. Felderhof had previously re-located to the Cayman Islands, which has no extradition treaties with Canada or the U.S. and is considered unlikely to appear at the various legal proceedings in which he is involved.

Continue reading →

Crowley and Lowery [2000]

Crowley and Lowery [2000] is a key part of the Hockey Team. The data versions used by Crowley were never archived and have now been mis-placed. However, Crowley sent me smoothed and transformed versions of the data in Oct. 2004. The diagram below is a simple color-coded plot of the Crowley data set – illustrating (1) similarity of MWP and 20th century peaks based on the proxy record (without splicing the instrumental record); (2) the hockey stick-ness of the contribution of 4 stereotyped proxies: Briffa’s Polar Urals series, Thompson’s Dunde series and 2 bristlecone pine series. To my knowledge, no one has specifically examined the possibility that a few stereotyped and questionable proxies are the "active ingredients" in all the multiproxy studies. I’ve got some work in hand on this and will post up some comments. Crowley and Lowery [2000] Proxies - Color Coded MORE

4 Crowley Versions

After about 26 emails and about 9 months, in October 2004, Crowley told me that he had "mis-placed" his original data, but did send me a smoothed and transformed version. The version in the email ties to Figure 2 of Crowley and Lowery [2000], but differs from the spliced versions in the spaghetti diagrams of Mann et al. [EOS 2003] and Jones and Mann [2004]. The version in the spaghetti diagram of Briffa et al. [2001] contains an extension from 1983 to 1987, not shown in the original Figure, in which only 2 and then 1 proxy are used.

Although Crowley and Lowery [2000] presented the composite of all 15 proxies, later versions used a 13-site subset, which altered the relation of the MWP and 20th Centuries in the proxy record.

MORE

In my next post, I’ll show the effect of individual proxies in the Crowley reconstruction.

Splicing Temperature and Proxy Records

Mann recently told a realclimate reader that :

No researchers in this field have ever, to our knowledge, "grafted the thermometer record onto" any reconstruction. It is somewhat disappointing to find this specious claim (which we usually find originating from industry-funded climate disinformation websites) appearing in this forum.

Two archived versions of Crowley [2000] contain such splices – one spliced in 1870, one in 1965. Mann et al. [EOS 2003] used the 1870 splice in their spaghetti diagram. Jones and Mann [2004] used the 1965 splice, noting that this replaced an "incorrect version" used in the earlier study.

MORE

The Hockey Team #1

Now it seems that we’re playing against an entire Hockey Team. First things first, what should the team be called: the Kyoto Flames? the IPCC Heat? the Blades? the Fever?

I thought it would be fun to think up lines for the hockey team. I’ve toyed with different ideas. Do you put the grizzled veterans – say, Jacoby and Hughes – on defence. Or do you keep the main lines together – Mann, Bradley and Hughes on one line; Jones, Briffa and Osborn on another? How do you work in the "rookie", Rutherford? Who plays goal? Do you make up a tree ring line? Is Rutherford et al [2005] – coauthors Mann, Bradley, Hughes, Jones, Briffa, Osborn – their power play? What about their uniforms – have they been chosen yet?

I’m a little worried about their skating skills. It looks like Mann can skate backwards, but what about Hughes? So many decisions, so little time.

UPDATE: For a name, how about the "Red Noise". We’re also having some difficult coaching decisions: none of the players want to play right wing.

MORE

A scorecard on MM03

Our analysis in our two recent articles, in GRL and E&E, has moved well beyond the points made in MM03, while building on them. Mann has recently claimed that all of our claims in MM03 have been discredited. I thought it would be interesting to look back at the claims in MM03 and see how they’ve stood up.

Of the 10 claims in MM03, my scorecard indicates that 7 have either been explicitly confirmed or are obviously correct and unrebutted (and in 3 cases, the problems were more pervasive than known at the time of MM03); MBH have withdrawn 1 data set affecting 2 claims (the defects may only apply to the withdrawn data set, but other than mere assertion, there is no proof that the problems did not infect other calculations).

MBH have been required to issue 1 Corrigendum to date, have been required to issue a large new Supplementary Information as a condition of the Corrigendum, have provided the first public notice of a previously undisclosed directory on MBH98 at Mann’s FTP site and are still providing new and additional disclosure on MBH98 methods (even as recently as Nov. 22, 2004).

Contrary to MBH claims, the 10th claim is not discredited in Rutherford et al. [2005], which fails to deal with responses already on the record. More importantly, the 10th claim has led to more advanced (but not inconsistent) considerations of MBH98 through robustness, proxy validity and statistical significance, which have led to the 2 new peer-reviewed articles, MM05 (GRL) and MM05 (E&E).

MORE

The 5 Censored PCs

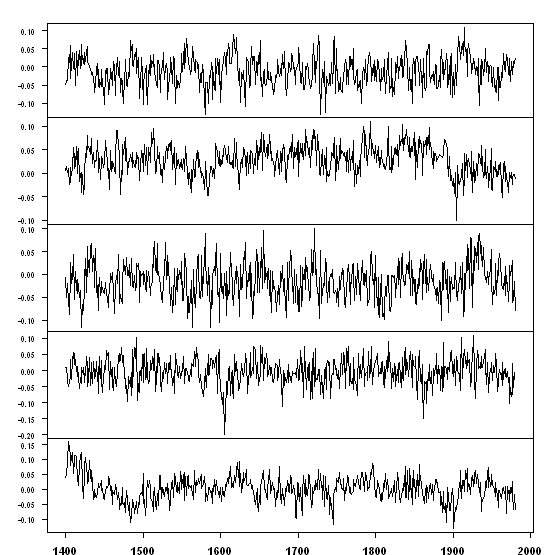
When one contrasts the extraordinary MBH claims of robustness of their reconstruction with the admitted non-robustness of this reconstruction to the PC4 of the North American tree ring network, it is interesting to examine the first 5 PC series in the CENSORED file at Mann’s FTP site. These are plotted in the following figure.
First 5 PCs from Mann's CENSORED Directory

These PC series have been calculated from the 50 non-bristlecone pine series and obviously there is no 20th century hockey stick shaped series among them. These PC series have presumably been calculated with Mann’s flawed PC method, but even this method could not mine a hockey stick shape without the bristlecones. This shows about as vividly as one could imagine that the hockey stick is made out of bristlecone pine.

Cook et al. [2004]

From a recent posting at realclimate:

Their [M&M] second criticism is of the statistic employed by MBH98 as diagnostic of statistical skill, the "Reduction of Error" or "RE" (note that this statistic was favored as a skill diagnostic in prominent recent studies by Cook et al (2004) and Luterbacher et al (2004) in Science)… MM instead promote the use of a simple linear correlation coefficient ("r") in its place.

Obviously we do not such thing. We’ve advocated the use of more than one verification statistic, showing in our GRL article that spuriously high RE statistics can be generated by data mining procedures, such as the erroneous MBH98 PC procedure. What is ironic in Mann’s citation of Cook as authority that paleoclimatologists need not provide a range of verification statistics is that Cook et al. [2004] actually provide a suite of verification statistics, headed by the R2 statistic, which Mann et al. now object to. Cook et al. [2004] states:

The calibration and verification statistics used to assess the goodness-of-fit and validity of the PDSI reconstructions are (i) the calibration period coefficient of multiple determination or regression R2 (CRSQ), (ii) the verification period square of the Pearson correlation coefficient or r2 (VRSQ), (iii) the reduction of error (RE), and (iv) the coefficient of efficiency (CE) …When these statistics are calculated for the 103–grid point West regional average PDSI reconstruction, CRSQ, VRSQ, RE, and CE are 0.86, 0.73, 0.78, and 0.72, respectively, for the most highly replicated post-1800 period of the reconstruction, based on a median of 41 tree-ring predictors per grid point reconstruction, and 0.68, 0.54, 0.64, and 0.53, respectively, when based on the smallest subset of tree-ring predictors available at the start of each grid point reconstruction (a median of 2 per grid point) (fig. S3).

Some online discussion is at the SI to Cook et al. [2004]. In this case, Cook et al. show a higher R2 than RE. This is obviously a completely different situation than MBH98 where there are spuriously high RE values from data mining and insignificant R2 values in the AD1400 step (estimated at about 0.0). A point of follow-up is that Cook et al. [2004] is a study of drought in the U.S. from tree rings. Cook et al. report the use of 835 tree ring chronologies, of which 602 are in the "West". They report the use of 17 chronologies in AD800.

I requested a listing of the sites from Connie Woodhouse of NOAA, one of the co-authors, to try to see if these sites overlapped with the sites used in MBH98 as "temperature" proxies. The map in Figure S2 of the SI sure looks like it overlaps with MBH98. I’m into the typical song-and-dance for the simplest such request. Woodhouse says that I have to get the information from Cook. I’ve had no luck getting data from Cook – I’ve been trying to get their updated Gaspé information (which does not have a hockey stick shape) for nearly a year; they’ve refused to provide. I’ve tried to get the exact location of the Ste Anne River, Gaspé site to commission re-sampling; they’ve refused to provide. I suspect that it will be a long time to get the list of sites in this study.