There’s not much in climate science that annoys me more than the sniveling acquiescence of government bureaucrats in Lonnie Thompson’s flouting of data archiving policies. To his credit, Thompson has collected unique data. To his shame, Thompson has failed to archive data collected as long as 20 years ago. This would be bad enough if the versions were consistent in all publications on Dunde. But Thompson seems to have tinkered with his results over the years so that there has been an accumulation of inconsistent versions, compromising any ability to properly use this unique data. Needless to say, mere compromising of the data hasn’t stopped climate scientists from using Thompson data.
From time to time, as an exercise, I experiment with the different versions of the data, rather like a manuscript scholar looking at variations in medieval copies of ancient manuscripts to try to reconstruct the original manuscript. Today I noticed something odd even for climate “science” data. I had originally picked up this file because I was interested in the impact of consecutive smoothing and scaling of Thompson data in one of the important contributors to the modern proxy canon, the Yang et al 2002 China reconstruction, illlustrated in IPCC AR4 Box 4 below and a component of virtually every reconstruction since Mann and Jones 2003(e.g. Moberg et al 2006, Osborn and Briffa 2006, Hegerl et al 2007, Juckes et al 2007). The IPCC illustration is shown below, with the Yang composite being the maroon series (E Asia) ending at just over 3 sd units.

IPCC AR4 Box 6.4 Figure 1
The Yang series was originally created as a composite of 9 heterogeneous Chines proxy series, two of which were Thompson ice core dO18 (Dunde, Guliya). There are a couple of Yang versions, somewhat differently weighted. While Loehle critics have been quick to (correctly) notice that many contributing series end in mid-20th century, the ending of half the Yang series in mid-century has not been given equal attention. Only 4 of 9 series continue to 1990, of which two are the two Thompson ice cores, which end up dominating the results by the close. The next figure plots the 9 Yang proxy series, together with the composite (also re-scaled), as a spaghetti graph of scaled series. One of the interesting aspects of the re-scaling of the composite (which was done in the IPCC graphic) is that none of the individual components are at 3 sd units at the close. The E China documentary series is only at about 0.5 sd units.
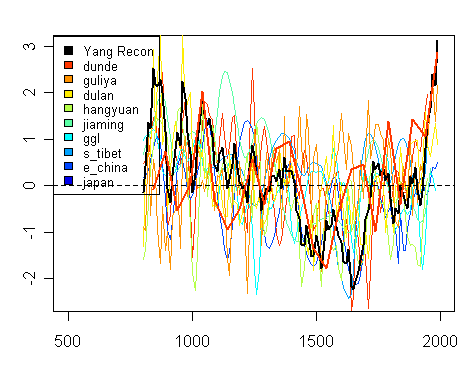
To show a little better detail, here is the 1850-2000 portion of the data blown up. Notice the very high closing value of the re-scaled Dunde series and the great smoothness of the Dunde data used here.

The smoothness of the Dunde data used here contrasts with the smoothness in other data sets – here’s a spaghetti graph that I’ve shown previously. Obviously it’s not that the underlying Dunde data is all that smooth; it’s that Yang et al 2002 has used a “grey” version available in 50 year intervals, the most recent values being …1840, 1890, 1940, 1990. The use of closing values of smoothed series has come up in other contexts – Loehle critics were quick on this issue. Have you noticed these critics being equally attentive to the Yang data? Didn’t think so. If this 50-year version were (absurdly) to be used, then presumably it should end in 1965 rather than 1990, which, by itself, would have a noticeable impact on the closing 1990 uptick of the Yang composite.
Yang’s use of this smoothed 50-year version shows once again the impact of Thompson’s abysmal archiving practices. Had Thompson properly archived his data, then Yang would presumably have used a sensible version of the data.
There are also some interesting statistical issues raised here. Look at what Yang is averaging. The Dunde data has been changed into 50-year averages; other series are at 10-year resolution. Yang converted the smoothed series back to 10-year series – without the original decadal resolution. The scaling process used by Yang (and typical of climate science) made no allowance for the prior smoothing in calculating the standard deviation. Thus the amplitude of the Yang Dunde version ended up being inflated, relative to the other series. The Yang Composite (with inflated contributions of smoothed series), in Briffa’s hands, is once again scaled to unit standard deviation. Again, this is a much smoother series than (say) the West Greenland series and ends up with low-frequency variation being inflated relative to the West Greenland series. Although the Yang Dunde version shown below (purple) looks like it has minimal variation relative to the other versions, this version ends up yielding a 3 sd unit contribution to the IPCC spaghetti graph. Hey, it’s climate “science”.

Figure 3. Dunde Versions.
As I was parsing through this, I thought that it would be interesting to plot the various Thompson versions from annual scale up i.e. first plot only those versions with annual detail, then gradually smooth each one comparing to smoothed versions on an apples-to-apples basis. This resulted in something very unexpected.
First here is a plot of three versions at 3-year smooth (using two annual versions here and one 3-year smooth.) One is a smooth of the grey Dunde version in the MBH98 archive; the other two are digitizations of figures from Yao et al 2006 (Figure 6, Figure 4). The most striking difference is obviously the date of peak 20th century dO!8 values – more on this in the next graph.

In the next graph, I’ve increased the smooth to 5 years, adding in the PNAS version (already in 5-year intervals.) In a scribal sense, the Thompson’s PNAS 2006 version appears to be identical to 5-year averages of the grey data used in MBH98 (with the last few years not used) – confirming that the grey MBH98 version can be treated as the annual version of PNAS data. Unfortunately the Yao et al 2006 version has a different result (and yes, Thompson, is a coauthor of Yao et al 2006 as well.) One version has peak dO18 values in the 1950s and one in the 1930s. So here we have the remarkable spectacle of Thompson publishing different results in the same year (2006). And no one cares. Even though NAS requires data to be archived, Ralph Cicerone, who had personally reviewed Thompson’s article, did not require Thompson to archive the underlying data to reconcile the difference – even after a formal complaint. And climate “scientists” don’t care.

I’ve posted this sort of observation before. Here’s the new point. In the next plot, I went to 10-smoothing, adding in the Climatic Change 2003 version in its original form (10-year averages.) Once again, as you see, the smoothed MBH98 grey version and the PNAS versions track one another relatively closely with the Yao 2006 version being different. The Climatic Change 2003 version is different again – the differences around 1700 are especially noticeable.

You say- well, you’ve already observed that there are different versions, so what? Here’s what intrigued me. The Climatic Change 2003 version is intermediate in date between the similar MBH98 and PNAS 2006 versions. So it doesn’t appear that Thompson has consistently implemented some changes. The 2003 version (Clim Chg) implemented a lot of changes from the 1998 version (MBH grey version), but the 2006 PNAS version seems to have reverted back to the 1998 version, abandoning the 2003 changes. The Yao et al 2006 version looks like it might be related to the 2003 edition, but who can say with certainty?
No composite should be constructed using the 50-year Dunde version. The Yang et al 2002 China composite should not be used – indeed even Phil Jones avoided its use in Jones and Mann 2004. But the strong uptick in the Yang Composite has been too tempting a poison fruit for climate scientists, and has been willing consumed in Moberg et al 2005; Osborn and Briffa 2006; Hegerl et al 2007; Juckes et al 2007 and IPCC AR4.
YAO Tandong, Zexia LI, Lonnie G. THOMPSON, Ellen MOSLEY-THOMPSON, Youqing WANG, Lide TIAN, Ninglian WANG, Keqin DUAN, 2006. d18O records from Tibetan ice cores reveal differences in climatic changes, Annals of Glaciology 43 2006 1-7.




 .
.