Surprisingly, I don’t think that I’ve written previously about the Al Gore Hockey Stick. In Inconvenient Truth, after a segment discussing glaciers, Gore stands in front of a Hockey Stick graph for the last 1000 years and tells his audience that “Dr Thompson’s thermometer” had shown the inconsequentiality of the Medieval Warm Period and, [in the book Nov 13], that “Thompson’s ice core record [was] one of the most definitive” confirmations of Mann’s Hockey Stick. [The text in the book says:]
Lonnie and his team of experts then examine the tiny bubbles of air trapped in the snow in the year that it fell. They can measure how much CO2 was in the Earth’s atmosphere in the past year by year. They can also measure the exact temperature of the atmosphere each year by calculating the ratio of different isotopes of oxygen which provides an ingenious and highly accurate thermometer. The team can count backward in time year by year – the same way an experienced forester can read tree rings – by simply observing the clear line od demarcation that separates each year from the one preceding it as seen in this unique frozen record. The thermometer to the right measures temperature in the Northern Hemisphere over the past 1000 years. The blue is cold and the red is hot. The bottom of the graph marks 1000 years ago and the current era is at the top.
The correlation between temperature and CO2 concentrations over the last 1000 years – as measured by Thompson’s team – is striking. Nonetheless the so-called global warming skeptics often say that global warming is really an illusion reflecting nature’s cyclical fluctuations. To support their view, they frequently refer to the Medieval Warm Period. But as Dr Thompson’s thermometer shows, the vaunted Medieval Warm Period (the third little red blip from the left below) was tiny in comparison to the enormous increases in temperature in the last half-century – the red peaks at the far right of the graph. These global-warming skeptics – a group diminishing almost as rapidly as the mountain glaciers – launched a fierce attack against another measurement of the 1000 year correlation between CO2 and temperature known as the “hockey stick”, a graphic image representing the research of climate scientist Michael Mann and his colleagues. But in fact scientists have confirmed the same basic conclusions in multiple ways with Thompson’s ice core record as one of the most definitive. (AIT, The Book)

Figure 1. Scene from AIT, with Gore standing in front of a hockey stick graph.
[added] The transcript here (and I don’t vouch for the transcript) is a little different than the book, but clearly attributes the graphic here to oxygen isotope calculations from Lonnie Thompson:
The ice has a story to tell and it is worldwide. My friend Lonnie Thompson digs cores in the ice. They dig down and they bring the core drills back up and they look at the ice and they study it. When the snow falls it traps little bubbles of atmosphere. They can go in and measure how much CO2 was in the atmosphere the year that snow fell. Whats even more interesting I think is they can measure the different isotopes of oxygen and figure out the very precise thermometer and tell you what the temperature was the year that bubble was trapped in the snow as it fell.
When I was in Antarctica I saw cores like this and the guy looked at it. He said right here is where the US Congress passed the Clean Air Act. I couldnt believe it but you can see the difference with the naked eye. Just a couple of years after that law was passed, its very clearly distinguishable.
They can count back year by year the same way a forester reads tree rings. You can see each annual layer from the melting and refreezing. They can go back in a lot of these mountain glaciers a thousand years. They constructed a thermometer of the temperature. The blue is cold and the red is warm. I show this for a couple of reasons. Number one the so called skeptics will sometimes say Oh, this whole thing is cyclical phenomenon. There was a medieval warming period after all. Well yeah there was. There it is right there. There are one there and two others. But compared to what is going on now, there is just no comparison. So if you look at a thousand years worth of temperature and compare it to a thousand years of CO2 you can see how closely they fit together. Now, a thousand years of CO2 data in the mountain glacier.
Today I want to spend a little time examining this particular graphic, as it has some intriguing mysteries.
Here is a closer view of Dr Thompson’s Thermometer, as Gore describes it. It starts just after 1000 and, according to the graphic, ends in 2000. It is denominated in deg C. The Medieval Warm Period (not labeled in this version, but labeled in the book) is identified as occurring from about 1360-1370. Another interesting detail is that the resolution of Dr Thompson’s Thermometer appears to increase in the 19th century. In the 12th century, the graph looks like it has decadal values (and this is characteristic of Thompson), but the resolution in the 19th and 20th century is more detailed – this change in resolution within a chart is atypical of Thompson’s usual style. Another interesting aspect of the graphic in the 20th century is that the polygon style shows both positive and negative values simultaneously (indicating some error in the plot coloring algorithm).

Figure 2. Dr Thompson’s Thermometer from Inconvenient Truth. As noted below, the y-axis is labeled incorrectly here, but is corrected in the book. The labels are inverted in the DVD.
Now I’m pretty familiar with Thompson’s work and have discussed it here from time to time – see Thompson category, but I don’t have any idea where Dr Thompson’s Thermometer can be identified in any of his publications. This is not to say that Thompson hasn’t produced graphics that look somewhat like this, but I can’t locate any provenance for Dr Thompson’s Thermometer. (If anyone does know, please tell me and I’ll amend this.) Thompson has published composites of dO18 series standardized to a mean of 0 and standard deviation of 1 (“Z-scores”). In Thompson et al (Clim Chg 2003), Thompson illustrated a “Z-score” composite of 6 cores (3 Andean: Quelccaya, Sajama and Huascaran; 3 Himalayan – Dunde, Guliya, Dasuopu). In Thompson et al (PNAS 2006), a new Z-score composite of 7 cores (adding Puruogangri) was illustrated. The style of the PNAS graphic was quite a bit different. In this case, Thompson archived the plotting data (which are decadal averages, inconsistent with other time series as seen below – and not the same thing as a proper sample archive). However, they do permit the re-plotting of the PNAS version in a style like the AIT graphic, which I’ve done below for comparison.
The grossest features carry forward, but there are some interesting differences in detail, as can be seen by comparing the version below to the AIT version.
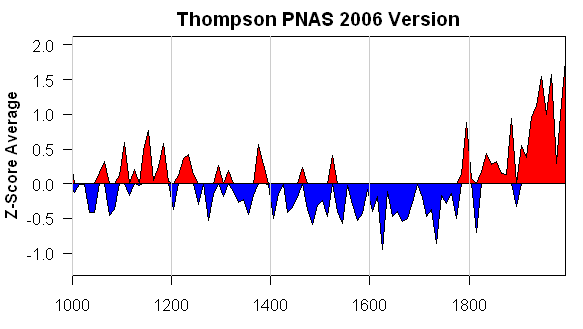
Figure 3. Re-plot of “tropical composite” data used in Thompson et al (PNAS 2006)
The PNAS version is denominated in Z-scores: how did this get converted from Z-scores to deg C? I don’t know. I presume that this is done through variance matching or something like that. But surely the calculation needs more justification than that. The IPCC AR4 stated in respect to dO18 from tropical ice cores:
There are very few strongly temperature-sensitive proxies from tropical latitudes. Stable isotope data from high-elevation ice cores provide long records and have been interpreted in terms of past temperature variability (Thompson, 2000), but recent calibration and modelling studies in South America and southern Tibet (Hoffmann et al., 2003; Vuille and Werner, 2005; Vuille et al., 2005) indicate a dominant sensitivity to precipitation changes, at least on seasonal to decadal time scales, in these regions.
Even Thompson himself (in Thompson et al (Science 2000) stated that the Dasuopu core was a proxy for monsoon intensity:
A high-resolution ice core record from Dasuopu, Tibet, reveals that this site is sensitive to fluctuations in the intensity of the South Asian Monsoon.
So what was the basis for Thompson going from Z-scores to deg C? If it was through some elementary variance matching, to my knowledge (and I’ll amend if I’m wrong) no calculation yielding the curve illustrated in AIT has appeared in any peer reviewed literature.
Secondly, there are many differences in detail. Look at the location of the Gore-“Medieval Warm Period” in AIT – a one decade period around 1360; it appears cold in the PNAS version. In the PNAS version, there are some cold downspikes in the 17th century: where are they in the AIT version. The 11th and 12th century MWP in the PNAS version, while not loud by any means, are considerably attenuated in the AIT version: why? It’s not obvious to me.
Dunde Versions
The idea that there would be inconsistent versions of something from Lonnie Thompson is not something that will surprise previous readers. Here is a collation of different “grey” versions of one of the components in the above graphic (Dunde). Dunde was drilled in 1987 and is a staple of multiproxy studies. It has about 3000 samples containing not just dO18 values but relevant dust and chemistry information. Thompson has refused to archive original sample data. I’ve made many efforts to get this data but have been rebuffed by Thompson himself, the National Science Foundation, Science magazine and the National Academy of Sciences (both in their capacity as publishers of PNAS and in their capacity as organizers of the Surface Temperatures panel). This is important data which cannot be duplicated by third parties – Thompson has an obligation to archive all sample information and NSF and the journals have an obligation to require him to archive it: none of them are living up to these obligations. Maybe Al Gore could ask him.
The results of different Thompson versions of Dunde make a spaghetti graph all by themselves. Note that one version with annual data ends at a very low value. This inconsistency is not isolated to Dunde – as you can see from perusing the posts in the Thompson category.

Dunde Versions. Heavy black – Yao et al 2006 (3 year rolling average); thin black – MBH98 (annual); red – PNAS 2006 (5-year averages); blue – Clim Chg 2003 (10-year averages); purple – Yang et al 2002 (values in 50 -year intervals); green – Crowley and Lowery 2000 (original in standardized format, re-fitted here for display by regression fit to MBH98).
Bona Churchill
In 2002, Thompson took a new ice core at Bona Churchill. We haven’t heard anything about it. On previous occasions, e.g. here , I’ve predicted that 20th century values at this site would be lower than 19th century values – using the mining promotion philosophy that if Thompson had had “good” results, we’d have heard about them. The prediction has a little more teeth than that as dO18 values at nearby Mount Logan obtained and already published by Fisher et al went down in the 20th century. In this case, Fisher et al attributed the decline in dO18 to changes in water source provenance. Fair enough – but how then can one be sure that changes in dO18 in the tropics are evidence of global warming as opposed to changes in precipitation (as argued by Vuille as noted above) or regional precipitation.
And what would have happened to Dr Thompson’s Thermometer if Bona Churchill had been averaged in? And, oh yes, can anyone tell me where I can find a publication of Dr Thompson’s Thermometer as illustrated in AIT?


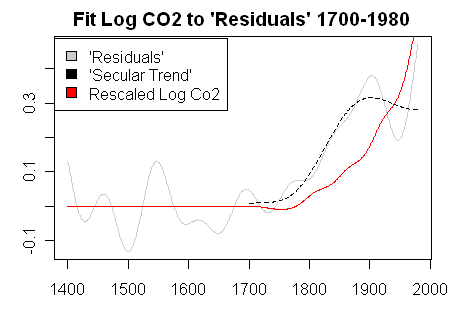
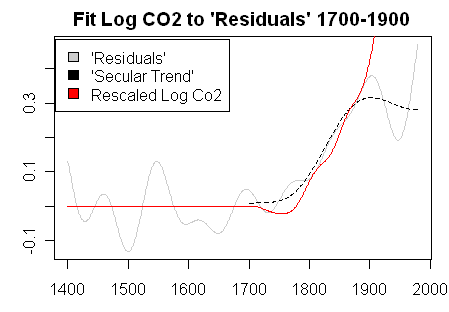
 levels. And in sufficient detail to test my prediction. How do you think that I did on my prediction?