NAS Panel #2: Bristlecones

Readers of this site are familiar with our concern over the use of bristlecones/foxtails in MBH98-99 and other multiproxy studies. The NAS Panel found in one place that "strip-bark samples" (which Graybill sought out in his bristlecone collections) should "not be used". They also reported that the MBH results were "strongly dependent" on "Great Basin data" – code for bristlecones and stated, somewhat inconsistently, that this should be reflected in confidence interval calculations. Because bristleconess/foxtails are used in many other studies (Crowley and Lowery 2000, Esper et al 2002, Cook et al 2004, Rutherford et al 2005, Moberg et al 2005, Osborn and Briffa 2006 and Hegerl et al 2006), this policy on bristlecones will have far-reaching consequences on the "other" studies, as I will demonstrate in due course (in a journal submission.)

For now, I’m going to review discusison of the first part of the issue – the validity of bristlecones as a temperature proxy – leading up to the NAS report. I’ll pick up the issue of the impact on MBH in another post. Continue reading

NAS Panel Excerpts: #1 PCs

When you go through the NAS Panel report closely, it’s amazing how many of our views were adopted – on principal components, statistical skill, statistical methods, bristlecones. I started out trying to make a post showing our views side-by-side with those of of our opponents and those of the NAS Panel, but the post quickly got out of hand in size. I’ll start with biased principal components, not because it’s the most important issue. I don’t think that it is, although it’s got lots of publicity because the effect itself surprised people and it’s technically interesting.

For the purposes of this post, I want to distinguish between the existence of the bias as a mathematical effect and whether the effect "matters". I think that it "matters", but the impact is a different issue than the existence of the effect itself. (I might add here that correlation or covariance PCs are irrelevant to the bias – that correlation and covariance PCs yield different results in the North American network is just an empirical oddity because of low variance in the bristlecones, but I’ll return to that when I discuss the NAS Panel’s view on whether the biased PC method "matters."
Continue reading

Bloomfield and the Mannian Average

In the NAS press conference, Bloomfield said that you could get a Hockey Stick from an average of the proxies. This was a pretty misleading comment. You CAN’T get a HS from averaging the MBH98 proxies. We showed this to the NAS panel on our presentation as follows:

The simple mean of the Mann et al.[1998] data is in the top panel of Figure 2. One notes that the 20th century is unexceptional and, for what it is worth, that there is a downward trend over the 20th century. The final reconstruction, shown in the bottom panel, yields a remarkably different story, in which the historical values were low prior to the 20th century, and the data have a strong upward trend after 1900.


Original Caption: Figure 2: Top — Average of 415 series in MBH98 “dataall” dataset archived in July 2004. Bottom — MBH98 reconstruction.

This idea that you can get a HS by averaging the Mannian proxies seems to be an urban myth among climate scientists. Marcel Crok told me that Nanne Weber of KNMI in Holland told him the same thing.

The only way that you can get a HS by averaging MBH98 proxies is if you previously pick proxies. Arguably a process like this takes place in the “other” studies that don’t use principal components. We’ve never suggested that Mannian principal components, plus partial least squares regression, is the only way to cherry pick data. It’s just a mechanized method of data mining, which has the appearance of objectivity. There’s always the old-fashioned method – pick series with HS by hand. For example, in the North American tree ring network that we’ve discussed so much, the average of the 14 most HS-shaped series (all bristlecones) is pretty much identical to the PC1 (naturally so, since the weights in the first eigenvector essentially wipe out contributions from all other series.)

NAS 1995

Jean S has written me suggesting that I review the NAS panel claim that Mann was the “first systematic, statistically based synthesis of multiple climate proxies”. This claim is true only in the sense that Al Gore invented the Internet and I will discuss this in the next few days.

While I was reviewing the earlier literature, I stumbled across a previous NAS report, which dealt with some of the topics of the present study: Natural Climate Variability on Decade-to-Century Time Scales (1995) available here and here. It reports on a 1992 workshop involving many leading figures with two interesting essays on proxies – one by Jones and Briffa and one by Bradley and Diaz. NAS panelists Gerald North, John Wallace and Robert Dickinson are mentioned as participants.

There are many interesting perspectives on pre-MBH views of what you could do with proxies. Continue reading

Letter to NAS

I want to convey one more time that, while I’m going to criticize the NAS report and in some cases I’m going to be pretty hard on it, I think that they are decent, intelligent and knowledgeable people, who’ve tried to do an honest job and who were civil and fair to Ross and I. While I disagree with many conclusions in the report, there are others that I welcome and which I think will do much to clear the air. Before I get into serious dissection of the report, I sent the following letter today to NAS to ensure that they understood that I’m criticizing the report because I think that it is a valuable and useful report.

Dear Drs North and Cicerone,

I have had a chance to do a first reading of the NAS Panel report and commend both of you as well as the panel members for your roles in a very constructive report.

On a personal basis, I appreciated the cordiality and hospitality shown to Dr McKitrick and myself in our visit to Washington both at the presentation and at the reception and the civility and fairness with which you represented our views on the matters in dispute.

For one reason or another, a type of impasse had been reached in scientific consideration of statistical aspects of millennial paleoclimate studies. I think that the panel will have a definite contribution towards resolving this impasse and has already cleared the air in many contentious areas.

Obviously a report like this will not be the last word in a topic. I agree with many conclusions of the report and disagree with others. I’ve criticized things in the past and will criticize them in the future. However, I definitely plan to apply the report in my own work both in terms of specific findings and for setting directions. Please accept any such future criticisms as recognition of the value of the report, rather than as negatives.

I think that the report will serve its purpose best as a living document. As a suggestion, you might consider convening a workshop or a conference session in which participants and others could respond to the study.

Again, I wish to firmly record the above appreciation and recognition of your efforts.

Yours truly,
Stephen McIntyre

Update: I received the following response almost immediately:

Dear Steve,

Thanks for your kind message. We appreciate your remarks. Please take note that we have proposed a special Union Session at the American Geophysical Union meeting in San Francisco in December to be chaired by several STR Committee members. I would be very pleased if you would submit a paper to this session. The session has not been approved yet, but we hope it will be given enough response in papers submitted. If you go to the AGU web page you can find instructions on how to submit an abstract.

I have not looked at your blog yet, but I look forward to reading a few of your good humored but prickly and challenging jabs.

Best wishes,
Jerry North

For other posts on the NAS Panel from the outset, see NAS Panel category at right.

Some Ice Cores in NAS – Antarctic

Now that I’ve caught my breath a little, just for fun, I’m parsing through sections of the NAS report on areas not directly involving the MM-MBH battle. In the press conference, I recall Cuffey placing a lot of emphasis on the "regional" MWP, and that it wasn’t in the Antarctic ice core data (although it was in Greenland data.) Maybe someone can give a time and reference for what he said and I’ll edit up. In the summary, the panel stated:

This [additional] evidence [of the unique nature of recent warmth in the context of the last one or two millennia] includes …the fact that ice cores from both Greenland and coastal Antarctica show evidence of 20th century warming (whereas only Greenland shows warming during medieval times).

In the Ice Core chapter (preprint p. 62), they said:

Some coastal sites in Antarctica show 20th century warming but interior sites do not. No Antarctic sites show a warming during medieval times.

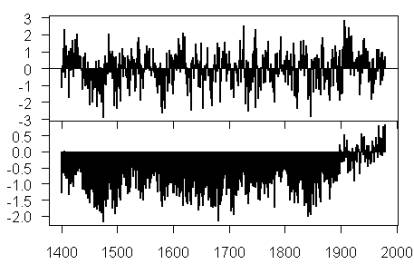
Now I don’t claim to be an authority on ice cores, but here’s the Law Dome dO18 series as illustrated in Jones and Mann 2004, which has a very strong maximum at AD1000, exactly the same time of very active Viking exploration in Greenland. It also has minimal 20th century warming. Isn’t this the exact opposite of the situation as summarized?

Figure 4. Jones and Mann 2004.

The NAS panel does not actually illustrate or cite any series with the said property: modern warming and no medieval warming. Elsewhere in the NAS report, the panel says:

"In Greenland, Figure 6-2, and coastal Antarctica, ice isotopic ratio records clearly show 20th century warming, a Little Ice Age and earlier warmth. In Greenland, this earlier warmth is centered at about AD1000, whereas in Antarctica, it is much earlier … As a group, the ice cores from interior Antarctica (Figure 6-2) show nothing anomalous about the 20th century warming".

They don’t cite the series that are considering here. To the extent that the Law Dome series is representative, the high dO18 period is mostly dated prior to AD1000, but the actual peak is at AD1000. (I also wonder how much play there is in the dating, but that’s a different story.)

In their figure, they illustrated Taylor Dome from interior Antarctica: here is the bottom panel of Figure 6-2 showing information from Taylor Dome – curiously they show dD values rather than dO18 (shown for the other sites) , even though dO18 is available for Taylor Dome. Yes, there is no MWP in Taylor Dome series (and presumably other interior sites), but according to the graph of Taylor Dome (and the NAS text), there is no modern warming reflected in this data either.

NAS Figure 6.2 Bottom Panel. Taylor Dome dD

A comment from Fisher about Greenland Summit gives one theory why there might be less variability at some of the coldest, most remote sites. Fisher noted that the dO18 at Greenland summit did not show marked modern warming or MWP and mooted the possibility that some very remote and very, very cold sites might have little response to lesser changes (think of a LIFO inventory management system) . Maybe this hypothesis applies to the Antarctic interior as well. In the literature, there are suggestions that centennial warming tends to be through poleward movement of mid-latitude systems, with strengthening of polar vortices. Thus mid-latitude warming characteristic of centennial changes might not have a strong impact on the coldest and most remote sites in interior Antarctica.

So what’s the basis for the statements in the summary and for Cuffey’s statements at the press conference? Whatever it is, I can’t find it in the details of the report.

Up-to-Date Proxies: Colorado

Another large batch of tree ring chronologies was archived on June 21, 2006, this time with records up to 2003. Are the results for the 1990s and 2000s off the chart? Continue reading

NAS Ice Core – Dasuopu

If you look at Chapter 6 of NAS, you’ll see heavy reliance on Thompson’s tropical ice cores. There’s much to consider here and this is a very first look. Here’s an interesting statement:

"A quantitative assessment of temperature change from north Tibetan cores [Dunde and Guliya], using typical [whatver that is in tropical ice cores] isotopic sensitivity, is preliminary, but both suggest warming over the last 150 years of at least 1 deg C."

Since Dunde was only drilled in 1987, it is no wonder that the quantitative assessment is only "preliminary". We at climateaudit have also done a "preliminary assessment" using temperature data rather than "typical isotopic sensitivty" and got different results.

Look at Figure 6-1 showing the plots of 6 Thompson cores (Kilimanjaro is not illustrated – anyone want to bet that it doesn’t have an elevated modern dO18 graph? Didn’t think so. I’ve plotted Kilimanjaro last fall,) In the Andes, 2 of the 3 series have higher MWp than modern, but one series, Huascaran, has very elevated values with the rise occurring in the 18th century and continuing to the present. In the Tibetan cores, the only series with a marked modern increase is Dasuopu, but again, the increase seems to occur throughout the millennium. In the original publication, Dasuopu was said to be a precipitation proxy, but is nonetheless averaged with the other series (dare one say because it has HS), yielding an HS Himalyan composite in Figure 6-2 and tropical composite in Figure 6-3. (Also, by the way, the digital versions of the series in Figure 6-1 are archived as a result of my efforts at Climatic Change. Prior to that, nothing had been archived from Dunde in over 17 years and the file is still limited to decadal dO18).

But that’s not the topic here. The NAS panel says that they used the "four available ice cores from Tibet". OK, but there’s an ice core from Mt Everest; yeah, it’s in Nepal but maybe it would be interesting to compare it to Dasuopu, the most southerly Tibetan site. I think that the following plot is interesting on a number of levels. The bottom panel reproduces the archived data from 1000-1997, which is archived only in 10-year steps, showing that the series has HS.

The top panel zooms in on the 1800-2000 period (with a bigger vertical range) and shows the Dasuopu series in black (with a more compressed look due to the change in scale.) The red series is the archived Everest series from Mayewski, only going back to the mid-19th century, but bringing much information for that period.

First, one notices just how much dO18 information is removed by only reporting decadal information. Mayewski has archived annual (and even sub-annual data). Why should Thompson be permitted to archive only 10-year averages. Second, the scale of variation in Thompson’s decadal series is obviously much smaller than the annual ranges, which are very noisy. Third, the series have different appearances on any scale. I haven’t done a correlation, but I’ll bet that the two series, apples and apples, have negligible correlation. The Everest data seems to have maxed in the 1930s (at about the same time as Greenland temperatures, or for that matter, an earlier U.S. temperature peak – to this day, the record USHCN annual temperature is 1934, not 1998).

What does it mean? It sure doesn’t seem very consistent.

Boston Globe (and Filene's Basement)

I had a unique and busy day with reporters yesterday, although I obviously didn’t change anyone’s mind. Boston Globe here and here ,New York Times, USA Today, Greenwire. Ross talked to San Francisco Chronicle. Back to usual today.

When I was checking the Boston Globe, a completely different story caught my eye- the closing of Filene’s. Continue reading

VZG Statement on NAS Panel

Von Storch, Zorita and Gonzalez-Raucen have issued the following statement on the NAS Panel Report (link): Continue reading