This site will have about 72,000 hits in June, up slightly from May. Yesterday, there were most hits (just under 3,000) for a Sunday since the start-up of the site in February. The same may have been true for Saturday as well.
There has been a curious change in browsers. In April, there were more hits from Mozilla Firefox than from Internet Explorer (after very high Mozilla rates in February and March), which surprised me enough to point it out. In June, IE hits are running about 3 times the level of Mozilla hits, so there has obviously been sort of shift in audience, although the level of hits hasn’t changed that much.
For newer readers, you may find it interesting to go back through archives in February and March. Most of the postings are not time-specific and some of the very first posts are still topical. I appreciate the audience.
In 1992, the IPCC issued a Supplementary Report to the 1990 Assessment Report, which visited some of the multiproxy topics in chapter C. Again, I’ll provide some extended excerpts: Continue reading →
Several people have drawn attention to letters from the U.S. House of Representatives Energy and Commerce Committee to Mann, Bradley, Hughes, the director of the U.S. National Science Foundation and the chairman of the IPCC, which were posted up at the Committee website on Friday here.
The letters refer to the Wall Street Journal [this would presumably be the article of Feb. 14, 2005, in which Mann said that he would not be "intimidated" into releasing his algorithm, rather than the recent editorial], as well as to our articles. They have directed Mann, among other things, to produce his source code. In our E&E article, we pointed out several areas, where, in our opinion, MBH98 did not meet "full, true and plain disclosure" standards, which are routinely applied to securities offerings and promotions, e.g. the withholding of R2 and other verification statistics, the impact of the presence/absence of bristlecones (the CENSORED directory), the "editing" and misrepresentation of the Gaspé start date. Questions are asked specifically about these matters.
The questions are focussed on process, with particular emphasis on processes for validation and verification, issues which are obviously of interest to readers of this blog. The letters are well worth taking a look at.
I started off working on a commentary to the WSJ editorial. In doing so, I looked back at IPCC 1990, which is not necessarily handy for most readers, and found myself starting to quote from it so extensively that I’ve simply typed up an extended excerpt, which I’ll use as a source. I’ll make a couple of comments here, but mostly I’ll re-visit it later. Continue reading →
I’ve re-read section 7 of IPCC 1 [1990], which contains the graph used in the WSJ editorial. I highly recommend that everyone interested in this topic take a look at IPCC 1. First of all, here is a scan of Figure 7.1 together with the original caption.
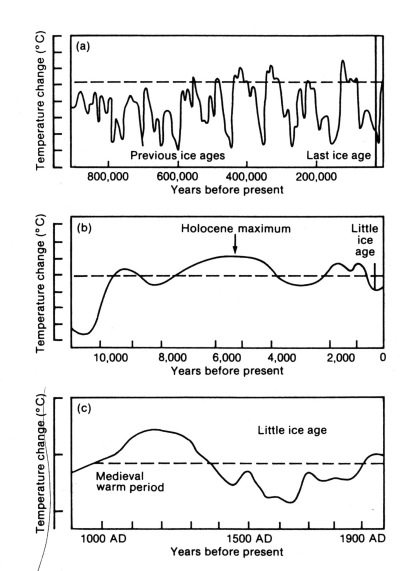
Original Caption: Figure 7.1. Schematic diagrams of global temperature variations since the Pleistocene on three time-scales: (a) the last million years; (b) the last ten thousand years, and (c) the last thousand years. The dotted line nominally represents conditions near the beginning of the twentieth century.
Compare this caption to John Hunter’s recent comment:
” the pre-Mann temperature graphic from the IPCC 1990 report” is, presumably, Figure 7.1 of Section 7.2.1, the caption of which reads: “SCHEMATIC diagrams of local temperature ….". (My [JH] emphases.)
Notice the difference between Hunter’s description and the actual caption: Hunter quotes the caption as "local", while the actual caption is "global". I think that I’ve seen the same mischaracterization elsewhere.
A little while ago, I mentioned here the curious and very large adjustment to 19th century sea surface temperatures based on changing hypotheses about the relative use of wood and canvas buckets. It’s always worth checking whether there’s a hidden agenda for seemingly innocent adjustments. Sometimes my instincts are pretty good. Here’s Figure 3.20 from IPCC SAR [1996] together with the original caption:
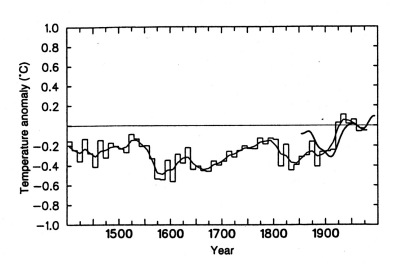
Original Caption: Figure 3.20. Decadal summer temperature index for the Northern Hemisphere, from Bradley and Jones [1993]. up to 1970-1979. The record is based on the average of 16 proxy summer temperature records from North America, Europe and east Asia. The smooth line was created using an approximately 50-year Gaussian filter. Recent instrumental data for Northern Hemisphere summer temperature anomalies (over land and ocean) are also plotted (thick line). The instrumental record is probably biased high in the mid-19th century, because of exposures differing from current techniques (e.g. Parker, 1994b). [my bold]
Here the instrumental record in the 19th century fits sufficiently poorly with the proxy reconstruction that it requires explanation. One wonders whether this might have contributed even a little to the re-tuning of 19th century SST results. Especially when the bucket adjuster (Folland) is closely affiliated with the proxy proponent (Jones, who is also the primary author of the land temperature data set.) The bucket adjuster is then the lead IPCC chapter author (and is still lead author in IPCC TAR), so it’s all pretty incestuous. The "validation" for the various multiproxy studies is claimed because they supposedly track last half 19th century results a little bit. But doesn’t this show at least enough prior tuning to affect cross-validation statistics? The nuance is important: I’m not arguing the adjustments per se (at least for now), but whether the tuning process needs to be considered in defining statistical significance benchmarks.
David Appell has posted up an exchange in Scientific American in response to his hagiography of Michael Mann. Here are some comments on Appell’s points. Continue reading →
As some readers have pointed out, there is a response to the WSJ editorial here.
One point that I’d like to re-iterate for the umpteenth time: our articles have been purely critical; they do not propose any view of climate history. I am intrigued by evidence of past warmth, but have not attempted to argue this position. On the other hand, I do not think that any of the supposed refutations of the existence of the LIA and/or MWP are valid.
This applies not just to Mann’s hockey stick, but to earlier work such as Bradley and Jones [1993] on the LIA or Hughes and Diaz [1994] on the MWP. I have not discussed these works on this site or elsewhere, but I’ve collected nearly all the data pertaining to these studies (which is always time-consuming), studied the articles in detail and find them very unconvincing. If I’m correct in my view that Hughes and Diaz [1994] (for example) does not refute the existence of the MWP, I do not jump to the opposite conclusion, that, ergo, the MWP exists. All it really shows is that the IPCC did not check Hughes and Diaz [1994] either.
As to the supposed impact of new data in changing views, if you actually look at the data used in the Mann hockey stick (or Hughes and Diaz, for that matter), they didn’t use much proxy data that wasn’t available in 1990. Remember that their proxy reconstruction ends in 1980 and we’ve heard this strange excuse from Mann that they must rely on proxy work done in the 1970s because the data has to be obtained in difficult and costly expeditions using "heavy equipment". It seems to me that the changing interpretations owed more to a desire to "get rid of the MWP" (as one climate scientist is reported to have said to Deming) than to any new data.
The Wall Street Journal ran editorial today in which M&M were mentioned. They say:
Mr. Mann has never offered a serious rebuttal to the McIntyre-McKitrick critique. He has refused to fully explain his methodology, claiming he’s the victim of "intimidation." That’s odd when you consider that the sine qua non of real science is independently verifiable and reproducible results.
The WSJ editorial shows the pre-Mann temperature graphic from the IPCC 1990 report. It’s pretty remarkable how seamlessly IPCC went from the 1990 graph to the Mann hockey stick. When you think about it, most of the proxy data used in MBH98-99 (and especially the data that "matters") was already around in 1990.
Update: Here is a link to the editorial.
See link.
A reader of this website recently sent a letter to Canada’s Minister of the Environment, Stéphane Dion, urging him to consider our 2005 articles. I have included here the Minister’s response, in which he states that “many of our arguments have been refuted by by Jones and Mann in their recently published review paper (Review of Geophysics)."
I show here that this paper did not consider any of the major points in our 2005 papers. It could hardly do so as it was not "recently published" in this context, but was accepted almost a year before our 2005 articles (which accordingly were not “pre-butted” or “pre-futed” in Jones and Mann [2004]).
Secondly, I point out that the cited article does not itself "refute" any points; it relies on "findings" from a submission by Mann et al. to Climatic Change; however, this submission was rejected.
Thirdly, I show that the points in the Reviews of Geophysics paper are incorrect — which may be the reason that the Mann et al. submission to Climatic Change was rejected.
Mann has not only failed to report the rejection of the Climatic Change paper, but has stated that they have not had papers rejected (while our submission to Nature was rejected).
Continue reading →


An Exchange at Scientific American
David Appell has posted up an exchange in Scientific American in response to his hagiography of Michael Mann. Here are some comments on Appell’s points. Continue reading →