Here’s something I meant to post up when AR4 came out. I was reminded of this when Rob Wilson posted recently:
Lastly, lets not forget that TR based reconstructions of NH temperatures exist that do not use Bristlecone pine or Foxtail data.
Rob’s point here is very disingenuous (to use Mann-speak) since millennial reconstructions are addicted to bristlecones and foxtails. Reconstructions using them include not just MBH98-99 (which is not robust to the presence/absence as admitted by even Wahl and Ammann); but also Crowley and Lowery 2000 (two bristlecone series, including Almagre); Esper et al 2002 (two foxtail series); Mann and Jones 2003 (Mann’s PC1); Rutherford et al 2005 (Mann’s PC series flagrantly unamended); Moberg et al 2005 (3 bristlecone series); Hegerl et al (Mann’s PC1 and the Esper foxtail average); Osborn and Briffa 2006 (Mann’s PC1 and the Esper foxtail average); Juckes 2007 (the two Esper foxtail series in his Union reconstruction). In each of the studies where Mann’s incorrect PC methodology is not used, there are only a small number of series used (6-18 in the medieval portion). Can a couple of strongly HS series mixed with white or low-order red noise in a CVM procedure yield a HS recon? Readers of this blog know the answer to this, although “professional” climate scientists seem mostly unfamiliar with the statistical issues.
There are only 3 reconstructions in which foxtails and/or bristlecones do not play a role: Jones et al 1998; Briffa 2000; Briffa et al 2001; and D’Arrigo et al 2006. Without the bristlecones, Briffa et al 2001 has a pronounced Divergence Problem and the Team has taken to truncating the record in 1960 (or even in 1940 in Juckes et al). As noted elsewhere, Briffa 2000 and D’Arrigo 2006 have virtually identical medieval rosters and cannot be said to be even somewhat independent in their medieval-modern comparison: in each case, the medieval-modern relationship is changed merely by using the Polar Urals Update (instead of Briffa’s tricky Yamal substitution). In this case, the proxy was updated; the Team didn’t like the answer and so the update was never published as a separate study; they changed the proxy instead. Splicing is the main issue in Jones et al 1998.
Anyway on to the proxies shown in AR4. Here is their Box 6.4 Figure 1. I think that I’ve discussed their proxy spaghetti graph before. It shows 8 series specified only with a rather vague caption – for example, does “W USA” adequately enable a reader to locate a proxy, even if he knows that it was used in one of Mann and Jones (2003), Esper et al. (2002) and Luckman and Wilson (2005)?
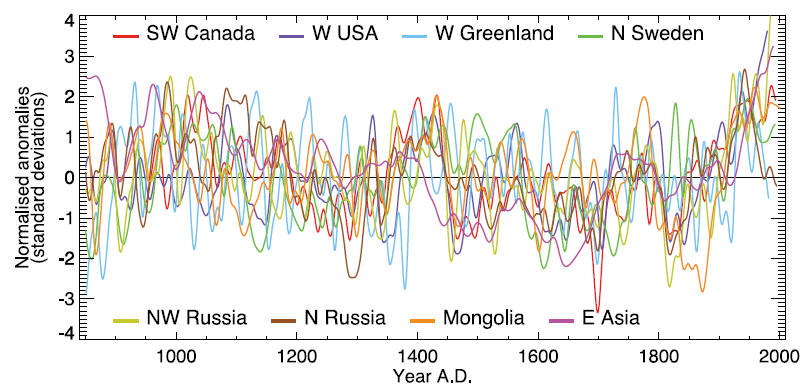
Box 6.4, Figure 1. The heterogeneous nature of climate during the Medieval Warm Period is illustrated by the wide spread of values exhibited by the individual records that have been used to reconstruct NH mean temperature. These consist of individual, or small regional averages of, proxy records collated from those used by Mann and Jones (2003), Esper et al. (2002) and Luckman and Wilson (2005), but exclude shorter series or those with no evidence of sensitivity to local temperature. These records have not been calibrated here, but each has been smoothed with a 20-year filter and scaled to have zero mean and unit standard deviation over the period 1001 to 1980.
Because I know my way around the proxies, I can decode these clues. First, I knew from a previous iteration of the diagram that it’s drawn from the data versions used in Osborn and Briffa 2006 (Briffa is the IPCC lead author here). Here’s my replication of the above figure, which is pretty accurate up to nuances of color palette. In this case, I’ve taken the smoothed version of archived data from Briffa and Osborn 2006 (the smooth said to be a 20-year smooth) and then smoothed it one more time with another 20-year smooth. With only one generation of 20-year smooth, I don’t get as close a match; so it looks like IPCC has done two smooths (and only reported one.) Here is my concordance to known series (from Osborn and Briffa 2006 versions): SW Canada- Luckman-Wilson Jasper/Athabaska/Alberta; W USA- Mann PC1; W Greenland – Fisher dO18; N Sweden – Tornetrask; NW Russia – Yamal; N Russia – Taimyr; Mongolia – Jacoby Sol Dav; E Asia – Yang composite. All of these are typical stereotypes (see for example my predictions for what Hegerl et al 2006 would use or Wegman Figure 5.8).
Note that Mann’s PC1 (shown here in black) is illustrated in IPCC AR4 as large as life, sort of like Chucky – I’m baaaack. Even the explicit statements in the Wegman Report and the NAS Panel that the Mann PC1 was calculated using incorrect and biased methodology was insufficient to kill off Mann’s PC1. Actually, it’s return is not just in AR4; as I’ve noted before, it’s been used more often in multiproxy reconstructions since being discredited (Rutherford et al 2005; Osborn and Briffa 2006; Hegerl et al 2006; Juckes et al 2007) than before. It’s as though the Team has gone pro-Chucky in a seeming show of solidarity against even the NAS and Wegman reports.
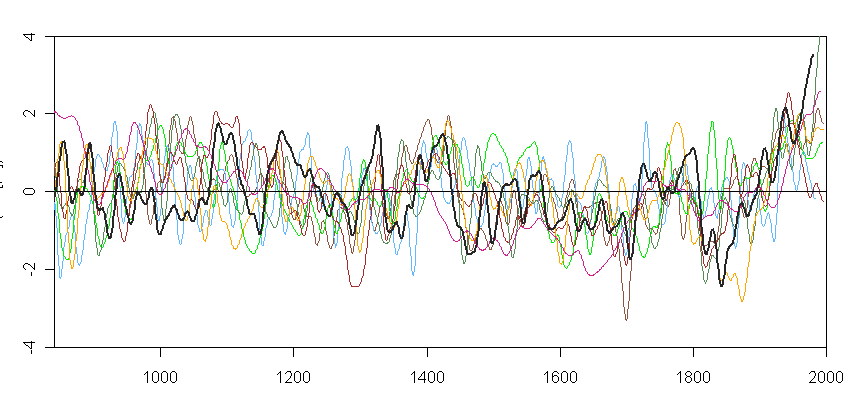
Figure 2. My emulation of IPCC Box 6.4 Figure 1 using Osborn and Briffa 2006 data, smoothed twice with gaussian 20-year filter. Chucky is shown in heavy black.
We all hear about how IPCC reports reflect the views of stadiums full of reviewers. Given that Box 6.4 Figure 1 used Mann’s flawed PC1, do you suppose that multiple reviewers drew this defect to the attention of the section authors? Well, surprise, surprise, only one reviewer actually commented on the Briffa spaghetti graph. You’ll never guess who. And his anti-Chucky comments were disregarded by the Team. Reviewer comments in italics; IPCC response in blockquote; today’s comments in ordinary face.
6-1114 B 0:0 0:0 As a matter of prudence, it seems risky to me for IPCC to permit section lead authors to publicize and rely heavily on their own work, especially when the ink is barely dry on the work. In particular, Osborn and Briffa 2006, which is by one of the section lead authors, was published only in February 2006 and is presented in the Second Order Draft without even being presented in the First Order Draft. Nonetheless, it has been relied on to construct the important Box 6.4 Figure 1. This is risky. Osborn and Briffa 2006 uses some very questionable proxies, including the infamous Mann PC1. I have also been unable to verify some of the claimed correlations to gridcell temperature. One of the authors’ excuses is that they incorrectly cited the HadCRU2 temperature data set, while they actually used the CRUTEM2 data set and that the some of the HadCRU2 data was spurious. This hardly gives grounds for comfort. The point made in Box 6.4 Figure 1 is also argumentative. If the relative warmth of MWP and modern periods is inessential to any conclusions reached by IPCC, I would urge you to delete this Figure and related commentary. [Stephen McIntyre (Reviewers comment ID #: 309-11)]
Noted, MWP figure changed. Although much of the claims in the comment concerning the proxies are not share, we have chosen to change the figure somewhat to reduce reliance on a specific paper.
What did they change? They merely reduced the number of proxies in the spaghetti graph. In what meaningful sense did that “reduce reliance on a specific paper”?
The caption says that Box 6.4 Figure 1 excludes “those with an ambiguous relationship to local temperature”. This is not the case as set out in some following comments. [Stephen McIntyre (Reviewers comment ID #: 309-38)]
See responses in appropriate sections
6-1143 B 29:14 29:14 One of the most prominent series on the right hand side of Box 6.4 Figure 1 is Mann’s PC1, which uses his biased PC methodology. It is so weighted that the series is virtually indistinguishable from the Sheep Mountain bristlecone series discussed in Lamarche, Fritts, Graybill and Rose (1984). These authors compared growth to gridcell temperature and concluded that the bristlecone growth pulse could not be accounted for by temperature, hypothesizing CO2 fertilization. Graybill and Idso (1993) also stated this. One of the MBH coauthors Hughes in Biondi et al 1999 said that bristlecones were not a reliable temperature proxy in the 20th century. IPCC Second Assessment Report expressed cautions about the effect of CO2 fertilization on tree ring proxies, which were not over-ruled in IPCc Third Assessment Report. At a minimum, the relationship is “ambiguous”. In addition, I tested the correlation of this series with HadCRU2 gridcell temperature and obtained a correlation of 0.0. Osborn and Briffa say that they themselves did not verify the temperature relationship for this data. Why not? At any rate, in this example, the authors have not excluded an important series with a well-known “ambiguous” relation to temperature. [Stephen McIntyre (Reviewers comment ID #: 309-39)]
Rejected the purpose of this Figure is to illustrate in a simple fashion, the variability of numerous records that have been used in published reconstructions of large-scale temperature changes. The text is not intended to give a very detailed account of the specific limitations in data or interpretation for each. Furthermore, though there is an ambiguity in the time-dependent strength of the response of Bristlecone Pine trees to temperature variability, there is other evidence that these trees do display a temperature response . Right or wrong, Mann and colleagues do apply an adjustment to the western trees PC1 in their (1999) analysis to account for possible CO2 fertilization. Other authors ( Graumlich et al ., 1991) assert that the recent rise in some high elevation conifers in the western U.S. could be explained as a temperature response (she can not confirm the LaMarche et al findings). The issue is clearly complex , as will be noted in a new paragraph on tree-ring problems that will be added to the text .
How absurd is this response – and see how tricky they are. Here they concede that there is an “ambiguity in the time-dependent strength of the response of Bristlecone Pine trees to temperature variability”. But didn’t they already say that the figure excluded those series with “an ambiguous relationship to local temperature”? They kept Mann’s PC1 in and changed the language: the Second Draft caption said that they excluded “shorter series or those with an ambiguous relationship to local temperature”. They changed this to read “exclude shorter series or those with no evidence of sensitivity to local temperature”. What did they drop from the Second Draft version? Four shorter series used in Osborn and Briffa 2006: Mangazeja, Tirol; van Engeln documentary; Quebec. They dropped two long series: Chesapeake Mg-Ca – used repetitively in the various studies; and the Esper foxtail version. I’ve taken pains in various comments not to limit criticism of bristlecones to CO2 fertilization issues – a point that seems prudent as closer examination of the Almagre data shows that the problem with bristlecones seems to be related to strip bark per se, rather than fertilization.
Graumlich 1991 is a bait-and-switch. Graumlich 1991 did not discuss Mann’s PC1, but other series which did not show a material increase in temperature. Yes, she did criticize CO2 fertilization, but largely on the grounds that she was then unable to discern the rise in ring widths claimed by Graybill in other high-altitude series. (The sites in Graunlich 1991 are unarchived and are different than the archived sites.) Graunlich 1991 also discusses a multiplicative response of foxtails to precipitation as well as temperature, noting that precipitation was the strongest factor.
6-1144 B 29:14 29:14 Another prominent series on the right hand side of Box 6.4 Figure 1 is a foxtail series (which interbreed with bristlecones) from a site within a few tens of miles from the Sheep Mountain bristlecone site. They do not explain why two similar series from so close are used, rather than being composited, if they are to be used at all. I checked the correlation of this data to HadCRU2 gridcell temperature and only obtained an insignificant correlation of 0.04. The authors said that they had cited the temperature data incorrectly, that they had actually used CRUTEM2 yielding a correlation of 0.19 and that HadCRU2 data was spurious in its early portion (1870-1887) because there was no station data. However there is station data at GHCN going back to the data in HadCRU2. D’Arrigo et al 2006 considered using foxtails and rejected the use of this data because it did not meet standards of being correlated to gridcell temperature, expressed in very similar terms to Osborn and Briffa 2006. The contrasting views of D’Arrigo et al 2006 certainly establish that the relationship is “ambiguous” and that this proxy should not be used on multiple grounds. [Stephen McIntyre (Reviewers comment ID #: 309-40)]
See response to comment 6-1143. Some of what the reviewer says may be true, but is as yet unpublished and the current review is based on multiple strands of evidence, among which the results of Mann and colleagues remains relevant.
Jeez, this shows one more time the problems of having lead authors promote their own work. In this case, the explanation came from Osborn and Briffa (recounted previously at CA) and came only after many requests to Sciencemag. Briffa is responsible for his own results and has an obligation not to report misleading results; whether I “published” these particular results is irrelevant to Briffa knowing that the observations were correct – which he more or less concedes – and then ignores.
6-1145 B 29:14 29:14 The beige series which has the strongest closing uptick in Box 6.4 Figure 1 is the Yamal series. When I plotted this series smoothing with a 30-year gaussian filter, I was unable to exactly replicate the uptick shown in this version. I checked the relationship of this series to gridcell temperature and was completely unable to replicate the claimed (0.49) correlation to temperature, obtaining only a correlation of 0.12. The authors here have used data from Yamal, while they used gridcell data from Polar Urals. There is an updated version of the Polar Urals series, used in Esper et al 2002, which has elevated MWP values and which has better correlations to gridcell temperature than the Yamal series. since very different results are obtained from the Yamal and Polar Urals Updated, again the relationship of the Yamal series to local temperature is “ambiguous” [Stephen McIntyre (Reviewers comment ID #: 309-41)
See response to comment 6-1143 and note that the Polar Urals and Yamal series do exhibit a significant relationship with local summer temperature.
6-1150 B 29:23 29:23 The same problems characterize these other studies as Osborn and Briffa. You should say: It is also possible that the proxies are so noisy that very little can be concluded from such graphs. [Stephen McIntyre (Reviewers comment ID #: 309-46)]
Rejected the presentation of data in the Figure in Box 6.4 allows the reader to gauge the hetergeneity of the data and the reference to Figure 6.10 (and text) provides the reader with a realistic interpretation of the analyses of these data.






