A Coarse Fraction Bias in Arabian Sea G Bulloides?

In our recent discussion of the Arabian Sea G Bulloides series, I noticed a remarkable increase in the coarse fraction percentage in the top 1.3 cm of the critical RC2730 core.

Willis has also commented on this. In core 2730, there is a correlation of 0.91 between the fraction of coarse particles and the percentage of G Bulloides.

This raises a couple of interesting questions:

  • Is there some climatic reason for the increase in the percentage of coarse particles at the top of the core?
  • Or alternatively, are there possible non-climatic reasons for the increase in coarse particle percentage?

In either event, does this have any implications for how one interprets percentage G Bulloides series? This leads, as so often, into many interesting byways and the answers are not entirely the ones that one would expect.

Continue reading →

Gerry North Lecture in Boulder, Nov 2, 2007

Gerry North will be back in Boulder on Nov 2, 2007 delivering a lecture at CIRES at 4 pm on climate over the past 1000 years. The announcement says

A variety of evidence points to a gradual cooling of the planet from about 1000 AD to a few hundred years ago when it bottomed out. Over the last one hundred and fifty years the planet has been warming at an unusual if not unprecedented rate. The published evidence caused a groundswell of activity among climate change skeptics culminating in congressional hearings featuring battling assessments. A cadre of skeptics continues to joust at the consensus of scientific assessment that the climate is warming and that its cause is anthropogenic. Climate will continue its course of warming over this century modulated by our choices and the political will to curb greenhouse gases.

“Joust” seems to be the word de jour on the Island.

In addition to the NAS panel report itself, anyone interested in going to the lecture might be interested in a couple of presentations following up on the NAS panel report, discussed last year. Richard Monastersky of the Chronicle wrote an article on the report; he then had an interesting online “colloquy”, at which I asked a couple of questions (Gavin Schmidt also asked a question) – CA discussion

I asked the following question which seems quite prescient in light of our recent study of bristlecones at Almagre:

Question from Stephen McIntyre:
The NRC Panel stated that strip-bark tree forms, such as found in bristlecones and foxtails, should be avoided in temprature reconstructions and that these proxies were used by Mann et al. Did the Panel carry out any due diligence to determine whether these proxies were used in any of the other studies illustrated in the NRC spaghetti graph?

The answer, of course, is that the Panel carried out no such due diligence. In fact, all 4 studies used in their spaghetti graph used bristlecones – indeed 2 of the 4 even used Mann’s PC1. Here’s North’s answer:

Gerald North:
There was much discussion of this matter during our deliberations. We did not dissect each and every study in the report to see which trees were used. The tree ring people are well aware of the problem you bring up. I feel certain that the most recent studies by Cook, d’arrigo and others do take this into account. The strip-bark forms in the bristlecones do seem to be influenced by the recent rise in CO2 and are therefore not suitable for use in the reconstructions over the last 150 years. One reason we place much more reliance on our conclusions about the last 400 years is that we have several other proxies besides tree rings in this period.

If an engineer held this position and then used strip bark forms in a bridge design, he’d lose his licence. But hey, this is climate science.

There is also an online seminar in which North discusses the NAS panel report and the events leading up to it. His comments about me are somewhat schizophrenic – in some places, he talks well of me, and, we’ve got along decently whenever we’ve met and in email; and in other places, he makes quite condescending remarks. He gets a lot of facts wrong – he refers to this blog saying that it was started because we couldn’t get published. Actually the blog started after our GRL and EE2005 articles were published and largely in response to the severe non-peer reviewed criticism being launched against us as a preemptive strike by Michael Mann. This seminar was discussed last year here. Listening to it again, there’s some interesting material that I didn’t note up last year. I described the remarks that really caught my attention as follows:

At minute 55 or so, he describes panel operating procedure by saying that they “didn’t do any research”, that they just “took a look at papers”, that they got 12 “people around the table” and “just kind of winged it.” He said that’s what you do in these sort of expert panels. Obviously I suspected as much, but it’s odd to hear him say it.

When you put that together with their failure to do any due diligence whatever on use of strip bark trees in multiproxy reconstructions, it’s pretty disconcerting. It would be worth asking my colloquy question about strip bark one more time, specifically inquiring about the use by the NAS panel in their spaghetti graph of 4 studies all using strip bark trees and 2 of which used Mann’s PC1, without assessing the impact of the strip bark trees on these reconstructions.

Berkelhammer, Stott and Bristlecone dO18

Max Berkelhammer, a student of Lowell Stott ( a prominent and excellent researcher on ocean sediments) has been carrying out research on dO18 content of bristlecones in the White Mountains. His website shows that he has an article on this research that has been accepted for G3 and CA readers should pay attention to this article when it comes out.

His website has a number of interesting conference presentations on dO18 in bristlecone, from which today’s note is drawn. dO18 levels in White Mt bristlecones changed remarkably at the start of the 20th century.

This is entirely new and important data and their interpretation is highly interesting.

Continue reading →

American Statistical Association Climate Change Workshop, Oct 26-27, 2007

I just learned (too late) about an interesting workshop sponsored by the American Statistical Association this weekend in Boulder.

The announcement last summer stated:

The American Statistical Association (ASA), the nation’s preeminent professional statistical society, today announced it will sponsor a two-day climate change workshop featuring 20–25 leading statisticians and atmospheric scientists. The event, sponsored by the ASA’s Science and Public Affairs Advisory Committee (SPA) and the ASA Section on Statistics and the Environment (ENVR), will take place October 26-27 at the National Center for Atmospheric Research in Boulder, Colorado. David Marker, SPA chair, and Mary Christman, ENVR chair, will facilitate the workshop.
…
Understanding climate change requires the combined skills of atmospheric scientists and statisticians, Marker said. The former understand the physical relationships being investigated, while the latter know how to determine which hypotheses are strongly supported and which are still subject to uncertainty. By bringing together researchers from these two communities, we can identify where there is consensus and where future research needs to focus.

Caspar Ammann was invited, but not me. On the list were Ed Wegman, Gerry North, Doug Nychka.

I wasn’t previously familiar with the ASA section on Statistics and the Environment, but I plan to make some efforts in this direction. Their newsletter from earlier this year had a very interesting account by Richard Smith of North Carolina of a packed session at the 2006 ASA meeting discussing statistics and climate change, to which Wegman, Mike Wallace of the NAS panel and Smith himself spoke. Given the ignoring of Wegman by the climate change community, it’s interesting to read an account of the matter from an eminent statistician, who obviously could not ignore someoone of Wegman’s eminence. It’s also (and unusually) a balanced account which catches many, but not all of the nuances. Smith introduced the session as follows:

“What is the Role of Statistics in Public Policy Debates about Climate Change?” that was organized jointly by Edward Wegman (George Mason University) and myself at the 2006 Joint Statistical Meetings. The session took place in front of a standing-room-only audience and was chaired by Doug Nychka (National Center for Atmospheric Research).

Smith observed:

At the core of the controversy is an incorrect use by Mann et al. of principal components (PCs).

Note that there is no nuance here – Smith agrees with Wegman that the Mann et al method was incorrect. He then considered the argument that the error doesn’t not “matter” together with Wegman’s rebuttal:

A number of other commentators have acknowledged the flaws in the Mann reconstruction but have argued that this does not matter because the answers have been verified by other analyses. Ed’s own response to that was given in the equation:

Method Wrong + Answer Correct = Bad Science.

In other words, the fact that the answer may have been correct does not justify the use of an incorrect method in the first place.

Both Wegman’s talk and Smith’s account of it correctly noted that the issues with Mann et al were not just principal components, observing almost but not quite accurately:

Ed also touched on some of the other controversies in Mann’s work. Some of the proxies had been criticized as inappropriate. For example, bristlecone pines are known to be CO2 fertilized, creating a possible confounding problem if they are used in temperature reconstructionA figure from Mann’s own website suggested that the medieval warm period reappeared if bristlecone pines were excluded from the reconstruction. Other studies had shown a “discomforting array of different results” in the reconstructions obtained with minor methodological variations.

I presume that what was meant here is that Mann’s CENSORED directory (which we deduced contained calculations without bristlecones) did not have a HS shape. Based on our recent sampling in Colorado, it appears that the bristlecone problem may relate more directly to the strip bark phenomenon, as opposed to CO2 fertilization. In our discussion of bristlecones, while we noted that CO2 fertilization had been raised as an issue, we noted that the real issue was the non-robustness to a proxy known to be problematic – and that any use of this proxy as a worldwide thermometer should be preceded by a concerted effort to know everything possible about bristlecone pine growth. Smith then quickly reported on Wallace’s talk. On other occasions, I’ve quoted North’s answer to a question from Barton in which he stated that he agreed with the Wegman report. Wallace said the same thing:

In Mike’s view, the two reports were complementary, and to the extent that they overlapped, the conclusions were quite consistent.

The language in Wegman was much more straightforward, but Wallace’s statement, together with North’s statement, demonstrate that the NAS panel did not disagree with any of Wegman’s clearly stated findings. Wallace also said:

The NRC report reviewed a number of other reconstructions of the temperature record based on proxy observations and believed that the Mann et al. claim that the last two decades were the warmest of the last 1000 years was entirely plausible.

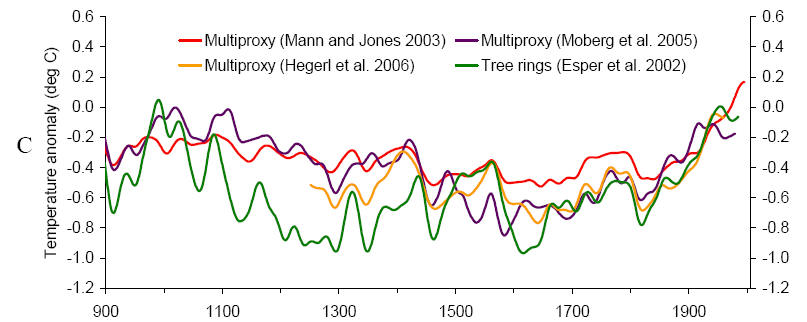
As I’ve observed elsewhere, the “review” carried out by the NRC panel does not seem to have constituted anything more substantive than simply reviewing the literature one more time. The “other” series that they used in their own spaghetti graph all used strip bark bristlecones/foxtails (Mann and Jones 2003; Hegerl et al 2006; Moberg et al 2005; and Esper et al 2002) – see below.
worksh10.jpg
NRC Panel Figure O-5 (C).

It seemed bizarre to me at the time that the panel could recommend that strip bark trees be “avoided” in reconstructions and then use as evidence “supporting” the Mann result reconstructions that used strip bark trees. Worse, two of the 4 studies illustrated here (Mann and Jones 2003; Hegerl et al 2006) actually use the Mann PC1 that had been specifically rejected as incorrect methodology. You have to probe beneath the surface of Hegerl et al to determine that their “W USA” series was really Mann’s PC1, but it was. It still seems bizarre to me that the NRC panel could be so indifferent to performing any due diligence, given their charge. North said in a seminar that they just “winged it”, explaining that’s what you did in these panels. Given the fact that NRC reports are accorded great weight in legal proceedings, it would certainly be more re-assuring if NAS panel chairs at least gave lip service to due diligence requirements, and, even more reassuring, if they actually performed the due diligence that the public presumes that they did.

Smith observed:

while there is undoubtedly scope for statisticians to play a larger role in paleoclimate research, the large investment of time needed to become familiar with the scientific background is likely to deter most statisticians from entering this field.

In the end, it’s important not to lose sight of the forest for the trees, where the “forest” refers to the totality of scientific evidence for global warming.

As someone who’s actually made the “large investment of time” to become intimately familiar with all the proxy issues, you’d think that they might have invited me to this workshop. On the other hand, I’m not a member of the ASA, but it’s probably something that I should belong to. I’ll make an effort to introduce myself to the chairs of the workshop by email and see what happens.

As to the last sentence, I agree that it’s important not to lose sight of the forest for the trees. As a reviewer for AR4, it was my position that, if the paleoclimate issues were not relevant to the policy issues, then the Paleoclimate (and the hockey stick discussion) should be deleted from AR4 so that people could focus on what were the “real” arguments. The IPCC “consensus” was presumably that the paleoclimate arguments remained important and that’s why the chapter remained, despite my suggestions that it be deleted.

He concluded with the announcement of the workshop just held as follows:

Second, there will be an ASA workshop of invited participants whose purpose is to establish “A Statistical Consensus on Global Warming,” organized by Dr. David Marker, Chair of the ASA Science and Public Affairs Advisory Committee, and Dr. Mary Christman, Chair of the ASA Section on Statistics and the Environment, with the sponsorship of the ASA Board and the co-sponsorship of the Section on Statistics and the Environment. This workshop is planned for the fall of 2007 and should deliver its report by early 2008.

Given that the Richard Smith article specifically cites McIntyre and McKitrick in connection with this topic, it does seem peculiar that neither Ross McKitrick nor myself were invited.

The Arabian Splice

One of the reasons why scientists have been so quick to use tree ring information despite all the problems is that, for the most part, there is excellent dating control on tree ring chronologies, something which can be problematic in other proxies.

Today I want to document some notes on dating the Arabian Sea G Bulloides. In this case, although Moberg (and Juckes) present one series in their data sets, this series actually results from a splice of information from two different cores – a splice not actually made by the original authors (although one of their figures is suggestive), but by Moberg. But how legitimate is it to splice the two cores?

Today I’ll look at some potential problems with homogeneity of the splice and also with even dating the cores. Continue reading →

Eli Rabett Explains Why RealClimate Scientists Can't Update the Proxies

realclimate apologist Eli Rabett explained at Tamino why real climate scientists haven’t updated the bristlecones:

You hike out to the ass end of nowhere, take a core (from the right tree, and bring it back. Now you have to analyze it. . . . . .

Sure sounds like a lot of work for a real climate scientist. Also that analysis thingee – that doesn’t sound like something that’s in the job description of a real climate scientist.

Of course, if you don’t want to hike, you can drive to many of the bristlecone sites (though not the foxtails) – which also happen to be in scenic country: at least the Colorado ones were. Yeah, yeah, you burn some fuel driving to the sites, but not as much fuel as going to an international climate conference. I also understand that some of the IPCC delegates were a bit concerned that the food quality at the Ritz Carlton in Paris this year was not up to their expectations.

More on Arabian Sea G. Bulloides

On an earlier occasion, I observed that one of the key Moberg series (and now an essential Juckes series) was the Arabian Sea percentage G. Bulloides series. At the time, I observed that G. Bulloides was an indicator of cold water. In the Arabian Sea, the surface water offshore Oman (where the core used in Moberg was obtained) became much colder during the summer monsoon because of upwelling of deep (cold) water and the percentage of G. Bulloides increased. Here are two graphics from Conan and Brummer 2000 used in my earlier post to illustrate this. Note that these cover only a 210 day period from the start of June to the middle of February. However, one can readily see that high G Bulloides percentages are associated with cold water and low G Bulloides percentages are associated with warm water.


Left: Temperature history; right – percentage G Bulloides.

As an exercise, I manually estimated the temperatures and G Bulloides percentages in the above diagrams and made the scatter plot below for 10 day interpolations, to show the negative relationship between water temperature and G. Bulloides percentages. The trend in the slope is more than a 5% decrease in percentage G Bulloides for each one degree increase in SST.

arabia2.gif
Scatter plot of data from Conan and Brummer 2000 diagrams above.

So how would a proxy for cold water become one of the most important contributors to the Moberg (And Juckes) reconstructions of NH temperature? The shortest answer is that it has a hockey stick shape – indeed, the HS-ness of the proxy was observed in an early publication of this data in which it was actually overlaid against the MBH hockey stick as shown below. (Overpeck, the second author of this article, has been rumored to be the person who told David Deming about “getting rid of the MWP”.)

arabia61.gif
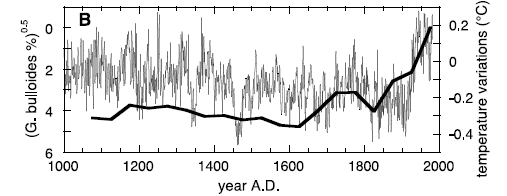
Anderson, Overpeck et al 2002. Fig. 2. (B) Time series of Northern Hemisphere temperature variations from (28 – MBH) (thin line) superimposed on the index linearly related to monsoon wind speed, the square root of the difference in composite G. bulloides abundance with respect to the 1975 average (thick line).

Now there’s nothing intrinsically objectionable about the idea that increased Asian monsoon levels can be associated with higher extratropical NH temperatures and there is certainly evidence in favor of such a hypothesis. If that were the case, then the increased Asian monsoon levels would be associated with upwelling offshore Oman and necessarily colder water in this particular locale. So that would imply that if you looked at SST records from HadSST and NOAA that one would see increased prevalence of cold water in the offshore Oman gridcell. What do you suppose the chances of that would be?

Here are plots of the corresponding gridcell from CRU and NOAA. Naturally, nothing ties together and, indeed, the discrepancies in the graphic merit detailed investigation. Both series show warming water – OK, but how does one explain the supposed increase in G Bulloides percentage. If the proxy is measuring changes in the 20th century, then there should be an increase in cold water because of increased upwelling (and the majority of sediment production is in the cold water season). In addition, the temperature increase at CRU since World War II is nearly half a degree greater than at NOAA – why is that? And what of the very high SSTs prior to World War 2 (there is negligible HadSST data for World War 2)? What does it signify?

arabia4.gif

Ryan Maue's 2007 ACE Estimate

A non-global warming explanation for the lack of moisture/drought in the US Southwest deals with the lack of Hurricane activity in the Eastern Pacific basin. The moisture, upper-level outflow, and accentuation of the monsoon can all be traced back partially to EPAC storms, which are highly sensitive to SST conditions in the equatorial Pacific (ENSO). Simple reanalysis calculations for inactive minus active EPAC seasons shows very significant deficits of monthly mean cloud water, precipitable water, and surface specific humidity (among a host of other variables) for Aug-Sept months over the US Southwest.

This image is constructed as follows: I take the Accumulated Cyclone Energy over the Easter Pacific TC basin for the months of July – September (Oct is usually quiet). I calculate the seasonal deviations from the 1979-2007 mean EPAC ACE — which is fairly bimodal — as one would expect with the sensitivity to ENSO. I then take the active and inactive years (0.5 sigma) and composite the August & September column cloud water (or any other variable) differences (date obtained here from Japanese Reanalysis Project; one could use NCAR/NCEP or ERA40). So, I have 10 years of active and 9 years of inactive ACE years in the EPAC. The following example shows that a greater than 20% difference in cloud water is associated with whatever is concomitant with active vs. inactive EPAC hurricane seasons. This means that a researcher or a responsible journalist would ask: what weather patterns or climate regimes are typically associated with decreased rainfall in the Southwest US, which is a desert, if anyone cared to notice? Instead you get hyperbolic, speculative propaganda about an “upcoming century of fires”.

epac clouds

Despite what Harry Reid says and no matter how hard CNN pushes the Planet in Peril to link global warming to these fires (also NBC, CBS, ABC and the rest of the so-called mainstream media), it is partially the lack of hurricanes that has contributed to the excessive drought conditions — talk about an inconvenient truth. And, by the way, the Northern Hemisphere Tropical Cyclone activity is still on pace to be the weakest since 1977 — Tropical Activity

Strip Bark at Upper Wright Lakes Foxtails

As a sort of Methadone replacement for Mann’s bristlecone PC1 (which uses Graybill’s strip bark chronologies), two Esper foxtail chronologies (Upper Wright Lakes and Boreal Plateau) have come into use by the Team. These two chronologies were used separately in the small Esper network (two of only 7 or so medieval chronologies) making a very distinct impact on the medieval-modern relationship. Subsequently, they were used as an average by Osborn and Briffa 2006 (which also used Mann’s PC1), thereby keeping the bristlecone-foxtail representation on the council at 2 of 12. They were also used as an average in Hegerl et al 2006, which , like Osborn and Briffa, also used Mann’s PC1, keeping the representation of these tees on the council at 2 (of 12, fewer in the MWP). They were used individually in the Juckes et al 2007 Union reconstruction, once again keeping representation on the council at 2 (of 12).

Graumlich herself did not publish a temperature reconstruction from these sites. The Team typically cites Lloyd and Graumlich 1997 as authority, but it doesn’t actually justify the use of these chronologies as a temperature proxy and doesn’t even present the chronologies now used. Lloyd and Graumlich 1997 discuss treeline changes, observing that the medieval treeline was higher than at present. Graumlich 1991 – which IPCC reviewers cited in their “justification” of continuing to use Mann’s PC1 – used nearby (but different) chronologies; she criticized the Lamarche-Graybill CO2 fertilization hypothesis observing that her chronologies did not show the 20th century growth pulse of the Graybill chronologies. After a number of years of effort on my part, some Graumlich foxtail measurement data was archived in May 2007 – a small bit of progress which I noted at the time, The archived information includes the measurements used by Esper (and subsequent Team articles relying on the Esper versions) , but not the earlier information used in Graumlich 1991 (where 20th century growth was said not to be anomalous).

After noticing the remarkable difference in core widths within one strip bark tree in Tree 31 from our drilling at Almagre, I examined the data from Upper Wright Lakes (and Boreal Plateau) and noticed similar divergence between individual cores in some trees where two cores were archived. I sent an email to Andrea Lloyd observing the similarity in pattern in some Upper Wright trees to strip bark Almagre trees and inquired whether the trees at Upper Wright Lakes with similar patterns were also strip barked. I got a very cordial reply in which she said that the hypothesis was “intriguing!”, that she recalled that some trees had strip bark and undertook to examine her notebooks. She has now sent some very interesting fresh information from her notebooks. Pay particular attention to UFA003 and UFA004 below.

On a personal note, and it’s funny how small the world is sometimes, the daughter of one of my best friends is at Middlebury and took classes from Andrea Lloyd as a freshman. She plays hockey for Middlebury BTW. The daughter had previously mentioned to Lloyd that a family friend was involved in hockey stick matters prompting a discussion, so I probably got a little more sympathetic hearing than I’ve received at Tucson. A Middlebury sophomore assisted with our day two coring at Almagre as well. Continue reading →

Melbourne's Historic Weather Station

melbmetrolookingeast.jpg

Until now, most of the surface temperature measurement stations I’ve highlighted as substandard locations for measuring temperature accurately have been in the USA. Today, courtesy of Geoff Sherrington, we are treated to the sight of the main Australian historic site, Melbourne metropolitan, near LaTrobe St, Melbourne. He reports it has max-min temp records daily since 1855 to late 2007.

Yet look at the pictures, this station is only 2 meters from a sidewalk, and a couple of meters more from a major street intersection and voluminous traffic. Hardly the best place to measure temperature. This site demonstrates the growing trend of climate monitoring stations that have been gradually surrounded by increasingly closer urban influences, and demonstrates that the problem is not unique to the USA.

Here are some additional pictures, click for large versions.

melb-latrobe-south-closer.jpg

melblatrobeswasphalt.jpg

And a satellite image of downtown Melbourne showing the intersection is available at Windows Live Maps

UPDATE: Kristen Brynes has offered a couple of photos she had available taken from different angles of the same site, see them below. Thanks Kristen.

melbourneausnw.jpg

melbourneausse.jpg

Additionally, the Lat/Lon of this station is:

-37.8075, 144.9700

A PDF document from Australias BOM lists the METADATA for this site and is available here

Steve: GHCN reference info is

50194868000 MELBOURNE -37.82 144.97 113 29U 2579FLxxCO 5x-9WARM FOR./FIELD C