One of the papers that has most informed my views on multiproxy studies (and I’ve mentioned it from time to time) is Ferson et al. [2003], Understanding Spurious Regressions in Financial Economics which I read a couple of years ago. "Spurious regression" here is a false relationship between series, frequently observed with highly autocorrelated series – random walks are the classic example of Granger and Newbold [1974], but the effect is also observable in finite samples of high-AR1 series. These very high AR1 coefficients are characteristic of both proxies and temperature PC series. Some of the phrases from Ferson should send chills up the spine of anyone relying on multiproxy studies:
Data mining for predictor variables [proxies] interacts with spurious regression bias. The two effects reinforce each other because more highly persistent series are more likely to be found significant in the search for predictor variables. Our simulations suggest that many of the regressions in the literature, based on individual predictor variables, may be spurious…
If the expected return accounts for 1 per cent of the stock return variance, mining among 5 to 10 instruments has as much impact as 50 to 100 instruments with no spurious regression. Assuming we sift through only 10 instruments, all of the regressions from the previous studies in Table I appear consistent with a spurious mining process. The pattern of evidence in the instruments in the literature is similar to what is expected under a spurious mining process with an underlying persistent expected return. In this case, we would expect instruments to arise, then fail to work out of sample.
Continue reading →
I’m inching along with Esper. Here I plot up 10 of 14 sites – I’m pretty sure that most will correspond fairly closely to Esper versions (up to the undefined distinction between “linear” and “nonlinear” cores). For 20th century levels to exceed 11th century levels, the “active ingredients” in Esper seem to be the 2 foxtail (~bristlecone) sites and Jacoby’s Mongolia series. Continue reading →
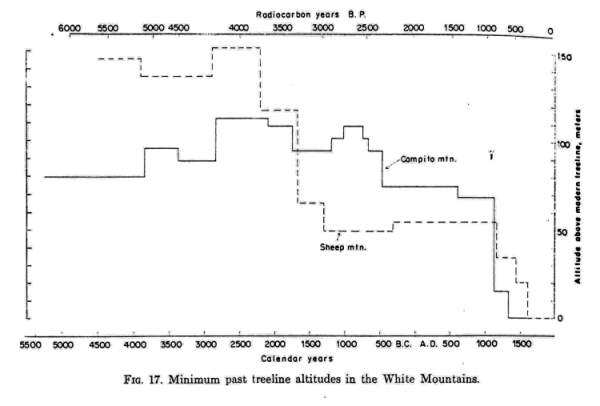
Here is Lamarche’s diagram of altitudes at the key bristlecone sites of Sheep Mountain and Campito Mountain (as noted below, when wood erosion is allosed for, the post-MWP decline is placed after 1500.)
 Continue reading →
Valmore Lamarche was perhaps the first person to suggest that temperature information could be extracted from bristlecone pine information and his early publications are often referenced. Lamarche et al. [1984] (with Fritts, Graybill and Rose) first postulated CO2 fertilization. As you know, I’m increasingly interested in changes in treeline elevation as a "low-frequency proxy". It turns out that Lamarche was as well. Lamarche [1973] contains an analysis of Holocene treeline variations at the key bristlecone sites of Sheep Mountain and Campito Mountain. Continue reading →
An Op Ed by David Legates of the University of Delaware in today’s National Post, entitled
Where’s the data?: Holding science to prospectus standards would stop climate researchers from launching misrepresentations like the ‘Hockey Stick’ By: David Legates
Continue reading →
Since I showed the effect of smoothing on the relationship of Dunde to temperature, I thought that it would be useful to post up a table showing the Jones et al [1998] proxy correlations to temperature versus my calculations using HadCRU2. Continue reading →
Thompson’s Dunde ice core is an extremely important proxy in multiproxy studies. There has been an increase in dO18 levels in the 20th century. Whether this is a proxy for temperature is not at all obvious on physical grounds. The relationship between dO18 and temperature in monsoon ice caps is opposite to that of polar regions ” the lowest dO18 occurs in summer rather than in winter. Thus, a greater proportion of summer precipitation on the ice cap would cause lower dO18. The supposed connection between increased 20th century dO18 and temperature is entirely statistical. Thompson et al [1993] says:
The 5-year running means of dO18 from the Dunde Ice Cap are compared in Figure 5 with 5-year running means of Northern Hemisphere temperatures (Hansen and Lebedeff, 1987). For the period from 1895 to 1985, the correlation coefficient r is 0.5 (significant at the 99.9% level). This correlation suggests that the Dunde Ice Cap dO18 should serve as a good proxy for larger-scale temperature variations.
I’ve been meaning to check this for a while as it only takes a few minutes to do. Continue reading →
I’m asked from time to time for references on statistics. I’m going to start posting up some links and references in a Page (see right frame). Here’s one that I noticed which is both an excellent introduction to R and to statistics. John Verzani, Using R for Introductory Statistics The nice thing about R packages is that you can results almost instantaneously and get a feel for what’s going on. Then you’ve got some motivation for the theoretical aspects. Unfortunately, things are usually taught the other wat around. R texts have a style that I really like – with the text often being a running comentary on the programming, with actual program lines being shown in the text.
Another package that I noticed and looks nice: Grant Farnsworth, Econometrics in R, Econometrics has been far more attentive to autocorrelation issues than paleoclimate, but the data issues have a lot in common.
Esper uses 14 sites in his reconstructions. My objective is to see which ones are "active ingredients" in yielding a high 20th century relative to MWP. Today, I’ll look at the "Quebec" site on the east side of Hudson Bay, which does not solve the problem. In fact, the acknowledged authors report of a site on the east coast of Hudson Bay where no trees are presently growing that:
"The northernmost postfire regeneration during the 20th century occurred about 130 km south of the study area [Payette et al 1989b]. This suggests, on the basis of the difference of the current annual temperature between the two locations, that the Medieval Warm Period was ~1 degree C warmer than the 20th century."
So this site – whichever it is- doesn’t look it’s an "active ingredient" in showing an exceptionally warm 20th century. Continue reading →
Huybers’ second and more interesting (to me) issue pertains to the benchmarking of the RE statistic.I’m going to start in the middle of this issue. If I start with the history e.g. defining the RE statistic and showing its history (and I just tried), it’s hard to get to the punch line. So what I’m going to do is start with the punch line with minimal history and then go back and put the information into some context. Continue reading →






Legates Op Ed
An Op Ed by David Legates of the University of Delaware in today’s National Post, entitled
Continue reading →