Quelccaya accumulation are 2 of only 14 proxies in MBH99. I think that it was the very first Mann proxy series that I posted about (circa May 2003), as the underlying data looked very strange when plotted. Hans Erren has posted up an interesting analysis which both explains the strange appearance of the series as an aliasing effect and Thompson never digitized key aspects of the underlying data set and has no plans to do so. I’ve mentioned elsewhere that Thompson has distributed 3 different and inconsistent versions of the Dunde data and has not archived original data for Dunde, Guliya and Dasuopu. Someone really needs to tie strings to the mittens of the Hockey Team.
See here. Aliasing artifact illustrated as follows:

There’s a combined discusison of MM05 (GRL) and MàÆàⵢerg et al [2005] in tomorrow’s Science, together with a new spaghetti diagram that differs from the MàÆàⵢerg rendering of proxy data a few posts ago.
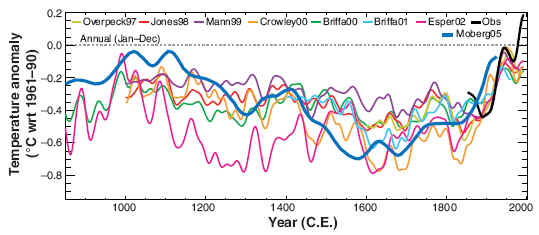
Figure 1. Spaghetti Diagram, Kerr, Science Continue reading →
I wasn’t sure whether there would be any interest in these comments, although M&M is getting quite a bit of publicity right now. Yesterday this site got 1426 hits from 819 users – so I guess I’ll keep blogging for a while anyway.
M&M got a couple of references in major publications this week . There was a short reference in the Economist. In Nature yesterday, MM05 (GRL) is cited in "Past climate comes into focus" as follows:
The hockey-stick reconstruction was derived in 1998 by Michael Mann, a climate researcher now at the University of Virginia in Charlottesville. A small group of critics, including Stephen McIntyre, a Toronto-based mineral-exploitation consultant, has since attempted to prove that the graph isbased on insufficient data and on flawed statistics.Although McIntyre’s work is controversial, a recent reanalysis by von Storch partly supports his view. And, in hindsight, many climate researchers believe that it was premature of the IPCC to give the visually suggestive curve so much prominence.
I’m not a mineral-"exploitation" consultant by the way. I’ve mostly worked for the past 20 years in organizing and financing mineral exploration. Right now, I’m doing climate research full-time. Contrary to preconceptions, I don’t get paid to do this. I have no economic interest in this; it costs me money to do it and there is a significant opportunity cost since I could be doing other things. But I’m having fun doing it and plan to do it for a while.
I’ve collated public versions of Moberg data to the extent possible and have posted up some comments from a first inspection of the data, including the apparent avoiding of ice core dO18 series, prominent in Hockey Team studies. I’ll post up a script collating the data into R if anyone’s interested. Moberg doesn’t directly use any dO18 ice core series (either from Thompson or anyone else).
Thompson’s dO18 series are a staple of Hockey Team multiproxy studies. The tropical ice core dO18 series have struck me as highly problematic: the lowest dO18 is in the summer; the highest in the winter. This is the opposite of what one would expect from dO18-temperature relationships. The reason is that summer dO18 comes from monsoon rainout. If you have a change in annual dO18, you can’t tell whether it’s from a change in summer-winter proportions or a change in annual temperature. Thompson simply arm-waves through this problem. Moberg seems to avoid Thompson series. A couple sneak in through the back door – Moberg uses Yang’s temperature reconstruction (#10), where Thompson data is included, but the effect of Thompson data is much attenuated in Moberg relative to the Hockey Team.
Continue reading →
If you google "moberg climate" under News, you get the Nature announcement – but look at the announcement and the avatar:
 Past climate comes into focus but warm forecast stays put Nature.com, UK – 4 hours ago – Fluctuations in global temperature during the past millennium may have been larger and more frequent than previously thought, says a fresh analysis of …
Pretty cheeky to use the MBH graphic for Moberg’s results.
Moberg et al. [2005] was published today in Nature. It is an almost unique study because none of the authors are on the Hockey Team (although Moberg has co-authored with Jones in the past) and is virtually the first somewhat independent multiproxy study. The figures in the study are small-scale and the instrumental record is overlaid as usual to lessen the impact of these results. But look at the following Supplementary Figure from the SI:

Fig. S3. Uncalibrated low-frequency component of the reconstruction (red) with its jack-knifed estimates (blue) and associated 95% confidence interval for the mean (yellow). See Supplementary Methods 1 for detailed explanation.
I’m in the process of looking through the SI and will comment more later.
We have focused considerable attention on the role of the Gaspé series in MBH98. While we alluded previously in MM05 (E&E) to information in our possession that the updated (1991) version of the series differed from the 1982 version and to our frustration that the updated version remains unarchived (see Jacoby #1) , we are now able for the first time to show the updated Gaspé site chronology and perhaps add additional flavor to our concerns over the impact of the use of the obsolete version.
 Continue reading →
I’ve heard rumors that a new reconstruction from Moberg et al. is about to be published in Nature and it looks like it’s going to be more bad news for Mann et al. Here is a clip from a PDF posted up by Moberg in October 2004, but obviously not incorporated into the spaghetti diagrams of Mann, Briffa etc. It sure looks like a MWP and LIA to me.

The articles that were cited earlier, have now gone into the National Post archive (where you have to pay to read them). However, the pdf for the English version of the Dutch article in Natuurwetenschap & Techniek (which is virtually identical to the National Post version) is at Ross McKitrick’s site at this link .
Here’s a choice quote from the article that caused me to fall from my chair (my emphasis in bold):
"McIntyre and McKitrick went back to the source of the Gaspé series and then to the archived data at the World Data Center for Paleoclimatology. "We found that although the Gaspé series begins in 1404, up until 1421, it is based on only one tree. Dendrochronologists (tree ring researchers) generally do not use data based on one or two trees. The original authors only used this series from the 1600s onwards in their own temperature reconstructions. This series should never have been used for the 15th Century, let alone counted twice and extrapolated"
I check with Steve McIntyre – yes, it’s true. I then find out that from 1421 to the 1450s, there were only two trees involved…
The bristlecone pine "adjustment" for CO2 fertilization in MBH99, while genuflecting to Graybill and Idso [1993], is completely different as seen in Figure 1 below.
 Continue reading →


Science – Feb. 11, 2005
There’s a combined discusison of MM05 (GRL) and MàÆàⵢerg et al [2005] in tomorrow’s Science, together with a new spaghetti diagram that differs from the MàÆàⵢerg rendering of proxy data a few posts ago.

Figure 1. Spaghetti Diagram, Kerr, Science Continue reading →