Hurricane Gustav

Sept 9: Updated to follow Hurricane Ike, and possible US impacts in the next 4-5 days

The North Atlantic tropics are becoming very active as the calendar approaches the climatological peak of the season (September 11). With high sea-surface temperatures and generally favorable atmospheric conditions (i.e. low vertical shear), every circulation or puff of convection must be watched for signs of organization. Josephine [is not too far behind] died…

Here are some handy model guidance maps and sites to follow the storm over the next week:


GFDL and HWRF model forecasts and GFS Forecast Maps

Model trends: animation of wind swaths of all of the previous HWRF and GFDL forecasts for Hanna. and now Ike

Meteorology models including NOGAPS, CMC, UKMET, GFS, FSU MM5 zoomed in on tropics…

Model
Spaghetti Hanna and Spaghetti Ike

There are plenty of weather blogs out there, so there is really no need to provide blow-by-blow coverage of Gustav’s (Hanna’s) track. However, as we are interested in numerical model performance, if you are going to provide landfall forecasts for location and intensity, please provide some logical reasoning.

Sea Ice Stretch Run #3

Continuation of Sea Ice Stretch Run #2.

WordPress upgrade imminent

Image representing WordPress as depicted in Cr...It’s late summer (or late winter in the SH) so it must be time to upgrade the blog to the latest and greatest WordPress edition. (why do I offer to do this? I must be mad)

Climate Audit is current on a lowly version 2.2.1 and the latest version is 2.6.1

Much to my surprise, WP upgraded without too much fuss on the test system, despite the re-engineering that has gone on since the last upgrade. Even the Tiga theme continued to work (wonders will never cease).

So in the next hour or so (after I’ve run a full backup), the blog will upgrade. During this process, things will appear to not work, but don’t worry – just come back in 30 minutes.

For those desperate to type something, the Climate Audit Forum is available and won’t be affected.

Update: The upgrade has finished. Please let me know what’s broken in the comments below (or if that’s broken, send an e-mail to climateaudit AT gmail.com )

Update #2: We are running on a new theme, “Atahualpa” by BytesForAll. Thanks to BFA for creating the theme, and helping us with tweaks to solve several display issues. (The previous “tiga” theme crashes CA, so it’s gone.)

Please comment if familiar elements are missing, or if you find bugs or browser incompatibilities in the new theme.

Update #3: There’s a handy new feature at CA. To link your comment to a previous comment in the thread, just click on the link under the comment number of interest. It says “reply and paste link” and will do just that: it pastes a properly formatted link to that comment, into your comment. You can actually paste as many links as you need. The link will survive any rearrangements and movements of comments, which is handy because spam and other snipped comments are regularly removed. Try it! (Sep 2: until now it worked intermittently. Fixed.)

December 1986 – Irony

In my post December 1986, I presented a histogram showing the GISS estimate of December 1986 minus the actual for GHCN stations in Europe and Russia. As noted, GISS under-estimated December 1986 for this region by a greater than 2 to 1 margin. The result was, when GISS combined multiple records for a single station, the stations with a cold estimate for December 1986 had their records artificially cooled pre-1987. By cooling the older record and leaving the current record unchanged, an enhanced warming trend was introduced.

I promised I would show other regions of the world in future posts. Therefore, in this post I present Africa, which essentially shows polar-opposite results from Europe / Russia.

In Africa, GISS tends to over-estimate December 1986 when combining records. Because the temperature is over-estimated, older records must be warmed slightly before they are combined with the present record. By introducing artificial warming in a past record, the overall trend through the present is cooled.

Following is a histogram showing the GISS estimate of December 1986 minus the actual for GHCN stations in Africa.

africa.GIF

The implication is that the GISS algorithm introduces a cooling trend to most African records.

Continue reading

Erice Seminar

In case any of you have been wondering about my radio silence, I’m currently in Erice, Sicily, where I’ll be participating in an Erice seminar, which I was re-working most of last week. We left on Sat night and it takes a while to get here. We stopped in Palermo on the way.

My topic is “Auditing 1000 Year Temperature Reconstructions”, so I’ll be commenting on the ‘other’ reconstructions as well. I’ve prettied up some graphics for the occasion and sharpened some analysis of the 2007 spaghetti graph, which I’ll share when I come back.

Climate is one morning session of the conference, – other sessions are on other controversial areas: Energy Policy, Pollution, Diseases, etc.

I’m a pretty small fish, but pleased to be here. Chris Essex is chair of our session, other speakers at our session are Anastasios Tsonis and Kyle Swanson of U of Wisconsin. It’s hard to figure out priorities for a 20 minute talk for people who don’t know your issues.

Erice is in the northwest corner of Sicily about 1 hour from Palermo. It’s a postcard town, retaining its medieval streets. Cars are abandoned and you walk around on cobblestone streets. The town is about 800 meters in elevation and overlooks the coastline with some magnificent views. It was apparently founded by the Phoenicians and, like the rest of Sicily, has had a complicated history of occupation by different civilizations.

A small point about Palermo which I’ll mention, but I don’t want people to discuss. One of the most noticeable things about the traffic- and it’s heavy – is how few Japanese cars there are and how many different small cars they have, it was like a different car language. Unlike North American manufacturers, Fiat has fought off the imports. I don’t know whether it’s trade policy or what, but I don’t think that I saw any Hondas or Nissans, definitely no Lexus, the odd Toyota Yaris, which represents the size of the typical Fiat here. I saw a Matiz about the same size under both a Daewoo brand and a Chevrolet brand; you’d think that there would be a market for that sort of car in Canada today given the energy prices.

I’ll try to check in but will be a bit spotty checking in over the next 2 weeks. The conference ends on Sunday; my wife is with me and we’ll go to Sorrento for a few days and then to Rome for a few days. Bob Carter and Andrew Revkin are both coming to the conference.

Pielke Jr discusses the Bishop and the Stick

Roger A.Roger Pielke Jr has written a gracious post , following up on Bishop Hill’s post and considering the issues as they pertain to science policy, and, in particular, the processes of peer review and due diligence, which have informed many of my posts.

He refers to and reconsiders a post that I wrote for Prometheus a couple of years ago on the importance, if any, of the Stick debate. It is nice to see that my position on this has been pretty consistent – that I didn’t argue that it turned AGW theory upside down, but neither was it a nothing. In particular, given the prominence of its usage in IPCC TAR and the subsequent problems, I said very clearly that if I had been a manager or principal of the next IPCC report, I would have wanted to understand very clearly what, if anything, was wrong with it, and how we could avoid such mistakes in the future.

December 1986

coinflip39.jpgAfter I posted GISS Spackle and Caulk, a number of commenters marveled at the symmetry of the histogram (GISS temperature estimate minus actual temperature). Some were dismayed that there was not a clear warming bias in the plot. Others were giddy for the very same reason. A few noted (as I hoped) that the differences tended to be rather large, but most seemed content with the fact GISS could hit the side of a barn from five feet.

No one should be surprised with the shape of the histogram. The “simulation” I performed required that all three months be available in a specific season for a specific station in order to calculate an estimate and compare it to the real value. For example, if summer 1957 was being tested, I needed June, July and August. If August were missing, the GISS algorithm would not be able to estimate June or July, and I would not have a real August to look at either.

With all three months available, I forced symmetry into the result. For every over-estimated August I needed a corresponding under-estimated June or July. The algorithm demanded that if I estimate all three months, their average must match the true average.

However, that is akin to saying that if I flip a coin often enough, the number of heads will be roughly equal to the number of tails. As most of us have experienced, coin flipping can be quite streaky. It is not uncommon to flip eight heads in a row. But having flipped that many heads does not change the probability of the next coin flip.

And so it goes with temperatures. In the actual application of the GISS algorithm, at most one month in a season can be estimated, so symmetry is not guaranteed. If one month is estimated more than another, it might be possible to introduce asymmetry.

As chance would have it, one specific month-year GHCN entry has had its temperature estimated by GISS far more than any other combination in the record. And as luck would have it, we have real GHCN data to compare against those estimates.

Continue reading

Bishop Hill: Caspar and the Jesus Paper

Reader Perry writes in reporting an interesting narrative of the Caspar Ammann affair at Bishop Hill’s blog here. IT is a detailed narrative written in a lively style of a story that’s been followed here for a few years and re-visited last week with the release of the Ammann SI.

The article is very flattering to the proprietor of this blog 🙂 ; I appreciate the interest and the thought. Most readers of the blog will enjoy the story, I did.

Bishop HIll leads as follows:

“There has been the most extraordinary series of postings at Climate Audit over the last week. As is usual at CA, there is a heavy mathematics burden for the casual reader, which, with a bit of research I think I can now just about follow. The story is a remarkable indictment of the corruption and cynicism that is rife among climate scientists, and I’m going to try to tell it in layman’s language so that the average blog reader can understand it. As far as I know it’s the first time the whole story has been set out in a single posting. It’s a long tale – and the longest posting I think I’ve ever written and piecing it together from the individual CA postings has been a long, hard but fascinating struggle. You may want to get a long drink before starting, and those who suffer from heart disorders may wish to take their beta blockers first.”

GISS Spackle and Caulk

Earlier this year I did a post on the amount of estimation done to the GHCN temperature record by GISS before generating zonal and global averages. A graphic I posted compared the amount of real temperature data with the amount of estimation over time. To read the graphic, consider 2000 as an example. As of February 7, 2008 there were 3159 station records in the GHCN data with an entry for the year 2000. Of those station records, 62% were complete and an annual average could be fully calculated. Another 29% were incomplete, but contained enough monthly data that the GISS estimation method kicked in. The final 9% were so incomplete that no estimation could be done.

What I did not explore at the time and would like to look more closely here is the accuracy of the estimation. One would hope with so much infilling going on that the accuracy would be rather high (I will leave the determination of “high accuracy” for a later time). Because I did not have real data to compare with the GISS estimations, I took another approach. I used the GISS method to estimate real temperature data as if that data were missing.

Recall that GISS never explicitly estimates missing monthly temperatures. What they do is estimate seasonal averages when one monthly temperature is missing but the other two are present. Similarly, an annual temperature can be estimated when one seasonal value is missing but the other three are present. Using this methodology GISS can estimate an annual temperature when as many as six monthly values are missing.

While no explicit monthly estimate is recorded by GISS, it certainly can be derived from the seasonal estimate. I have shown several times a one-line equation that exactly reproduces the GISS seasonal  estimate. Leaving a subsequent derivation as an exercise for the reader, the implied monthly estimate can be found from that equation and is expressed as follows:

A_{e} = \bar{A} + \frac{1}{2}\left( B-\bar{B}\right) + \frac{1}{2}\left( C-\bar{C}\right)

where the average values for A, B, and C are calculated from all valid entries for the given month in a particular station record.

Now to test the estimation accuracy. In Connecticut, December 2006 was warmer than normal, but February 2007 was colder than normal. Looking at the records for Hartford, CT, we see the following monthly and seasonal temperatures:

Dec 2006: 3.3
Jan 2007: -0.3
Feb 2007: -4.6
DJF: -0.5

If the December 2006 record were missing from Hartford, GISS would estimate a value of -0.7 C, which would yield a seasonal average of -1.9 C. Similarly, if February 2007 were missing, GISS would estimate it at 1.7 C and produce a  seasonal average of 1.6 C. That’s a 4.0 degree miss for Dec, a 6.3 degree miss for February, and a 3.5 degree swing at the seasonal level.

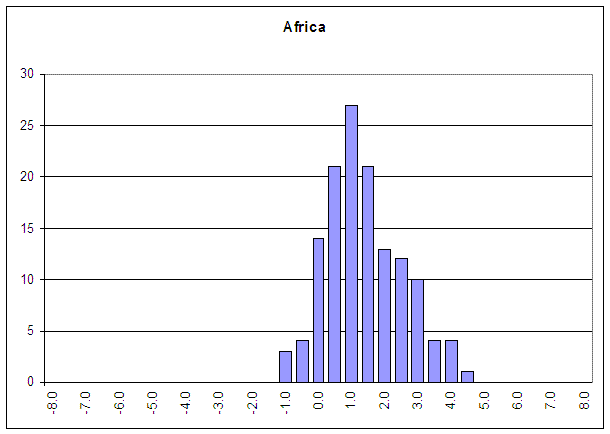
The winter of 06-07 in Connecticut was a bit of an oddball. I really wanted to know what the typical error looked like. To do that, I performed the same calculation on all GHCN v2.mean records.

Continue reading

Reconciling to Wahl and Ammann

When Wahl and Ammann’s script first came out, I was able to immediately reconcile our results to theirs – see here. As Wegman later said:

when using the same proxies as and the same methodology as MM, Wahl and Ammann essentially reproduce the MM curves. Thus, far from disproving the MM work, they reinforce the MM work.

You’d never know this from Team and IPCC accounts of the matter, but this is actually the case. The most recent Wahl and Ammann fiasco with their RE benchmarks is merely one more example.

While they archived their code (excellent), it wasn’t set up to be turnkey, nor is their most recent code. My own code at the time wasn’t turnkey either, since my original concept in archiving code was really to provide documentation. However having started down that road, it’s not much extra time or trouble to make things turnkey and, aside from the convenience to readers, there are considerable advantages for one’s own personal documentation in buttoning up code so that it’s turn key. When I picked up this file again in connection with the recently archived Ammann SI, I re-visited my script implementing Wahl and Ammann’s code. I modified it slightly to make it turnkey.

I also modified it slightly so that I could readily prove that our results reconciled exactly to theirs, also with turnkey scripts, as I reported in May 2005. This reconciliation is demonstrated below on a line by line basis, which also serves to illuminate the structure of the calculations in a useful way.
Continue reading