Svalgaard #7

Continues http://www.climateaudit.org/?p=3052

Indiana Jones and the Hollerith Punch Cards

I’ve been foraging through ICOADS SST data for the past week and have a number of posts in progress. Here’s a diagram that I’m planning to do several comments on. It shows information on the provenance of ICOADS data between 1850, the start of the HadCRU SST record, and the present. It is very obvious that this is far from being a homogeneous network.

In recent times, the most dominant change is one that has been mentioned in recent discussion only as an aside – the change from virtually measurements being done by ship in the 1940s to the present day where measurements are done by buoys, both drifting and moored. The CRU adjustment in December 1941 coincides with the WW2 upspike in proportion of U.S. measurements. Despite the subsequent return to a more “business as usual” situation after the WW2, the Dec 1941 adjustment was not unwound. Indeed, the premise of subsequent SST estimates was that the measurement systems in 1942 remained homogeneous from then to present. The most recent CRU position is that adjustments need to be reset after WW2 to prewar levels and then re-introduced through the 1960s, after which matters remain homogeneous to the present.

coadsp40.gif
Figure 1. Proportional contribution of ICOADS data 1850-1998. Left – data provided by Scott Woodruff for Woodruff et al 2005 up to 1949; right – data used in Thompson et al 2008 from 1941-1998. Red – US; pink – UK; blue – Netherlands; cyan – Germany; green – USSR; yellow= Japan;turquoise – unallocated “HSST” records; dark orange – Other (with identified nationality); orange – Other or Unknown( Including buoys).

For comparison, here is the corresponding plot for total number of measurements to 1950, which is the only information that I’ve been able to acquire so far in this format. Right is an excerpt from Rayner et al 2006, bring the same data up to the present.

coadsp28.gifcoadsp31.jpg

Anyway, there’s lots to dwell on this diagram, which I’m going to re-visit. Notice the interesting distribution of data sources in the 19th century. Between ~1860 and WW1, there’s no American data, even though the exchange of marine data and the first conference (Brussels 1853) was inspired and organized by an American, Lt Matthew Maury, about whom more on another occasion. Surprisingly to me, the British contribution was surprisingly small, given one’s impression of the dominance of UK shipping in the 19th century. The largest assigned contributions are Dutch (blue), German(cyan). The turquoise data in the 19th century is data where early keypunching did not preserve the country of origin. Nearly 100% in the 1860s is Dutch. Who would have expected that? The first part of the 20th century is marked by huge surge in German data – reaching nearly 50% of all data at the start of WW1.

The entry of the German data – all from a single source – into the data base appears to have had an interesting story, hinted at in a laconic paragraph in Woodruff et al 2005 that caught my eye.

One of these original card decks, 192, was “punched by the German Meteorological Service [now the Deutscher Wetterdienst (DWD)] during the Nazi regime from German ship observations made during the period 1859–1939” (AWS-WB, 1958). During World War II this deck was captured by the UK, along with a land data (Kopenhagener Schluessel Synoptic Observations) deck (191) of comparable size that was captured by the US. These two decks were exchanged via a bilateral agreement reached in 1946. Approximately 37 500 original logbooks mainly for 1860–1945 are still available at DWD (Wagner, 1999).

The Dutch 19th century data has a somewhat similar vintage, described by Woodruff et al 2005:

Similarly, Dutch deck 193 (AWS-WB, 1954a), which is a predominant data source during the second half of the 19th century (see Figure 1), was the result of a keying project at the Koninklijk Nederlands Meteorologisch Instituut [Royal Netherlands Meteorological Institute] (KNMI) during 1935–1941. This deck consists primarily of Dutch (95.3%) logbooks, plus a small percentage of Swedish (3.4%) and other logbooks, most of which appear to have been lost during World War II (Wallbrink et al., 2003).

Apparently Spielberg and Lucas have wanted to do Indiana Jones 3 for a long time, but were stumped in thinking up a hook for the story – what Lucas called a MacGuffin. A MacGuffin being defined as follows:

A MacGuffin (sometimes McGuffin) is a plot device that motivates the characters or advances the story, but the details of which are of little or no importance otherwise. The element that distinguishes a MacGuffin from other types of plot devices is that it is not important what the object specifically is. Anything that serves as a motivation will do. The MacGuffin might even be ambiguous. Its importance is accepted by the story’s characters, but it does not actually have any effect on the story. It can be generic or left open to interpretation..

Surely the capture of the Hollerith punch cards stands a feat worthy of Indiana Jones and thus my suggestion to George Lucas: Indiana Jones and the Hollerith Punch Cards. I expect my royalty check any day now.

Perhaps reflecting its origins, ICOADS itself represents a remarkable intergenerational effort that seems to be governed by a different spirit than some other branches of climate science. Despite limited funding, ICOADS has placed an ENORMOUS data base online, including not just SST, but wind and numerous other details. I’ve made several inquiries to ICOADS and received cordial and informative responses. A pleasant change from Fortress CRU, where Phil Jones did not want to even disclose the identity of stations in their data set, even to the extent of resisting Freedom of Information inquiries. My impression is that there is a substantial amount of historical information that is undigitized and which ICOADS would like to get to. For whatever it’s worth, I support this.

Unthreaded #35

Did Canada switch from Engine Inlets in 1926 Back to Buckets?

Folland has been the leading IPCC authority on bucket adjustments. Folland et al 1993 carries out a comparison from early 1980s measurements of (presumably predominantly insulated) bucket and non-bucket measurements, arguing that the difference was about 0.08 (less than 0.12-0.18 suggested in 2006 by Kent and Kaplan.

They reported a puzzling situation in the Gulf of Alaska where, according to the data base used for the comparison, Canadian data came from “buckets or unknown instrumentation” (Folland allocates “unknown instrumentation” in with buckets for the purpose of his comparison as shown below and states that Japanese data is classified in their data bases as also coming from “buckets or unknown instrumentation”. He goes on to observe that WMO 47 says that over 90% of Japanese data came from engine inlets and accordingly should have been in the opposite pool. One wonders why they wouldn’t have simply written to the Japanese and asked them to clarify the matter. How hard would that have been?

follan1.gif

Folland’s allocation of Canadian data to the bucket pool also caught my eye. The discussion of Brooks (1926!) included a comment from a Canadian saying that they were already obtaining accurate SST measurements from engine inlet pipes by 1926. I would be highly surprised if Canadian ships in the 1980s had reverted to the use of buckets. Again, how hard would it have been for Folland to have written to someone in Canada and asked for this information to be confirmed.

follan7.gif

I double checked my reading of Folland et al 1993 to be sure that he had really allocated unknown measurements to buckets. If you don’t know how something was measured, what conceivable purpose would there be in including it in one’s comparisons? Here’s the original statement of methodology describing the construction of one group of (a) buckets and unknown instrumentation; and (b) “unflagged” data assumed to be engine inlet and hull sensor (see p 111.)

follan10.gif

A reader of this might say that there might be some interpretation of this language under which unknown instrumentation was identified, but not necessarily pooled with buckets. If this were the only statement, then I’d be inclined to seek further clarification from the authors. However, later (p 112), they note that incorrect inclusion of engine inlets classified as “unknown” into the bucket class could lead to an under-estimate of bucket-non bucket differential, a differential that Folland et al 1993 cap at about 25%.

follan11.gif

Folland et al 1993 also has a couple of interesting comments on the timing of the introduction of insulated buckets into the UK fleet. On page 97, they stated that:

the U.K. voluntary observing fleet changed from the predominant use of uninsulated canvas buckets to that of insulated (black) rubber buckets in the 1960s and early 1970s.

Thompson et al 2008 stated that:

after the mid-1960s are not expected to require further corrections for changes from uninsulated bucket to engine room intake measurements.

Now I’m not in a position to know the precise schedule of the transition from uninsulated to insulated buckets, but, insofar as the U.K. voluntary observing fleet is concerned, Folland’s statement in 1993 that the transition was taking place in the 1960s and early 1970s hardly justifies the conclusion that the conversion had been completed by the mid-1960s. If the conversion was say only 33% or 50% complete, then some portion of the adjustment would get pushed later into the record. (And this is aside from the point previously made that insulated buckets seem to be intermediate between uninsulated buckets and engine inlets and thus some portion of the total allocation of the adjustment, whatever it is, has to be spread into the 1970s and later when the conversion of insulated buckets to engine inlets was being completed.

And by the way, isn’t it bizarre that engine inlet techniques, already available in 1926, were still not be utilized in the 1960s?

References:
BROOKS, CF. 1926. OBSERVING WATER-SURFACE TEMPERATURES AT SEA. Monthly Weather Review 54, no. 6: 241-253. url
Folland, C. K., R. W. Reynolds, M. Gordon, and D. E. Parker. 1993. A Study of Six Operational Sea Surface Temperature Analyses. Journal of Climate 6, no. 1: 96-113.

Lost at Sea: the Search Party

Uninsulated Buckets
A CA reader emailed me, observing that there may be relevant differences in insulated and uninsulated buckets in the post-World War 2 period, which could easily affect adjustment schedules. This makes a lot of sense to me and might reconcile a few puzzles and opening others.

Let’s say that the delta between engine inlet temperatures and uninsulated buckets is ~0.3 deg C (and here we’re just momentarily adopting one of the canonical Folland numbers as this particular number surely deserves to be cross-examined). Insulated buckets would presumably be intermediate. Kent and Kaplan 2006 suggest a number of 0.12-0.18 deg C. So for a first rough approximation to check our bearings on this – let’s suppose that it’s halfway in between. Maybe it’s closer to engine inlets, maybe it’s closer to uninsulated buckets. We’re not trying to express viewpoints on such conundrums here – we’re merely examining what assumptions are latent in the temperature estimates.

We know that 90% of all measurements in 1970 with (supposedly) known provenance were done by buckets (Kent et al 2007), while there was a turnover in proportion to about 90% engine inlet and hull sensor by the 2000s. In my first cut at estimating the effect of unwinding some of the erroneous adjustment assumptions, I posited that the above information implied that the 0.3 deg C adjustment between buckets and engine inlets didn’t disappear merely because of reversion to “business as usual” after WW2. On this information, the only time that the delta could be introduced was between 1970 and 2000. This in turn poses new conundrums, as you’re getting into periods with satellite measurements. So there are issues with pushing the delta entirely into the post-1970 period.

However, let’s suppose that there was a transition from predominantly uninsulated buckets immediately post-WW2 to predominantly insulated buckets as at 1970 or so. Then the 0.3 deg C total adjustment would be spread proportionally between the two periods – with the delta between uninsulated buckets and insulated buckets being allocated to the 1945-1970 period or so (together with other relevant instrumental changes) while the delta between insulated buckets and engine inlets would be allocated to the 1970-2005 period (again together with any other relevant instrumental drifts e.g. changing proportion of hull sensors, buoys, whatever.)

I’m headed away for the weekend, but I’ll redo my rough guess based on these variations in a day or two.

A couple of observations, which readers should bear in mind.

In doing an “audit”, if an auditor identified a situation where the assumptions did not warrant the conclusions (e.g. the IPCC hypothesis of a sudden and permanent changeover to engine inlets at Pearl Harbour), he would not substitute his own assumptions; he would reject the assumptions and throw the problem back at the authors. I’ve been pretty consistent about this in the proxy areas, avoiding the temptation to posit what really happened. I don’t want to go beyond this policy here either.

Now I did a graphic showing the impact of abandoning the Pearl Harbour hypothesis under certain other assumptions. Please construe any such calculation as equivalent to a sensitivity calculation to show the effect of (say) excluding bristlecones, to illustrate the impact of certain assumptions, but not advocacy of a specific alternative. My language at the time may not have been explicit on this, but it’s the way that I do things. There are any number of intricacies in the interpretation of SST buckets. What are the effects of hull sensors? Drifting buoys? Etc. etc. I have no information on such matters at present. Could hull sensors and drifting buoys offset changeover from insulated buckets to engine inlets? Could be. I’m not opining on this. I’d like to see proper expositions of these populations and biases and one of the good outcomes of Thompson et al is that it will almost certainly achieve this goal.

As to my original observations on this: I was in a position to observe that the Pearl Harbour assumption did not hold up and that the 0.3 deg C adjustment did not occur in one bite in 1941, but needed to be spread much later. Right now, as noted above, it looks like some proportion gets spread to the period before 1970 and some proportion after 1970.

I might also make a point here about reviewing. Posts at this blog are not “peer reviewed”, but they are read by a lot of people, who have an opportunity to comment on them. In this particular case, a reader drew my attention to a distinction between insulated and uninsulated buckets that I hadn’t thought about and which makes sense in the context. One could make a case that blogs are actually a very good way of carrying out review of articles. In economics, journals like articles to have been around for a while and to have been reviewed in a variety of venues before being published; the whole idea of embargo-to-publication that has been promulgated by Nature and Science seems like something that needs to be talked about.

The audience is also astonishingly active. Demetris Koutsoyannis wrote to thank me a favorable recent comment; he said that he got 2700 downloads of the article in one day after being recently mentioned and linked at Climate Audit and 5700 since then, with the vast majority coming directly from CA. It’s no accident that we rank so high on any number of Google searches.

Provenance Bias versus Sudden Changeover
A second point that I’d like to quickly mention before leaving for the week-end.

My original criticisms were based on the arm-wavingness of assuming that there was a “sudden but undocumented” change in observing procedures coinciding with Pearl Harbour. This seemed far too much like Briffa’s Cargo Cult explanation – and originated once again from essentially the same crowd. Here is the precise quote from Folland and Parker 1995 (originally cited here in 2005):

Barnett (1984) gave strong evidence that historical marine data are heterogeneous. He found a sudden jump around 1941 in the difference between SST and all-hours air temperatures reported largely by the same ships. Folland et al. (1984) explained this as being mainly a result of a sudden but undocumented change in the methods used to collect sea water to make measurements of SST. The methods were thought to have changed from the predominant use of canvas and other uninsulated buckets to the use of engine intakes. Anecdotal evidence from sea captains in the marine section of the Meteorological Office supported this idea. .

or again:.

The abrupt change in SST in December 1941 coincides with the entry of the USA into World War II and is likely to have resulted from a realization of the dangers of hauling sea buckets onto deck in wartime conditions when a light would have been needed for both hauling and reading the thermometer at night. The change was made possible by the widespread availability of engine inlet thermometers in 1941 (section 4)

Now there is a real discontinuity in World War 2 and it’s related to the above. Thompson et al 2008 provide a far more plausible and convincing explanation of this discontinuity than the one provided by Folland and Parker 1995. It’s partly a difference in nuance, but the difference is important. Here is a graphic from Thompson et al 2008 showing a change in US contribution to the total population of SST measurements. Clearly the discontinuities in the increased proportion of US measurements (engine inlet) to the total population in WW2 is directly connected to discontinuities in the SST history. It’s not that thousands of ships suddenly and overnight changed how they did things; it’s that the data sources changed. In a way, it’s exactly like the Hansen Y2K problem.

thomps1.gif
From Thompson et al 2008. Bottom panel shows US/UK proportions.

This explanation makes sense, while the Folland and Parker 1995 one doesn’t. If you then look at their graphic with this idea in mind, one wonders what is happening in the 1960s, when US contribution inexplicably goes to nearly zero for a while, which seemingly coincides with a downdip in world SST, with a later sharp increase in US contribution coinciding with an increase.

Wooden Buckets

Left undiscussed by Thompson et al 2008 is the thorny issue of wooden buckets prior to 1940. One of the distinctive innovations of Folland in the 1980s and Jones et al 1991 was the hypothesis that heavy wooden buckets (which behaved like insulated buckets) were used in the 19th century, with a more or less linear changeover to uninsulated canvas buckets.

In the last few days, I’ve been reading some of the older literature on buckets. Brooks (Weather Review 1924) is an early and interesting consideration, reporting on experimental comparisons of canvas bucket and engine inlet measurements in a variety of situations. There’s not a whiff of mention of wooden buckets. One of the discussants of the paper wonders why they use canvas buckets at all, when engine inlet appears superior; and another says that it’s just a holdover from sailing vessels. Another discussant mentions the use of engine inlet measurements by the Canadian Meteorological Service in the NW Pacific, a point that may tie in to an issue in Rayner et al 2006 [note to self].

Folland and Parker 1995 carried out elaborate measurements on heat dissipation from an oak bucket, noting, in passing, that there was no evidence that this type of oak bucket had ever been used to measure SST.

A nineteenth-century oak ships’ bucket covered in iron bands has been studied though there is no indication that it was used for taking sea temperatures

This did not stop the development of an elaborate adjustment methodology based on a transition from oak buckets to canvas buckets, a transition which had the effect of lowering adjusted 19th century temperatures relative to what would have been calculated if canvas buckets had been used.

Surely at some point, someone has to show that these wooden buckets actually were used in the 19th century. If I had to take a stab at it right now, I think that it’s far more likely that canvas buckets were used until engine inlet changeover and that it would be well worthwhile doing a variation on this assumption. Also the assumption of 0.3 deg C isn’t necessarily written in stone. Brooks 1924 observed many values well in excess of this. Saur 1963 (J Appl Met online) is an interesting direct comparison of bucket and engine inlet measurements on the same voyage – the sort of evidence one would like to see more of – and the differences were higher than 0.3 deg C.

Whatever the end result, there are a lot of models being developed on this sort of information and careful cross-examination of the wooden buckets is long overdue.

Climate scientists should think about data quality more often, says Jones

After unveiling the Hadley Center adjustment error that has been used in all temperature compilations for the past 20 years, Phil Jones stated:

Climate scientists should think about data quality more often, says Jones, so that there is no opportunity for incorrect data to sow seeds of doubt in people’s minds about the reality of climate change.

This is the same Phil Jones who said:

We have 25 or so years invested in the work. Why should I make the data available to you, when your aim is to try and find something wrong with it. There is IPR to consider.

Peter Webster, like Hans von Storch before him, was nonplussed at this attitude and, at his request, I provided the supporting email in a comment on another thread, noting that von Storch, also in disbelief, had contacted Phli Jones directly for confirmation, obtaining such personal confirmation, which von Storch had then reported to the NAS panel, as I discussed here, linking to von Storch’s PPT.

During the past few years, I’ve posted progress reports on CRU’s obstruction of efforts to find out even the simplest information about how they do their calculations – things as simple as a list of stations in their temperature calculations. These progress reports are scattered through many posts and I’ve collated into a PDF online here, covering two topics:

1) efforts to identify the station data used in CRU temperature analyses, and, once that had been refused, efforts to obtain even a list of stations used by SRU. Two generations of inquiry are shown, first by Warwick Hughes in 2005 and then by Willis Eschenbach in 2006-2007, which after 3 years and countless attempts only resulted in a not quite complete list of stations.

2) efforts to obtain a list of stations used in Jones et al 1990, a prominent study purportedly proving that the UHI effect was inconsequential. Once this list was obtained, an examination of the list of Chinese stations by myself and Doug Keenan, showed that claims in Jones et al 1990 to have selected stations based on careful examination of station history metadata could not possibly be true, as such metadata did not exist, which led Keenan to file a complaint against one of the authors.

This collation draws on previous posts at Climate Audit and my correspondence files.

SST Revisions and Hurricanes

Judith Curry writes: we are obviously interested in the implications of this SST issue for hurricanes.

Lost at Sea

Thompson et al 2008, writing in Nature, assure their readers,

the data before ~1940 and after the mid-1960s are not expected to require further corrections for changes from uninsulated bucket to engine room intake measurements

Is there a shred of evidence to support this assertion? There is convincing evidence otherwise – evidence already reported here. While Thompson et al do confirm some Climate Audit observations, on essential points, their analysis is actually a step backwards from my 2007 posts.

The hypothesis of the original Hadley Center Windowed Marine De-trending program was that there was an approximate 0.3 deg C inhomogeneity between engine inlet SST measurements and canvas bucket measurements and that there was a drop-dead changeover on December 1941, a switch which continued in place to the present day. In earlier posts, I showed that there was strong documentary evidence against this assumption and hypothesized that there was a return to “business as usual” after the war. That’s not the only relevant information on the transition, as I’ll show below.

Thompson et al 2008 agree that there was a return to “business as usual” after the war, citing related but somewhat different evidence than presented here: they observed that wartime measurements were predominantly U.S., which they say were engine inlet, while U.K. measurements come back into play after the war, using a ~0.3 deg C estimate. They observe:

The Met Office Hadley Centre is currently assessing the adjustments required to compensate for the step in 1945 and subsequent changes in the SST observing network. The adjustments immediately after 1945 are expected to be as large as those made to the pre-war data (~0.3 deg C; Fig. 4).

This was also the conclusion in the prior Climate Audit post and is fair enough as a first estimate. They go on to say:

smaller adjustments are likely to be required in SSTs through at least the mid-1960s, by which time the observing fleet was relatively diverse and less susceptible to changes in the data supply from a single country of origin …

the data before ~1940 and after the mid-1960s are not expected to require further corrections for changes from uninsulated bucket to engine room intake measurements.

They’ve worded their comment on the early bucket adjustments carefully, as there’s lots of hair on these early adjustments and these adjustments need to be minutely scrutinized. But on the post-1960s period, they have completely lost their bearings and are, so to speak, lost at sea.

Thompson et al 2008 cited Kent et al 2007, an important discussion of metadata, but they completely failed to discuss or cite the most relevant graphic in Kent et al – a graphic previously reproduced at Climate Audit on a number of occasions – and reproduced one more time below. This graphic, based on a very comprehensive examination of metadata, showed the distribution of measurement type from 1970 to 2006.


Figure 2f from Kent et al 2007.

In 1970, as I observed last year, about 90% (this is a visual estimate from the graphic) of SST measurements, for which the type is known, were done by buckets. Because the proportion with metadata is a very large sample, it’s plausible to use this 90% estimate for the entire population, including the unknown population.

Between 1970 and 2006, the proportion of bucket and engine inlet measurements is more or less reversed, with about 90% of SST measurements in the 2000s being engine inlet or hull sensor, the latter by the way, being a further addition to the witches’ brew that the Nature boys didn’t mention at all. The starting point of all this was that there is about a ~0.3 deg C bias between engine inlet and buckets.

However, Thompson et al 2008 completely failed to grasp the significance of this graphic. The changeover to engine inlet measurements, previously attributed to a drop-dead date in 1941, actually took place AFTER 1970 (providing, of course, for a one-off WW2 adjustment ending in 1945). If the same ~0.3 deg C consistently used by Hadley Center is applied after 1970, as this information shows, this comes off the post-1970 SST trend (and has to be allocated much earlier, as proposed last year at Climate Audit, ) refuting the claims of Thompson et al that no substantial changes are required to the post-1965 record, a point that should be obvious to anyone thinking for 5 minutes about the problem.

Thompson et al 2008 observe that the 0.3 deg adjustment looms relatively large in 20th century terms. They observe:

thus the amplitude of the drop is roughly 40% as large as the 0.75 deg C rise in [global temperature] from 1900 to 2006,

If, as outlined here, this 0.3 deg C adjustment has to come off the post-1970 record, as implied by the information at hand, it is a very large proportion of the post-1970 temperature increase, which is much reduced and allocated earlier in the century. Because the effect is so large relative to observed changes, the knock-on impact for attribution and modeling will not be small – whatever way it goes.

One hopes that this will also lead to an end to CRU secrecy on their source code, algorithms and data versions.

[UPDATE (May 30):
A reader has contacted me to say that buckets in the 1970s were predominantly insulated buckets not uninsulated buckets and that the differential between insulated buckets and engine inlets is less than between uninsulated buckets and engine inlets (say 0.1 deg C, versus 0.25-0.3 deg C). So there may be a couple of things going on in bucket world – a change from buckets to engine inlets and a change from uninsulated buckets to insulated buckets. The latter possibility was not clearly articulated in Thompson et al, or for that matter in the predecessor articles, but may nonetheless be a real effect. IF such transition were complete by the 1970s, then this would contain adjustments in the 1980s to ones resulting from differences between insulated buckets and engine inlets, which would be less than between uninsulated buckets and engine inlets. I’ll take a look at this. I’m going to look for discussion of the transition from uninsulated buckets now said to have been in use after WW2 to insulated buckets. This episode definitely confirms my very first point on these bucket adjustments: whenever the adjustments are as as large the effect being measured, then there needs to be a replicable description and careful assessment of all aspects of the adjustment process.]


References:

Folland, C. K., D. E. Parker, and F. E. Kates. 1984. Worldwide marine temperature fluctuations 1856–1981. Nature 310, no. 5979: 670-673.
Kent, E. C., S. D. Woodruff, and D. I. Berry. 2007. Metadata from WMO Publication No. 47 and an Assessment of Voluntary Observing Ship Observation Heights in ICOADS. Journal of Atmospheric and Oceanic Technology 24, no. 2: 214-234.
Parker, D. E., C. K. Folland, and M. Jackson. 1995. Marine surface temperature: Observed variations and data requirements. Climatic Change 31, no. 2: 559-600.

Nature "Discovers" Another Climate Audit Finding

In an article in Nature today by Thompson, Kennedy, Wallace and Phil Jones claim:

Here we call attention to a previously overlooked discontinuity in the record at 1945,

Well, folks, the discontinuity may have been overlooked by Hadley Center, CRU, NOAA and NASA and by the stadiums of IPCC peer reviewers, but it wasn’t overlooked here at Climate Audit. The absurdity of Team bucket adjustments had been discussed in two early CA posts (here, here, here ). In March 2007, after publication of Kent et al 2007 showed the prevalence of buckets as late as 1970 (discussed here), I showed in a post entitled The Team and Pearl Harbour that this directly contradicted the Team’s Pearl Harbor adjustment and even showed the impact of a more plausible phasing in of bucket adjustments (see below). The issue was re-visited in Dec 2007 here.

In the Nature news discussion, Jones stated:

Climate scientists should think about data quality more often, says Jones, so that there is no opportunity for incorrect data to sow seeds of doubt in people’s minds about the reality of climate change.

Amen. Maybe instead of concealing his data – even to the extent of obstructing FOI requests for the identity of his station data, Jones should provide a complete archive of his data and methods, so that there can be some independent due diligence on his data.

Briefly reviewing my earlier post, in March 2007, I wrote the following:

One of the Team’s more adventurous assumptions in creating temperature histories is that there was an abrupt and universal change in SST measurement methods away from buckets to engine inlets in 1941, coinciding with the U.S. entry into World War II. As a result, Folland et al introduced an abrupt adjustment of 0.3 deg C to all SST measurements prior to 1941 (with the amount of the adjustment attenuated in the 19th century because of a hypothesized use of wooden rather than canvas buckets.) At the time, James Hansen characterized these various adjustments as “ad hoc” and of “dubious validity” although his caveats seem to have been forgotten and the Folland adjustments have pretty much swept the field. To my knowledge, no climate scientist actually bothered trying to determine whether there was documentary evidence of this abrupt and sudden change in measurement methods. The assumption was simply asserted enough times and it came into general use.

This hypothesis has always seemed ludicrous to me ever since I became aware of it. As a result, I was very interested in the empirical study of the distribution of measurement methods illustrated in my post yesterday, showing that about 90% of SST measurements in 1970 for which the measurement method was known were still taken by buckets, despite the assumption by the Team that all measurements after 1941 were taken by engine inlet.

I first examined the effect of a gradual changeover to engine inlet measurements using the 1970 distribution of Kent et al as a benchmark. A Climate Audit reader (Carl Smith) observed

it looks to me like the WWII records were dominated by engine-warmed intake data, perhaps because the chaos meant much of the bucket data did not get recorded, and after WWII it was business as usual with mostly bucket data resuming.

I illustrated this scenario, describing it as follows.

Let’s suppose that Carl Smith’s idea is what happened. I did the same calculation assuming that 75% of all measurements from 1942-1945 were done by engine inlets, falling back to business as usual 10% in 1946 where it remained until 1970 when we have a measurement point – 90% of measurements in 1970 were still being made by buckets as indicated by the information in Kent et al 2007- and that the 90% phased down to 0 in 2000 linearly. This results in the following graphic:


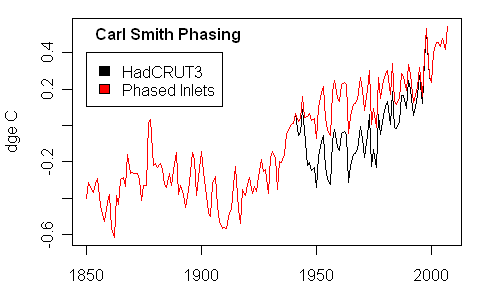
Black – HadCRU version as archived; red- with phased implementation of engine inlet adjustment

The transition from primarily bucket measurement in 1970 to primarily engine inlet in 2000 was supported by the following graphic in Kent et al 2007 discussed in last year’s posts e.g. here:

[UPDATE (May 30): A reader has contacted me to say that buckets in the 1970s were predominantly insulated buckets not uninsulated buckets and that the differential between insulated buckets and engine inlets is less than between uninsulated buckets and engine inlets (say 0.1 deg C, versus 0.25-0.3 deg C). So there may be a couple of things going on in bucket world – a change from buckets to engine inlets and a change from uninsulated buckets to insulated buckets. The latter possibility was not clearly articulated in Thompson et al, or for that matter in the predecessor articles, but may nonetheless be a real effect. IF such transition were complete by the 1970s, then this would contain adjustments in the 1980s to ones resulting from differences between insulated buckets and engine inlets, which would be less than between uninsulated buckets and engine inlets. I’ll take a look at this. I’m going to look for discussion of the transition from uninsulated buckets now said to have been in use after WW2 to insulated buckets. This episode definitely confirms my very first point on these bucket adjustments: whenever the adjustments are as as large the effect being measured, then there needs to be a replicable description and careful aassessment of all aspects of the adjustment process.]

Turning now to Nature’s news article describing this recent “discovery” by the Team:

The humble bucket turns out to be at the bottom of a perplexing anomaly in the climate records for the twentieth century.

A US–British team of climate scientists has now found a surprisingly simple explanation for the long-standing conundrum (page 646). It turns out that the mysterious drop is due to differences in the way that British and US ships’ crews measured the sea surface temperature (SST) in the 1940s.

Only a few SST measurements were made during wartime, and almost exclusively by US ships. Then, in the summer of 1945, British ships resumed measurements. But whereas US crews had measured the temperature of the intake water used for cooling the ships’ engines, British crews collected water in buckets from the sea for their measurements. When these uninsulated buckets were hauled from the ocean, the temperature probe would get a little colder as a result of the cooling effect of evaporation. US measurements, on the other hand, yielded slightly higher temperatures due to the warm engine-room environment.

The standard logbook entries made at the time contain no information about how the measurements were taken, so the cause was overlooked, says David Thompson, first author on the paper and an atmospheric scientist at the State University of Colorado in Boulder. As a result, the bias — which, although small, was large enough to produce the sharp drop in global mean temperature — was never adjusted for.

The article itself provides the following information on SST measurements:

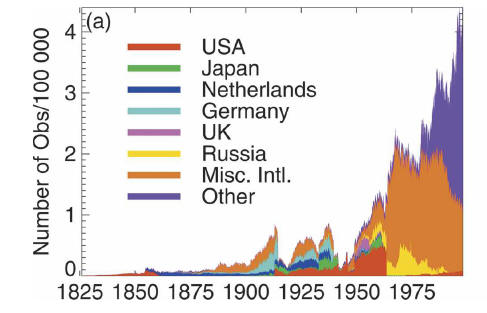
The most notable change in the SST archive following December 1941 occurred in August 1945. Between January 1942 and August 1945, ~80% of the observations are from ships of US origin and ~5% are from ships of UK origin; between late 1945 and 1949 only ~30% of the observations are of US origin and about 50% are of UK origin. The change in country of origin in August 1945 is important for two reasons: first, in August 1945 US ships relied mainly on engine room intake measurements whereas UK ships used primarily uninsulated bucket measurements, and second, engine room intake measurements are generally biased warm relative to uninsulated bucket measurements.

In our estimate, we hypothesized a wartime changeover to about 75% engine inlet, with business as usual after the war, then gradually going to the 1970 distribution of Kent et al 2007. Thompson et al estimate 80% changeover to engine inlet during the war, with a return to business as usual after the war.

It’s nice to see that the Team has discovered what we at Climate Audit have known for some time – the assumption that all SST measurements switched over to engine inlets in December 1941 was absurd, ad hoc and introduced without any justification or textual analysis. It remained in climate literature despite obvious evidence that the majority of reported SST measurements in 1970 were being done by buckets.

In an accompanying comment, Forest and Reynolds say:

The SST adjustment around 1945 is likely to have far-reaching implications for modelling in this period.

My guess is that the aerosol stuff is going to be heavily affected. Aerosol histories always seemed to be designed a little conveniently to accommodate the supposed post-WW2 cooling.

It’s too bad that this foolish assumption has contaminated surface temperature histories and that IPCC was incapable of identifying an error known here at Climate Audit. As Jones said,

Climate scientists should think about data quality more often

Update: Would it have been possible for a Nature editor or reviewer to have located this prior Climate Audit discussion? If they had googled “climate world war 2 adjustments”, the very first item earlier today was http://www.climateaudit.org/?p=1276 . The present post has now superceded the earlier post and is now ranked atop Google on this search. But simply googling the expression would have identified a prior discussion of the issue.

Here’s an updated version of the graphic posted up last year using data downloaded today.

sstadj1.gif

Update (June 1): Thompson et al stated:

The adjustments are unlikely to significantly affect estimates of century-long trends in global-mean temperatures, as the data before ~1940 and after the mid-1960s are not expected to require further corrections for changes from uninsulated bucket to engine room intake measurements. However, compensation for a different potential source of bias in SST data in the past decade— the transition from ship- to buoy-derived SSTs—might increase the century-long trends by raising recent SSTs as much as ~0.1 deg C, as buoy-derived SSTs are biased cool relative to ship measurements [10 – Worley et al 2005]

Whether or not this latter observation is correct, the citation, Worley et al 2005, provides no support for the assertion as the word “cool” is not used in it, nor do any occurrences of the word “buoy” contain supporting language.

Update Reference: Worley, S. J., S. D. Woodruff, R. W. Reynolds, S. J. Lubker, and N. Lott. 2005. ICOADS release 2.1 data and products. Int. J. Climatol 25, no. 7: 823–842. http://ftp.wmo.int/pages/prog/amp/mmop/documents/Jcomm-TR/J-TR-13-Marine-Climatology/REV1/joc1166.pdf

The Parking Lot Effect

An interesting post by regular CA commenter David Smith at Anthony Watts on his results quantifying local microsite effects on a thermometer placed near a parking lot. Interesting to compare this with efforts of Jones, Parker, Peterson etc. to “prove” that site effects don’t matter.